
✍️ 2025 Top 50 Maverick Charts! The Year in Independent Review! Maverick Special #10
50 Maverick Charts that simply say 100,000 words for the 2025 Snapshot!

Dear all,
are you ready for the New Year’s Eve and have a great start in 2026? I hope so, I am!
Before that, it’s time to review and highlight the 2025 Top 50 Maverick Charts!
There is a lot of value doing and going through this as we set the stage for 2026:
distinguishing between fundamentals and noise, seeing the "Forest for the Trees"
understanding the lag-times between policies and future economic reality
identifying Structural vs. Cyclical Shifts
strategic “Re-Anchoring” for investors and entrepreneurs of all kinds
educational value by gaining contextual depth on interconnected events
historical parallels as memories are surprisingly short in finance: X years from now when policies like Trade Wars or other industry booms (like AI now) come to town, will be a primary source for understanding how the markets and the economy adjusted to the specific variables of this era
forward looking: shape a 2026 outlook with a solid grounding and fresh views!
In January you will also get my top 2026 predictions which is quite a spicy, juicy and ‘dangerous’ business … 😉! So, let’s let the show begin!
✍️ 2026 Top 25 Maverick Predictions!
50 cherry picked Maverick Charts of the year say 1,000,000 words or more = the ‘How’!
Table of contents = the ‘What’! Executed in a succinct manner with the aim of a high density of ideas, because the best writing respects the reader’s time!
📊 Performance Overview
📊 Equities: S&P 500, Thematic and Single Stocks
📊 Macro & Fixed Income
📊 Currencies & Commodities
📊 Crypto
👍 Bonus: +200,000 views Maverick Tweet of the Year — Nasim Taleb retweet!
Objective: both data-driven insights + valuable food for thought = the ‘Why’!
📊 Performance Overview
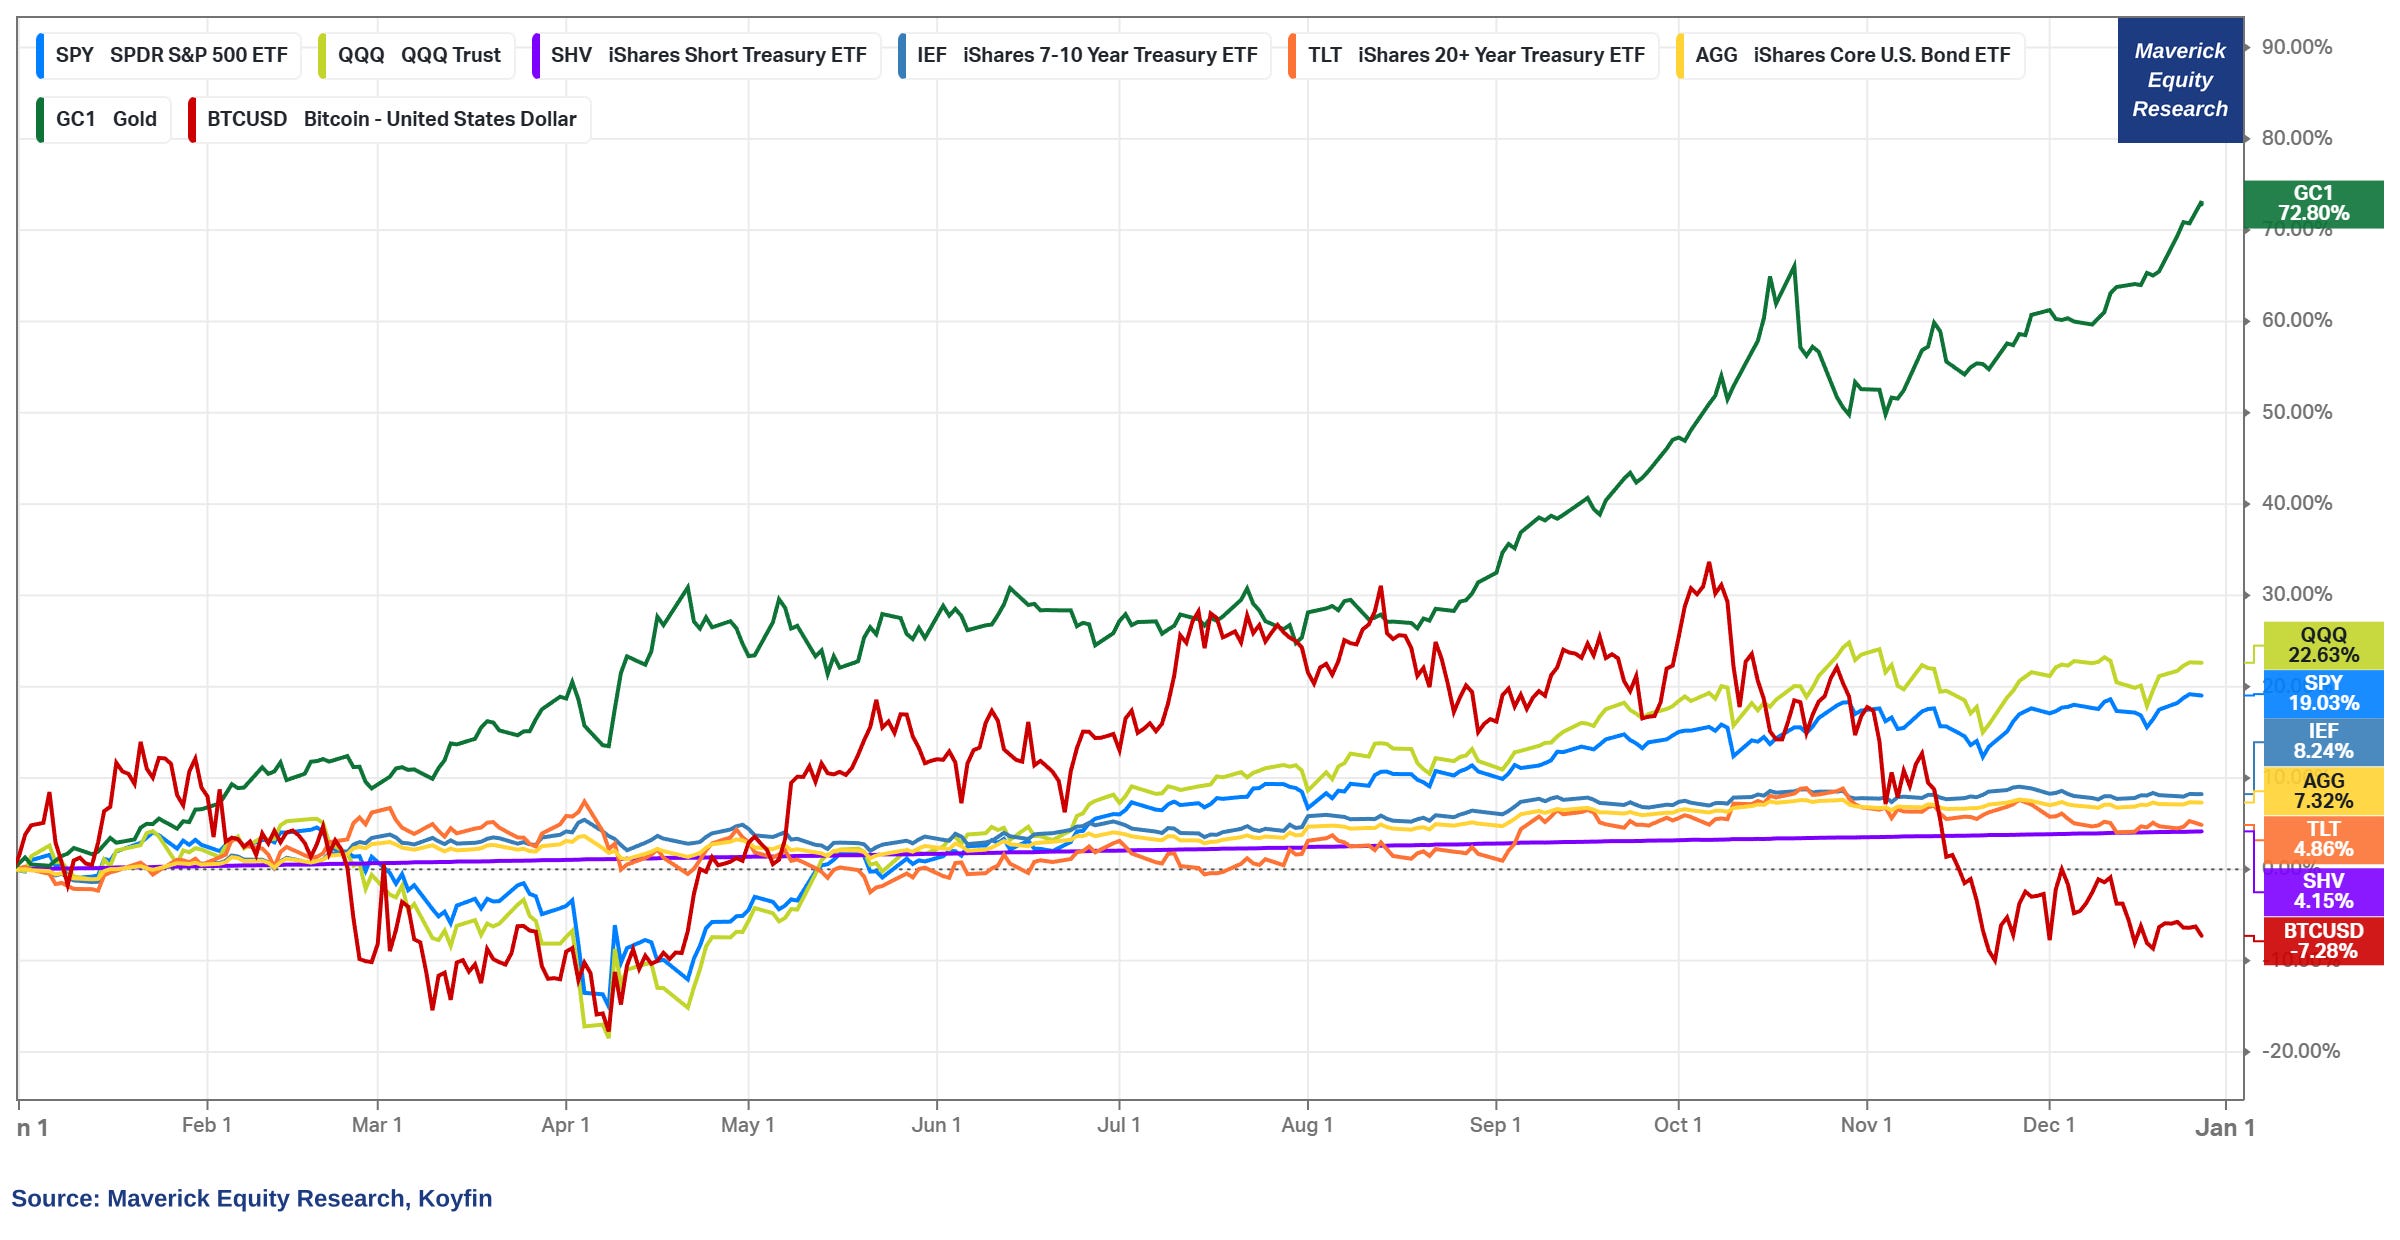
First of all, how did U.S. Stocks, Bonds, Gold and Bitcoin do in 2025?
👉 S&P 500 (SPY) continuing the big bull market with another great year: +19.03%
👉 Nasdaq 100 (QQQ) similarly with another whooping: +22.63%
👉 SHV (short-term treasury bills 1-year or less, cash proxy): +4.15%
👉 IEF (intermediate treasury notes between 7-10 years): +8.24%
👉 TLT (long-term treasury bonds +20-year maturities): +4.86%
👉 AGG (IG broad maturities: treasuries, corporate, MBS, ABS, municipals): +7.32%
👉 Gold shinning bright as the big outperformer with a mega run: +72.80%
👉 Bitcoin the big laggard: -7.28%
Overall, the vast majority of investors should be very happy with 2025!
More nuances and rationale on these performances will be presented below.
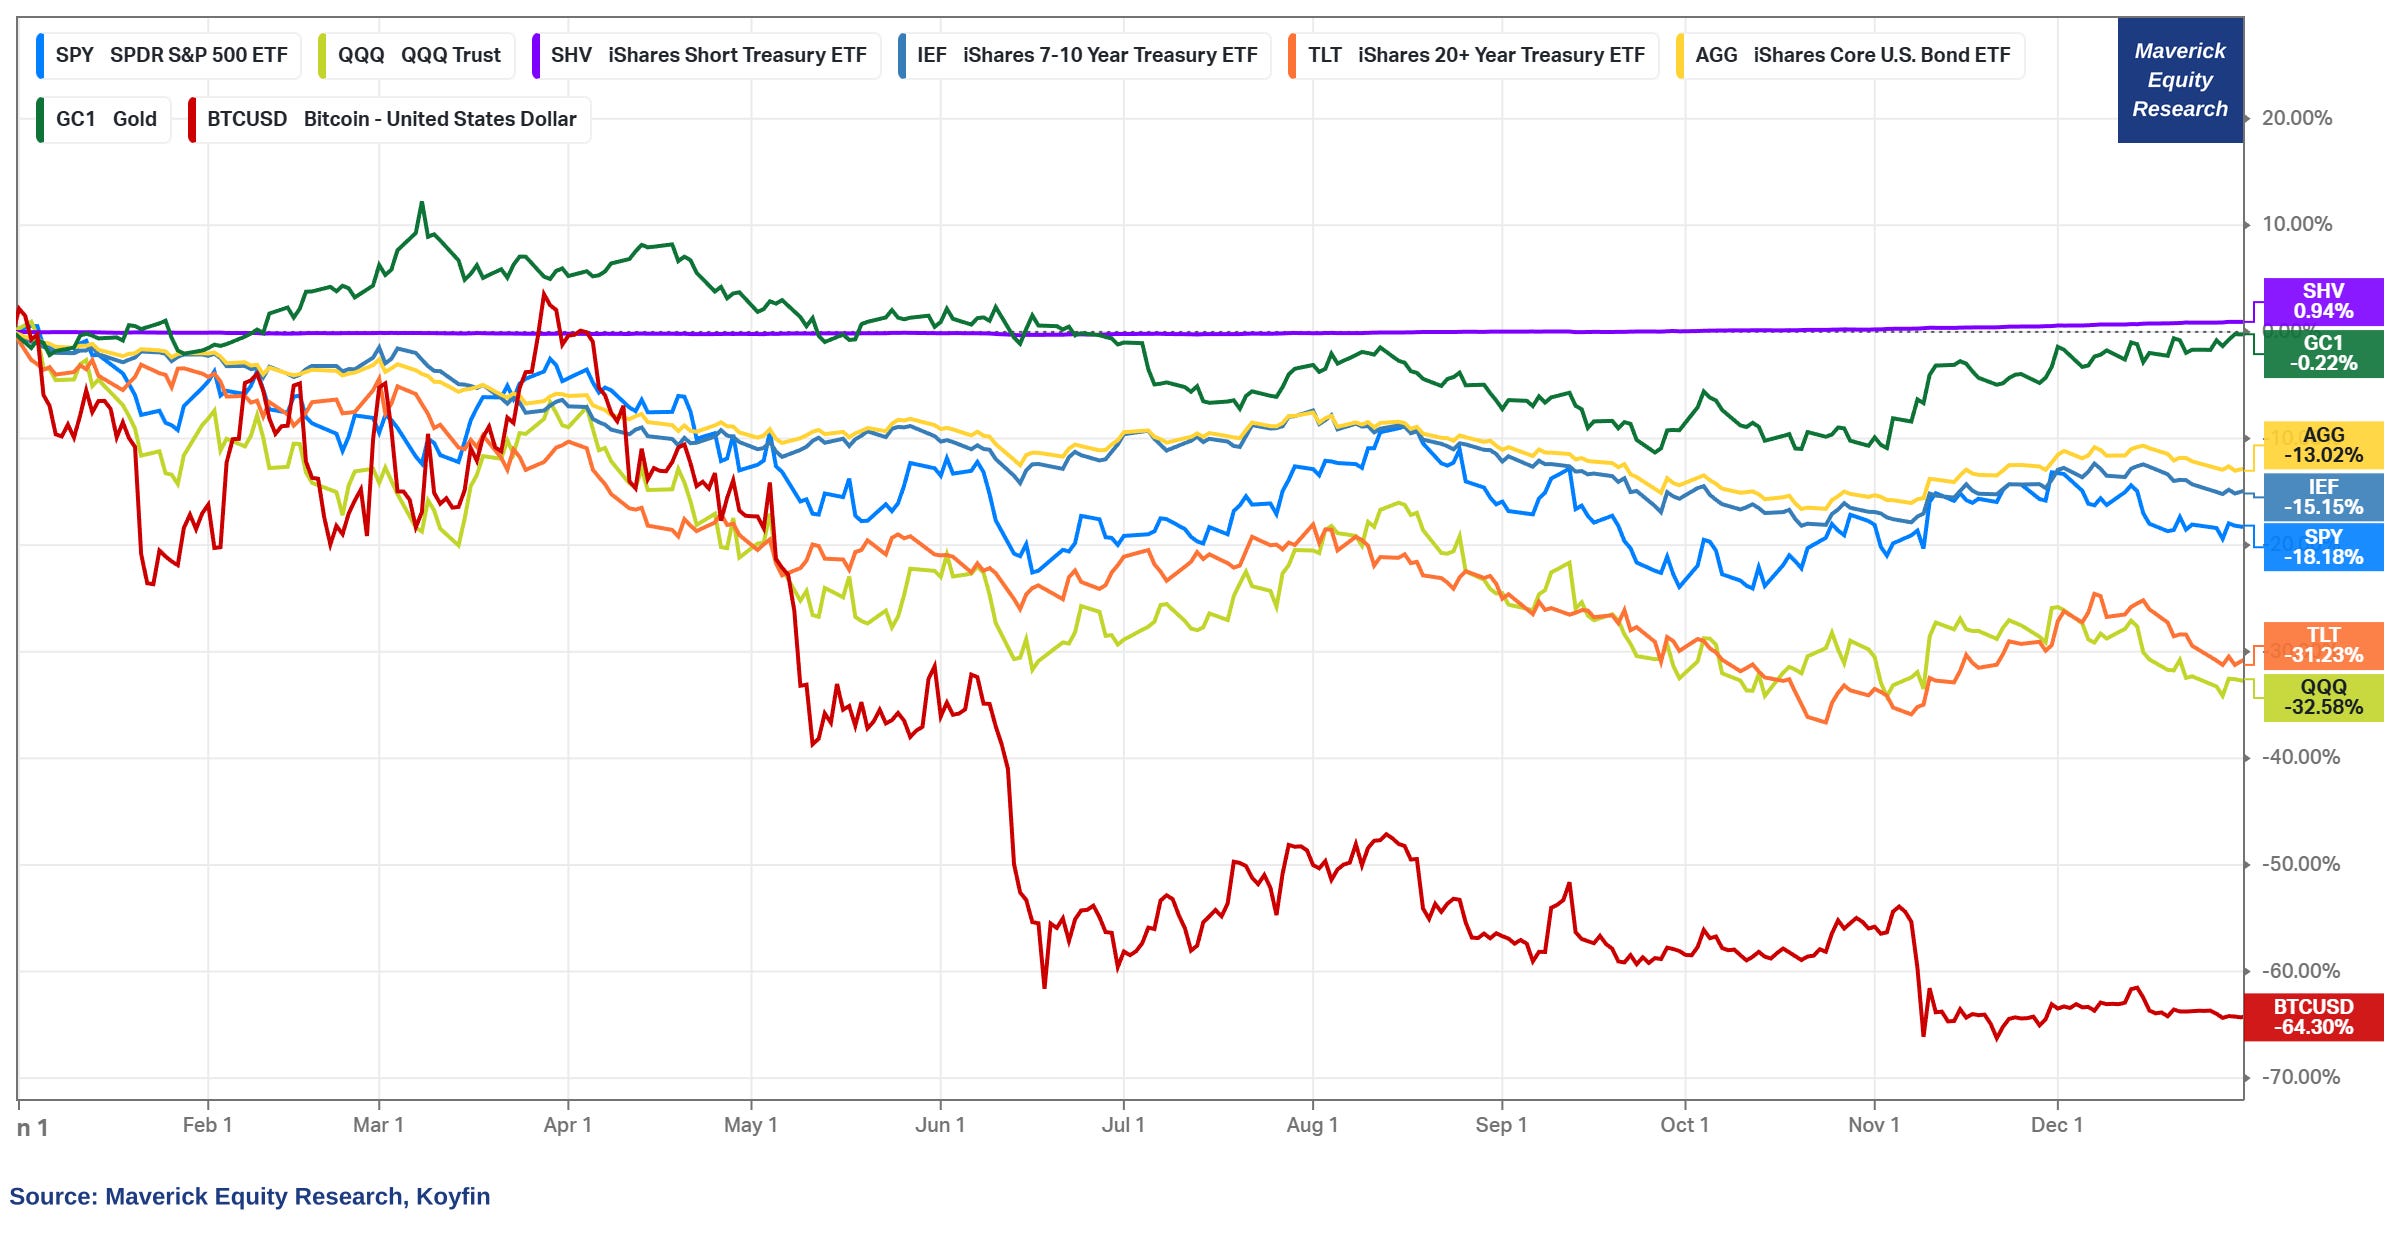
below a casual reminder with the exact same chart, but with the 2022 bear market:
👉 except short-term treasury bills with a slight +0.94%, all were down big time!
3 takeaways and reminders on yearly performances:
👉 from my experience, investors when shown these 2 very different years, they appreciate way way more what they have now in a good year — just human nature!
👉 if there is quite a certainty in investing, one is that occasional bad years will not go away: fear & greed will always be present (human nature), hence clean ups and excesses are to be cleared out which is actually good!
👉 additionally, Volatility = Opportunity, and not Risk: recall Buffet’s 2024 letter where he says that while great businesses are very hard to be bought in their entirety (not a problem for us), small fractions of these gems can be purchased very occasionally, and at bargain prices — and this applies basically to any good business/stock out there!

P.S. in 2026 I will start covering in details this kind of businesses
📊 Equities: S&P 500, Thematic and Individual Names
📊 S&P 500 Performance Ins & Outs
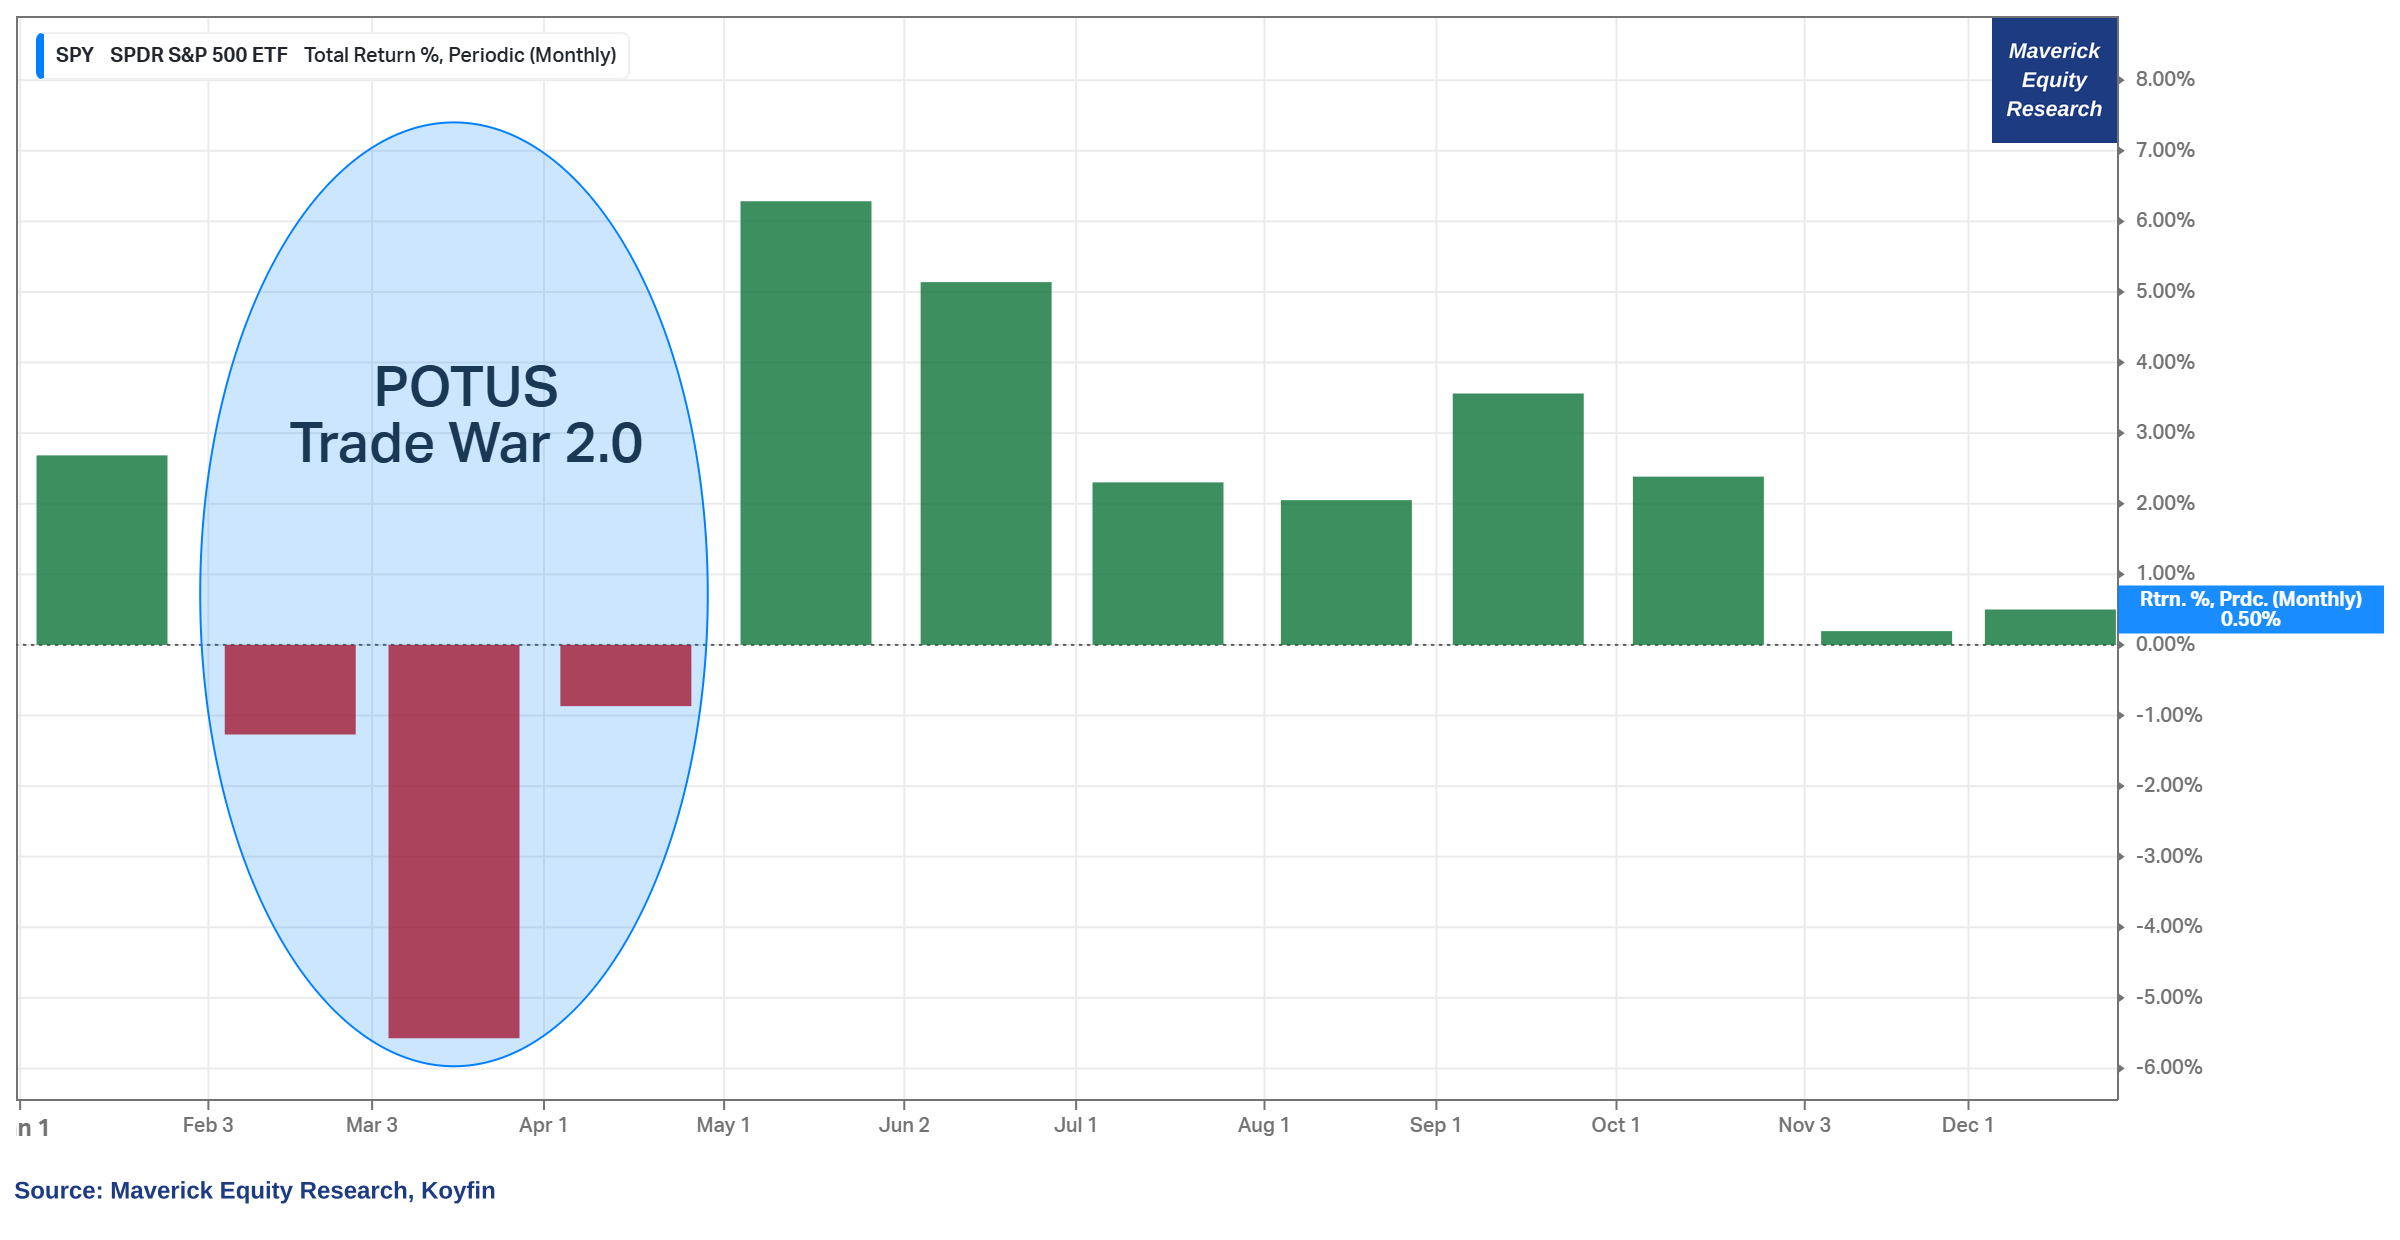
S&P 500 with a great +19.03% — what where the key narratives & factors in 2025?
👉 POTUS Trade War 2.0 = which where basically the 3 negative months of the year followed by a sharp rebound and an overall very very good year — with also a positive December, it will mark 8 straight green months = the longest streak since the mighty 10-month streak which ended in January 2018
👉 the vastly untold story of the stock market rally in 2025 = the falling interest rates = lower discount rates/cost of capital = a key and huge variable!
👉 the AI gold rush is on! AI spending bonanza = tech CAPEX spending as % of the aggregate S&P 500 CAPEX spending at 47% = let that one sink in!
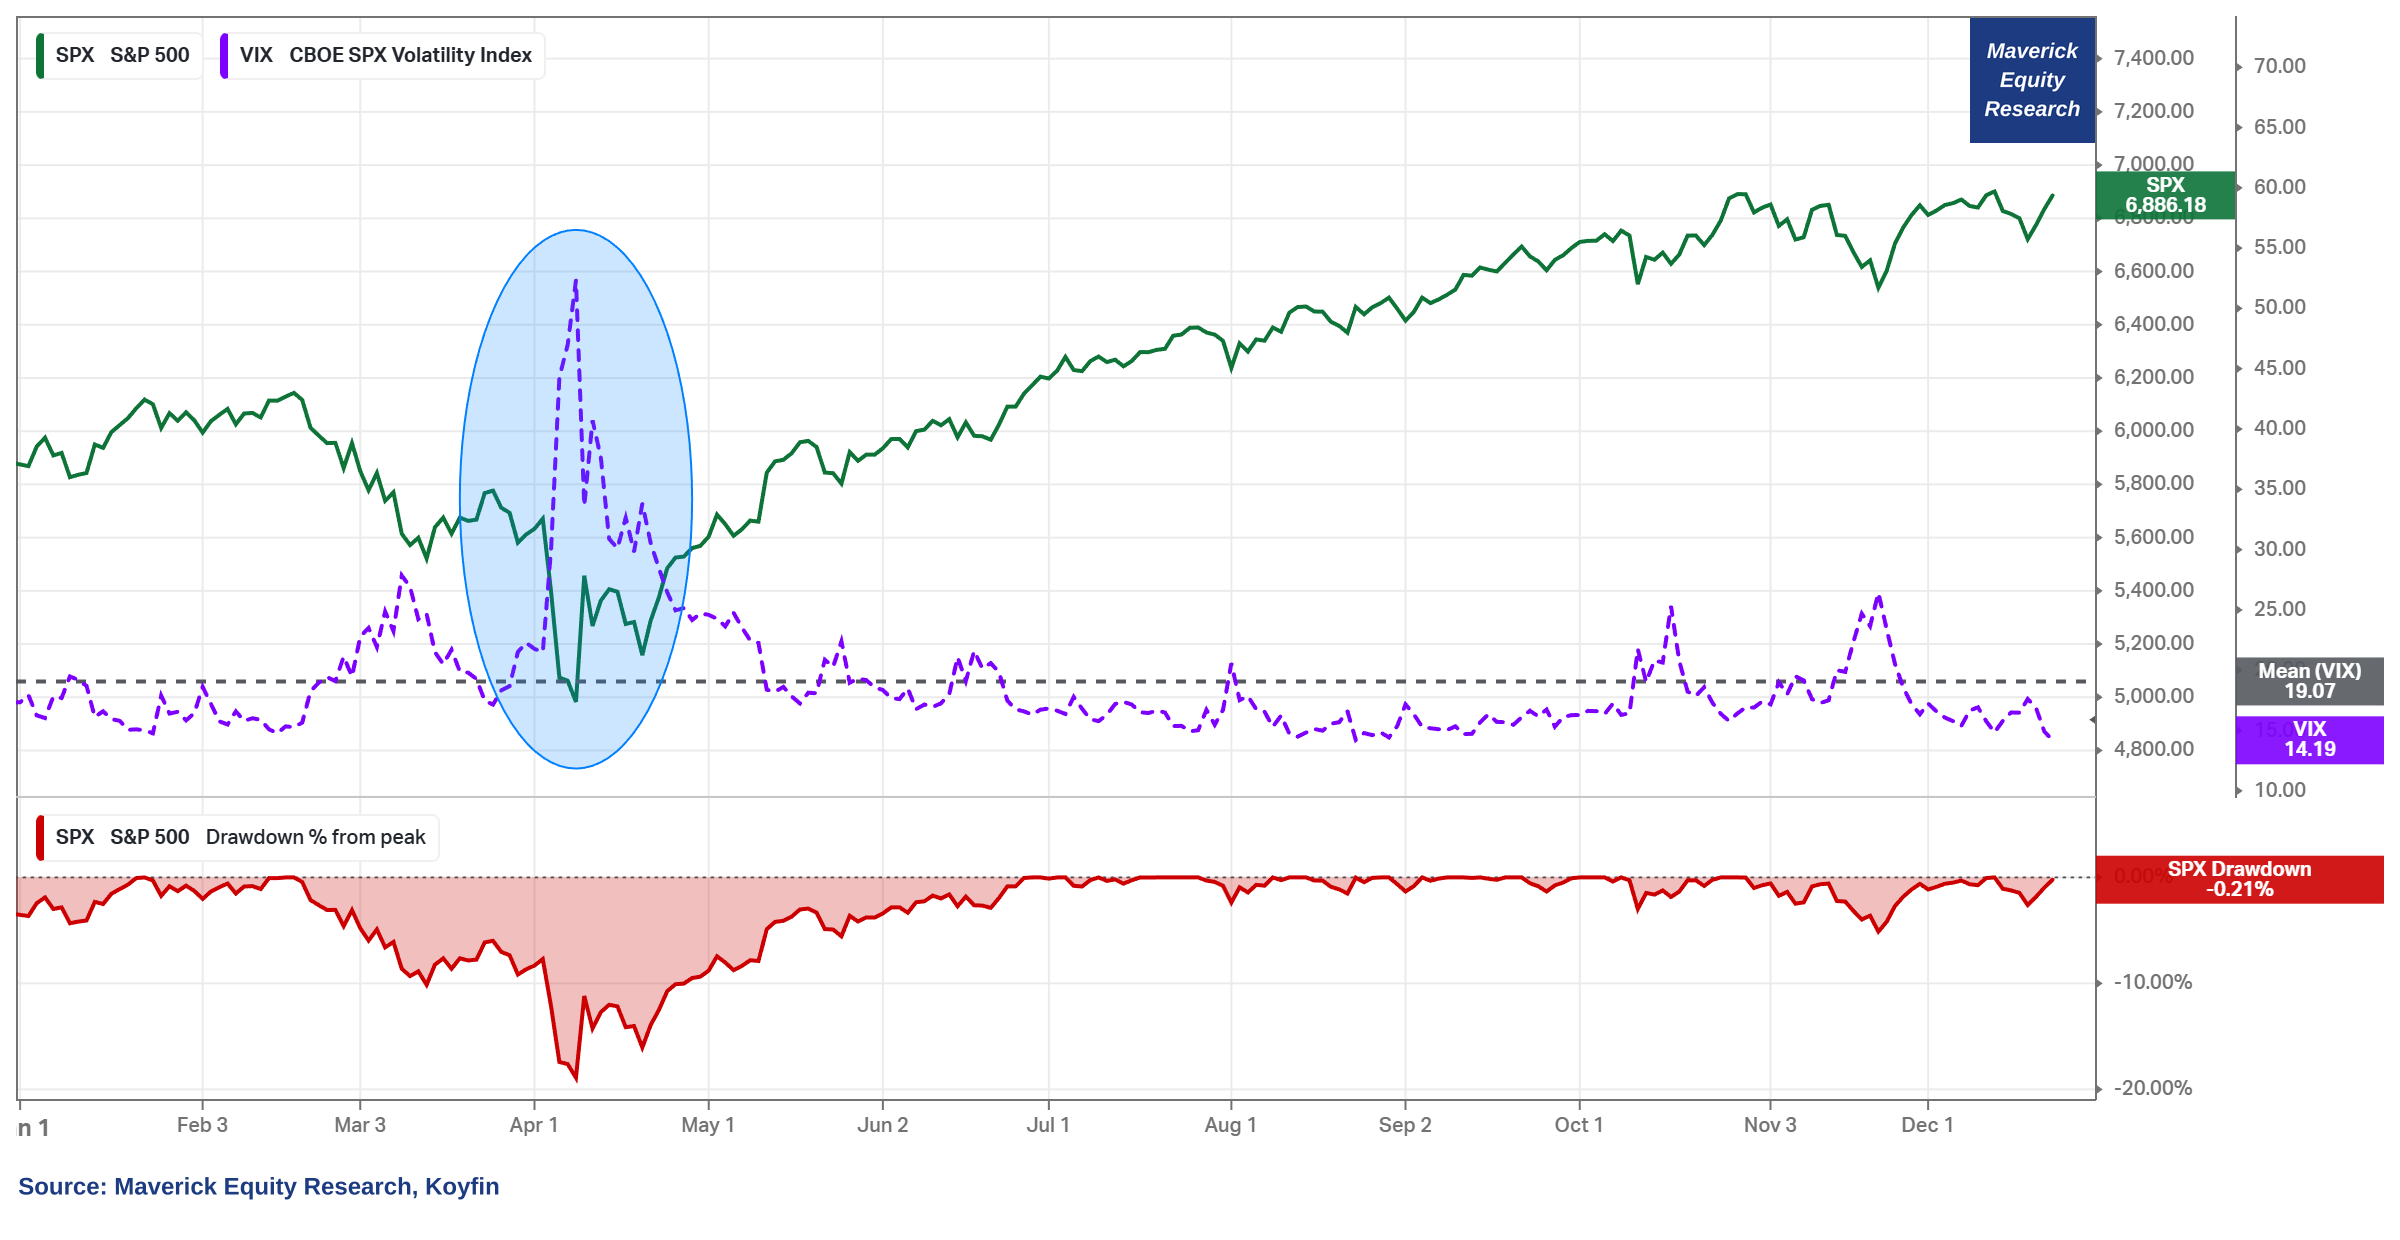
Volatility & Drawdowns — the big moves caused also by the Trade War 2.0:
👉 Volatility: VIX spiked to 52 and now at 14 now is ending the year below the 19 average for the year
👉 Drawdown: with a maximum of 19%, and a price drop of maximum 15%, it was not far from registering a bear market in April
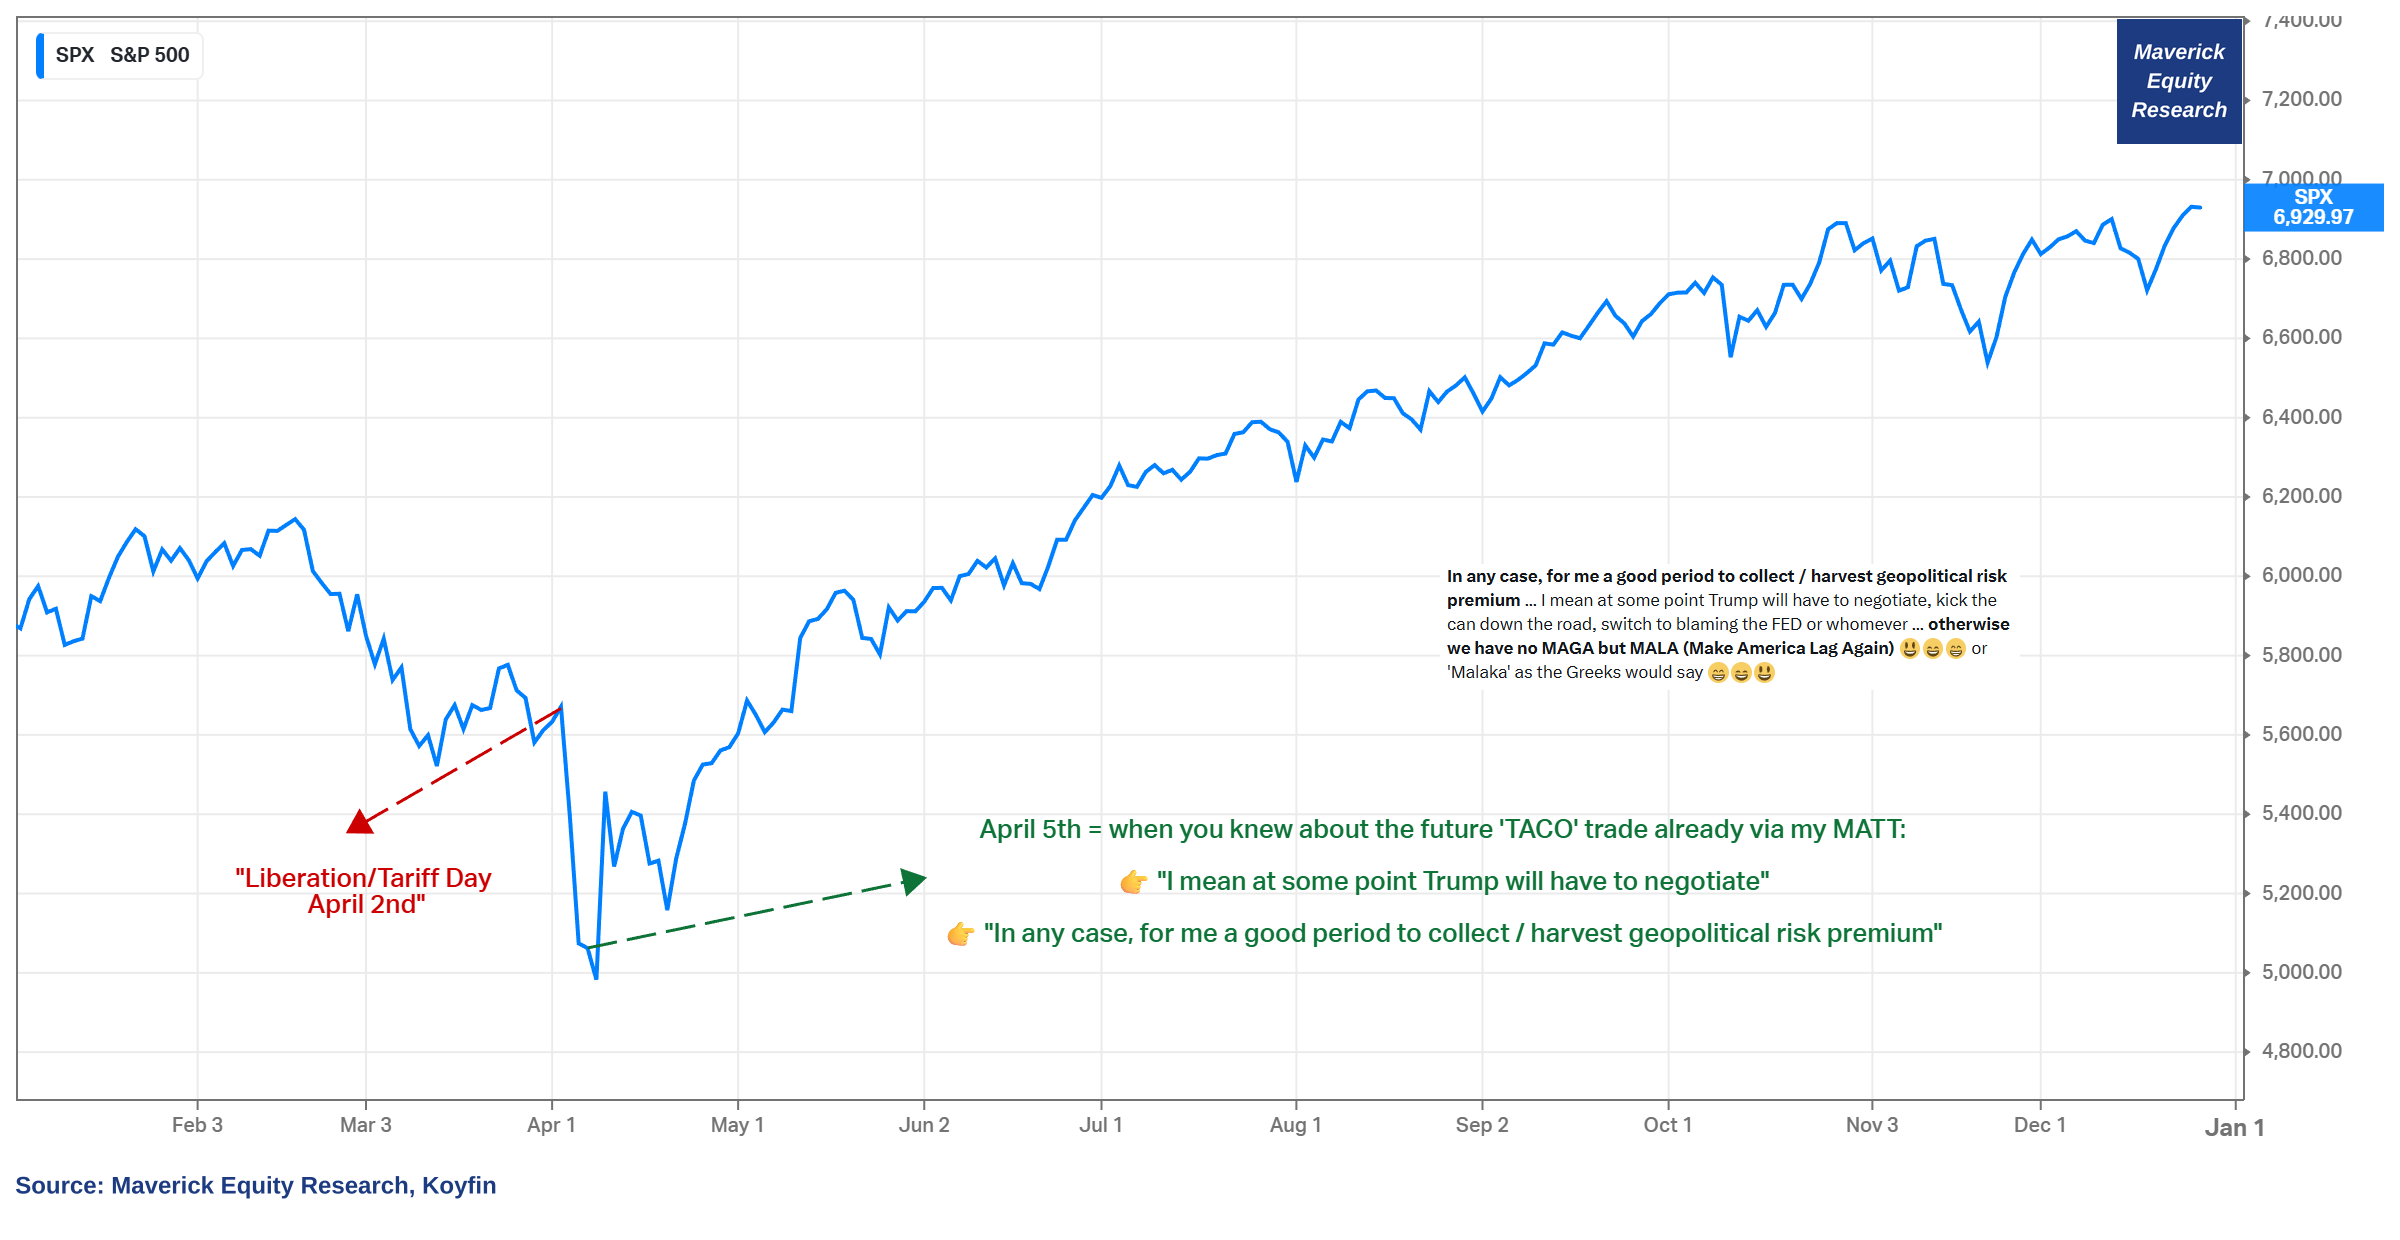
The volatility caused by the Trade War 2.0 created an interesting acronym named "TACO" = “Trump Always Chickens Out!“ which was an investment strategy in response to Trump’s tariff on and off policies — buying as the market dips when Trump announces steep tariffs on the assumption that he will back off/negotiate his tariff stance, hence the market to rebound.
Before the "TACO" trade was even a thing on Wall Street, way earlier I had my original "MATT" = “Maverick Ate The TACO!“ Meaning on the 5th of April (just 3 days after Liberation day from April 2nd) I had my call of the year on the matter:
👉 " I mean at some point Trump will have to negotiate, kick the can down the road, switch to blaming the FED or whomever"
👉 "In any case, for me a good period to collect / harvest geopolitical risk premium"
That was the preview of the playbook which happened right after and you got it: via the typical Maverick-esque fashion, bringing you here key insights via forethought and delivered with clarity, calmness, coolness!
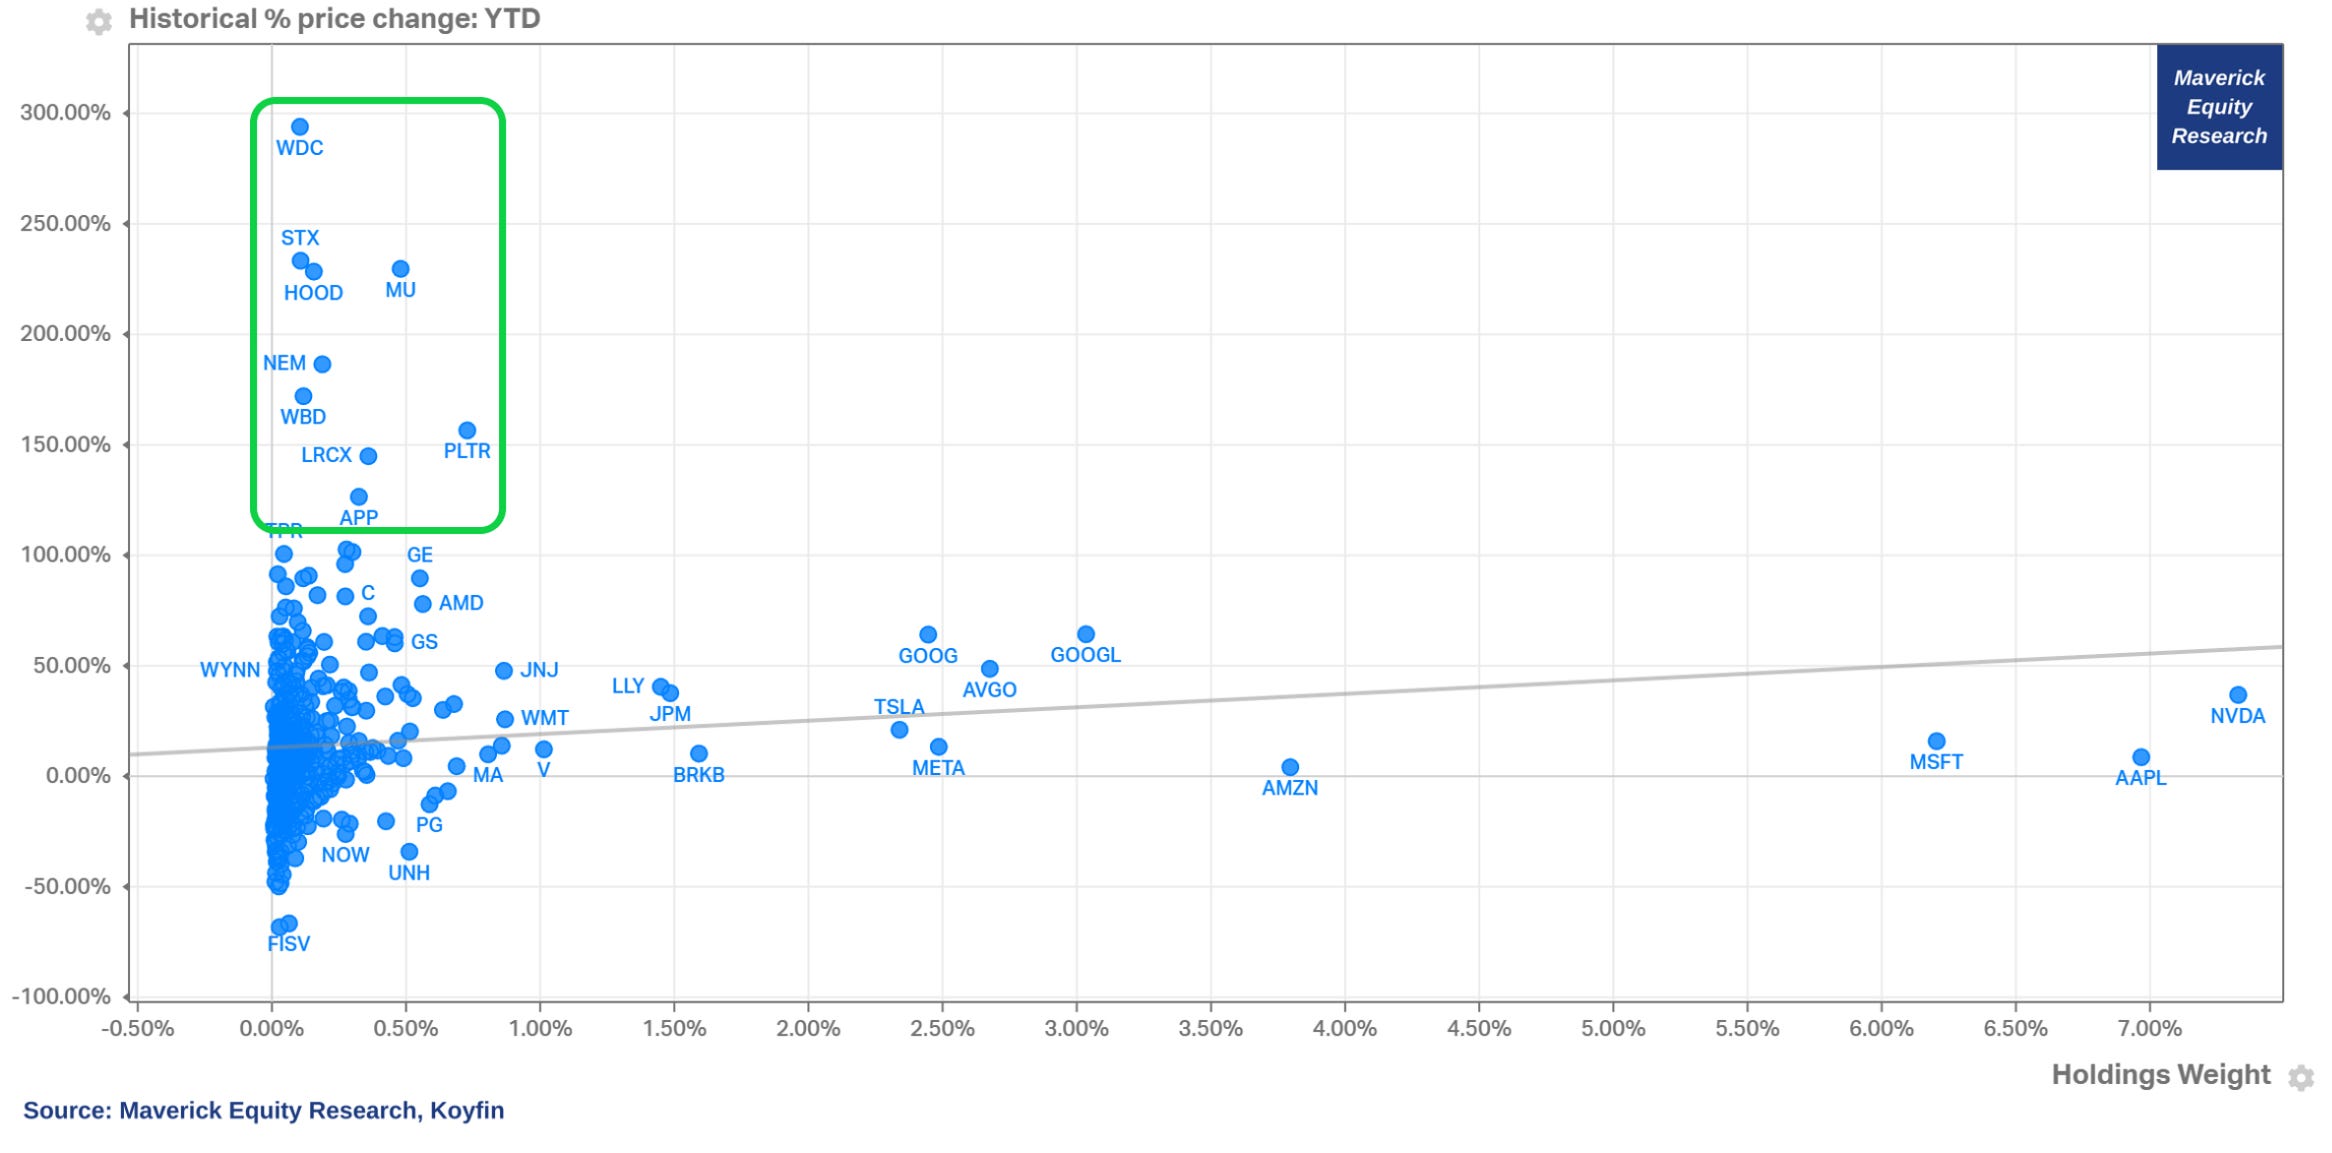
Check this one: when we plot all 500 names by returns and holding weight, we see none of our top 10 performers (green quadrant) bear a major weight in the index!
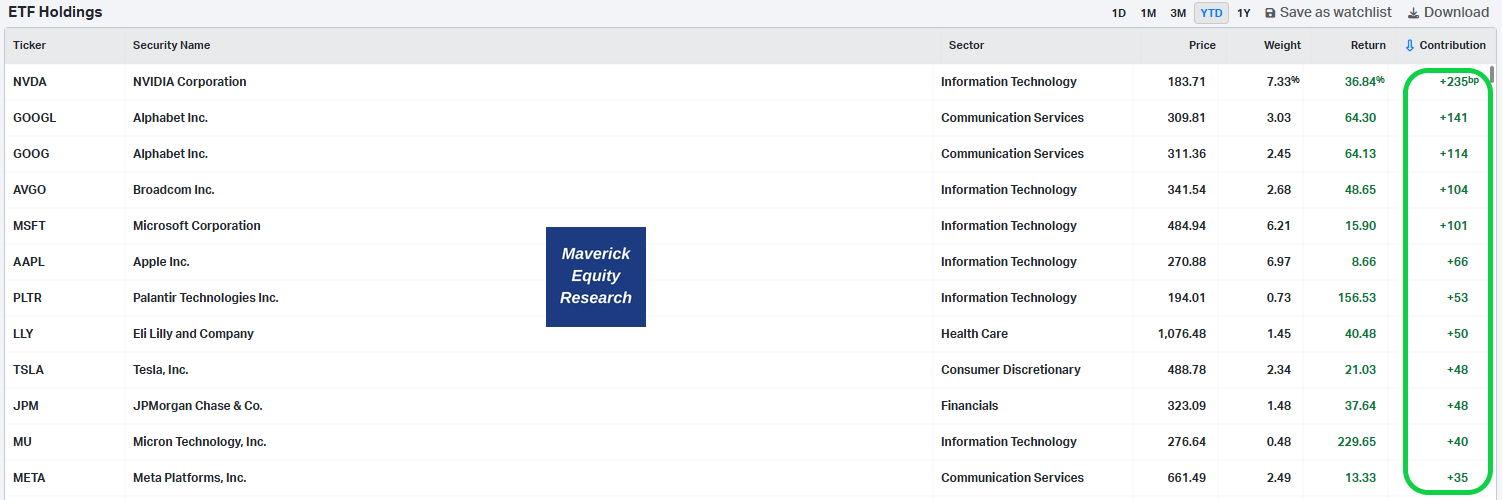
“So, Mav, who is driving the returns in the S&P 500 these days?" Well, for that we need a return attribution analysis to see who brings most of the contribution:
👉 from the +18.23% return in 2025, 10.35% (1,035 b.p. basis points) is driven by the top 12 names below — that translates to more than half, namely 56% of the returns
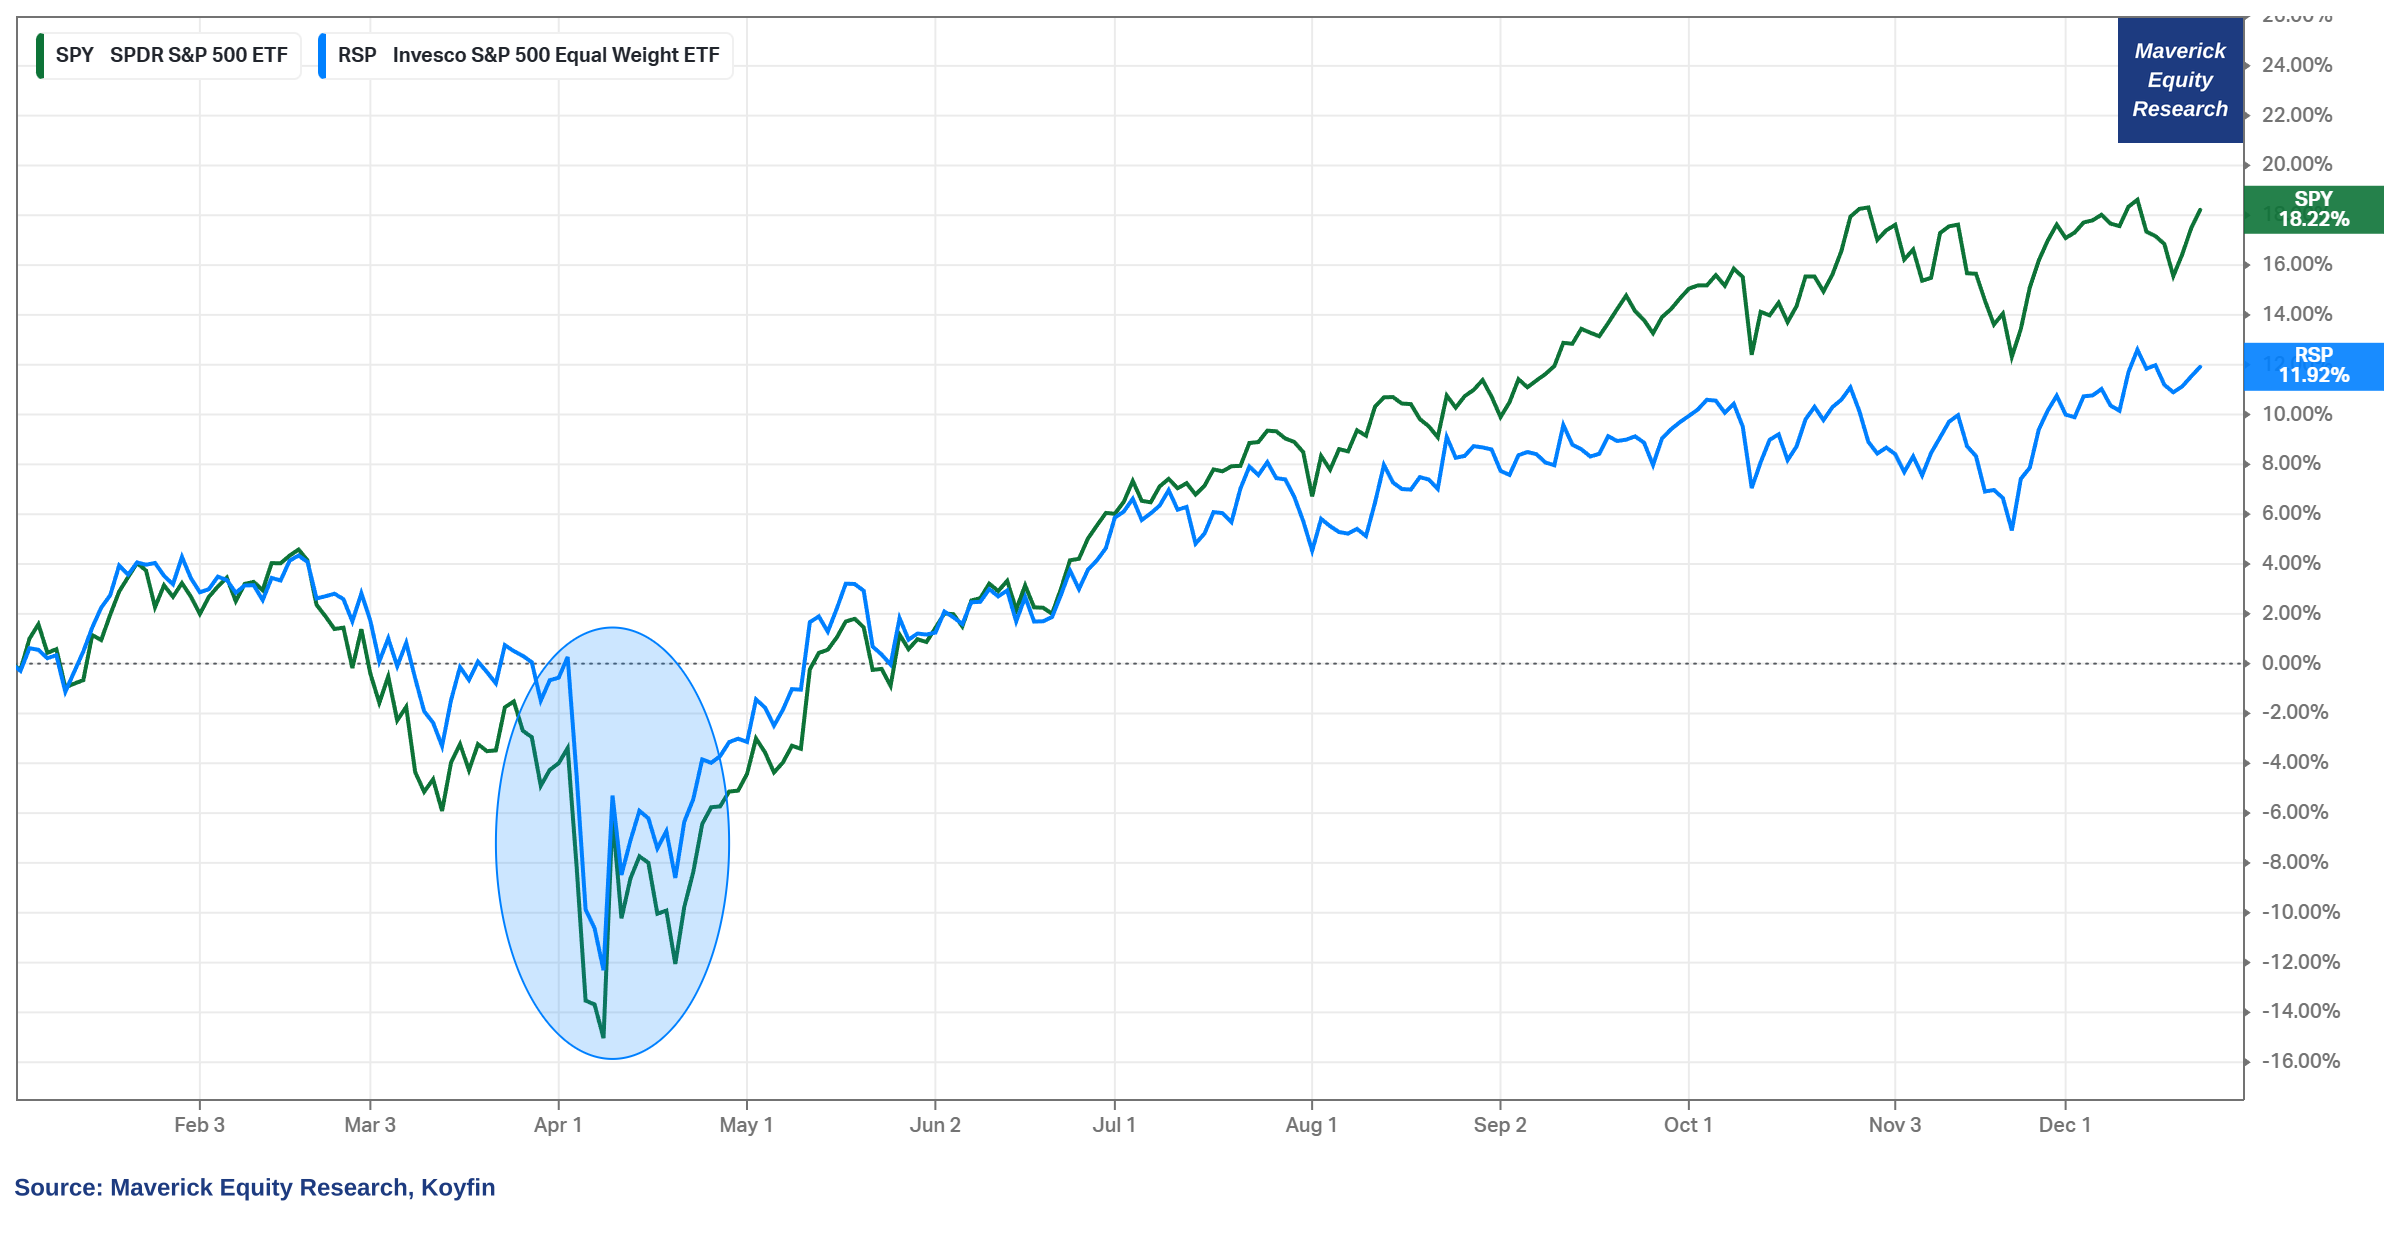
This market concentration is seen nicely also when we compare the performance of the S&P 500 weighted via the SPY ETF with the unweighted RSP ETF:
👉 +18.22% for the SPY (weighted) while note the RSP (unweighted) +11.92%
👉 both great returns no matter how we look at it, though note the concentration which is present, but it is less than 2023 and 2024
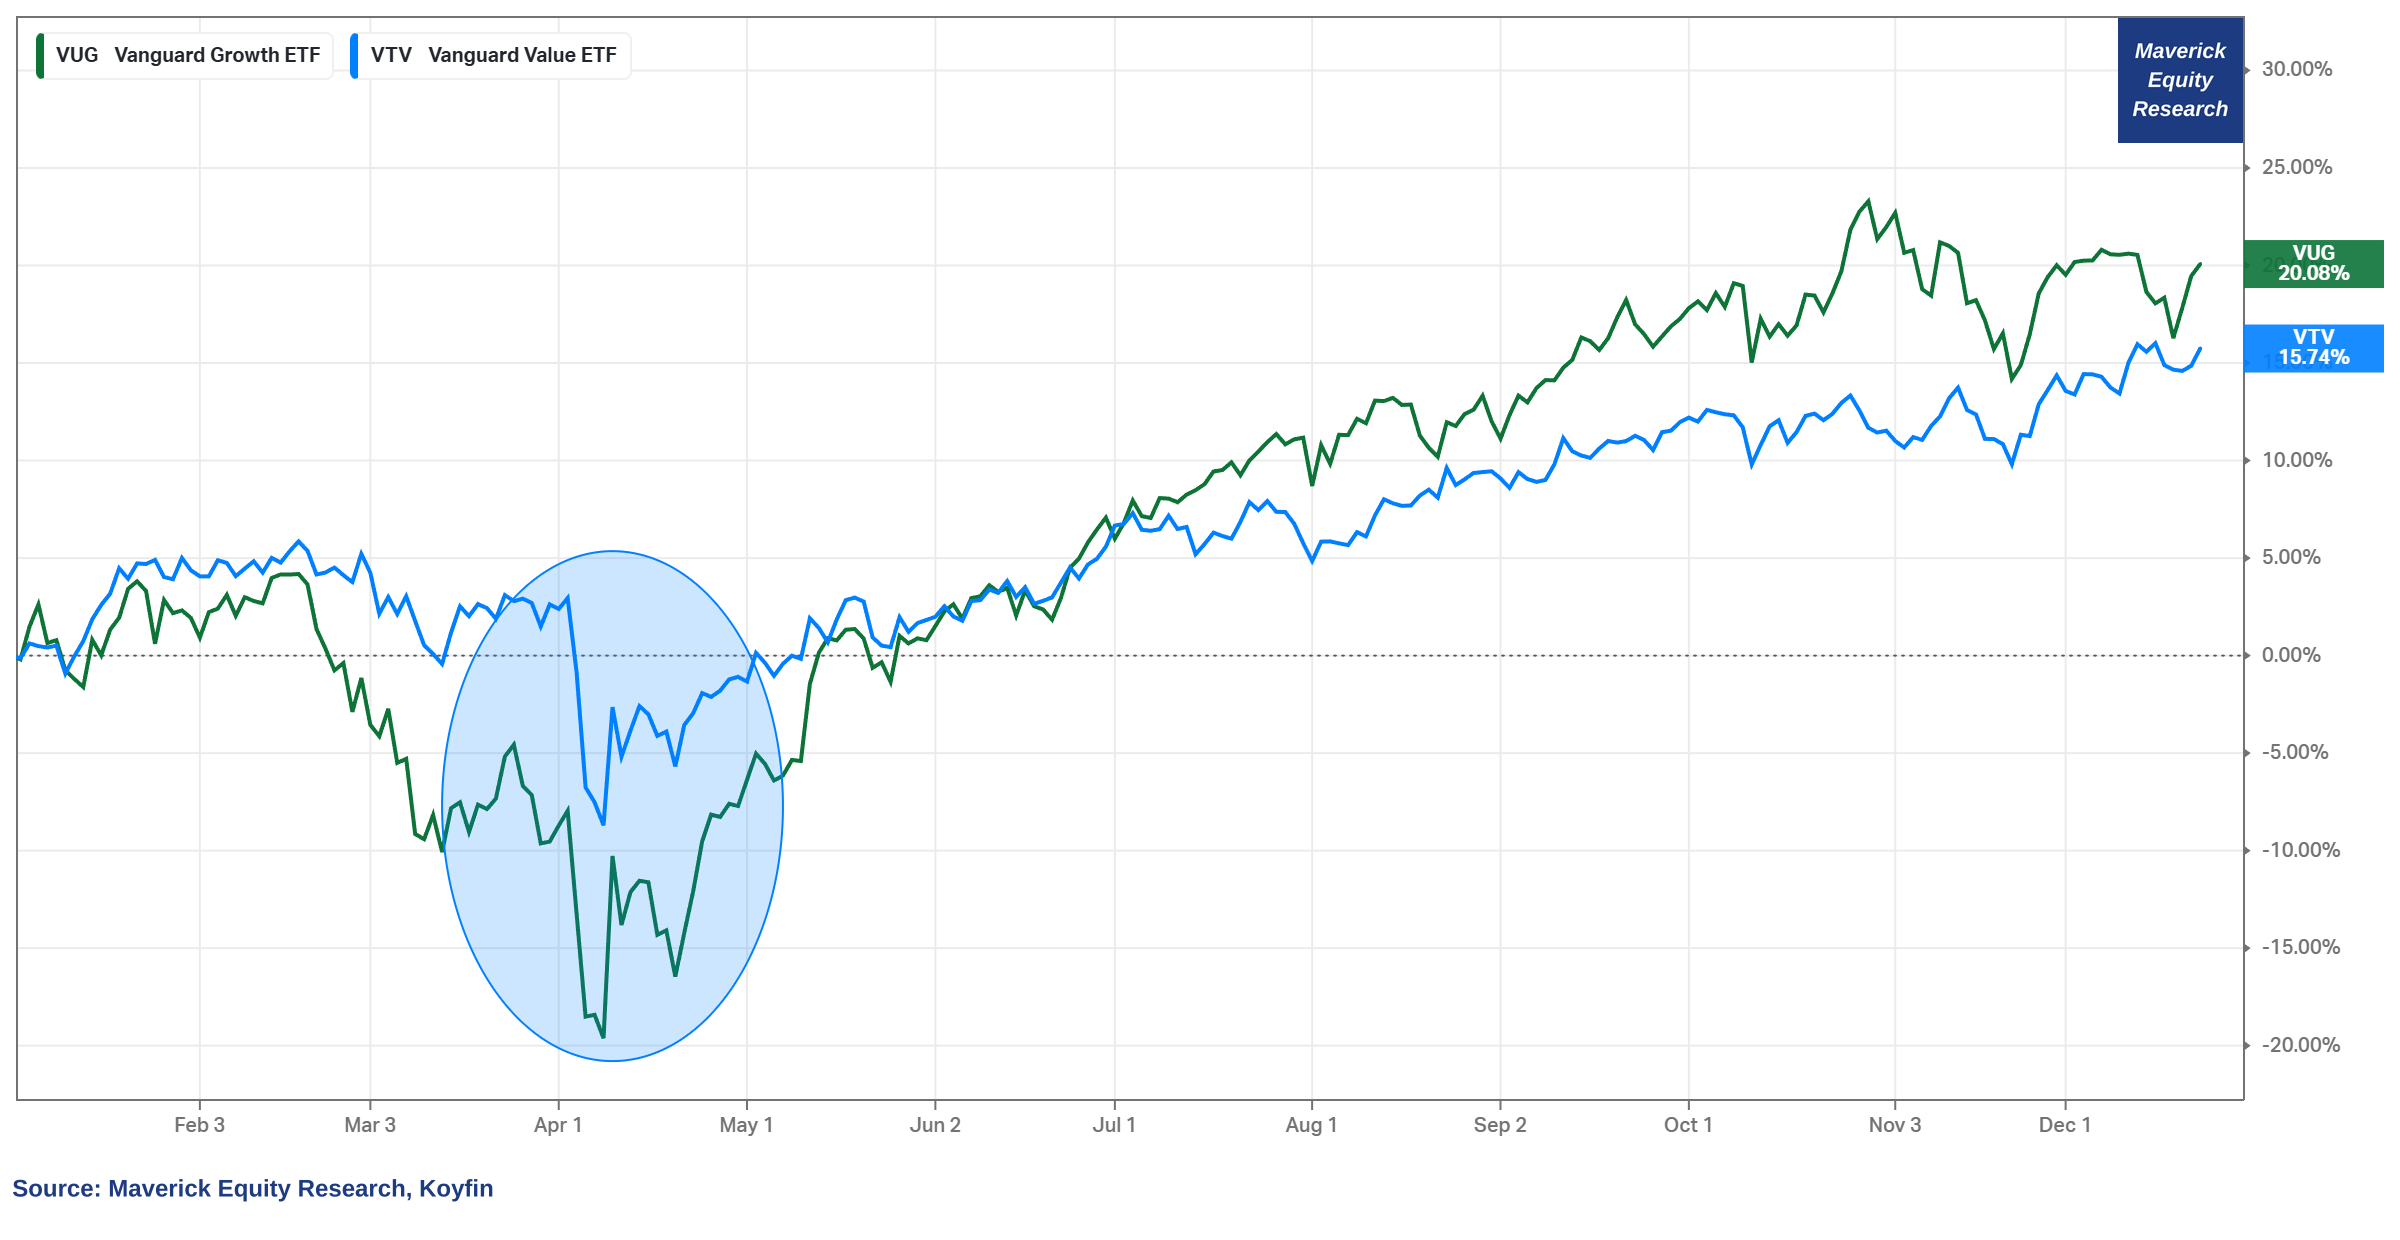
Value & Growth in 2025 for a styles view:
👉 Growth leading like in 2023 and 2024, but value also doing well this time around which translated to a broadening more healthy rally …
👉 VUG Growth (green) +20.08% while VTV Value (value) with +15.74% = both great!
👉 note that VTV Value did drop way less during the April Trade War 2.0 debacle … remember that one for the next volatility, drawdown and/or general downturn …
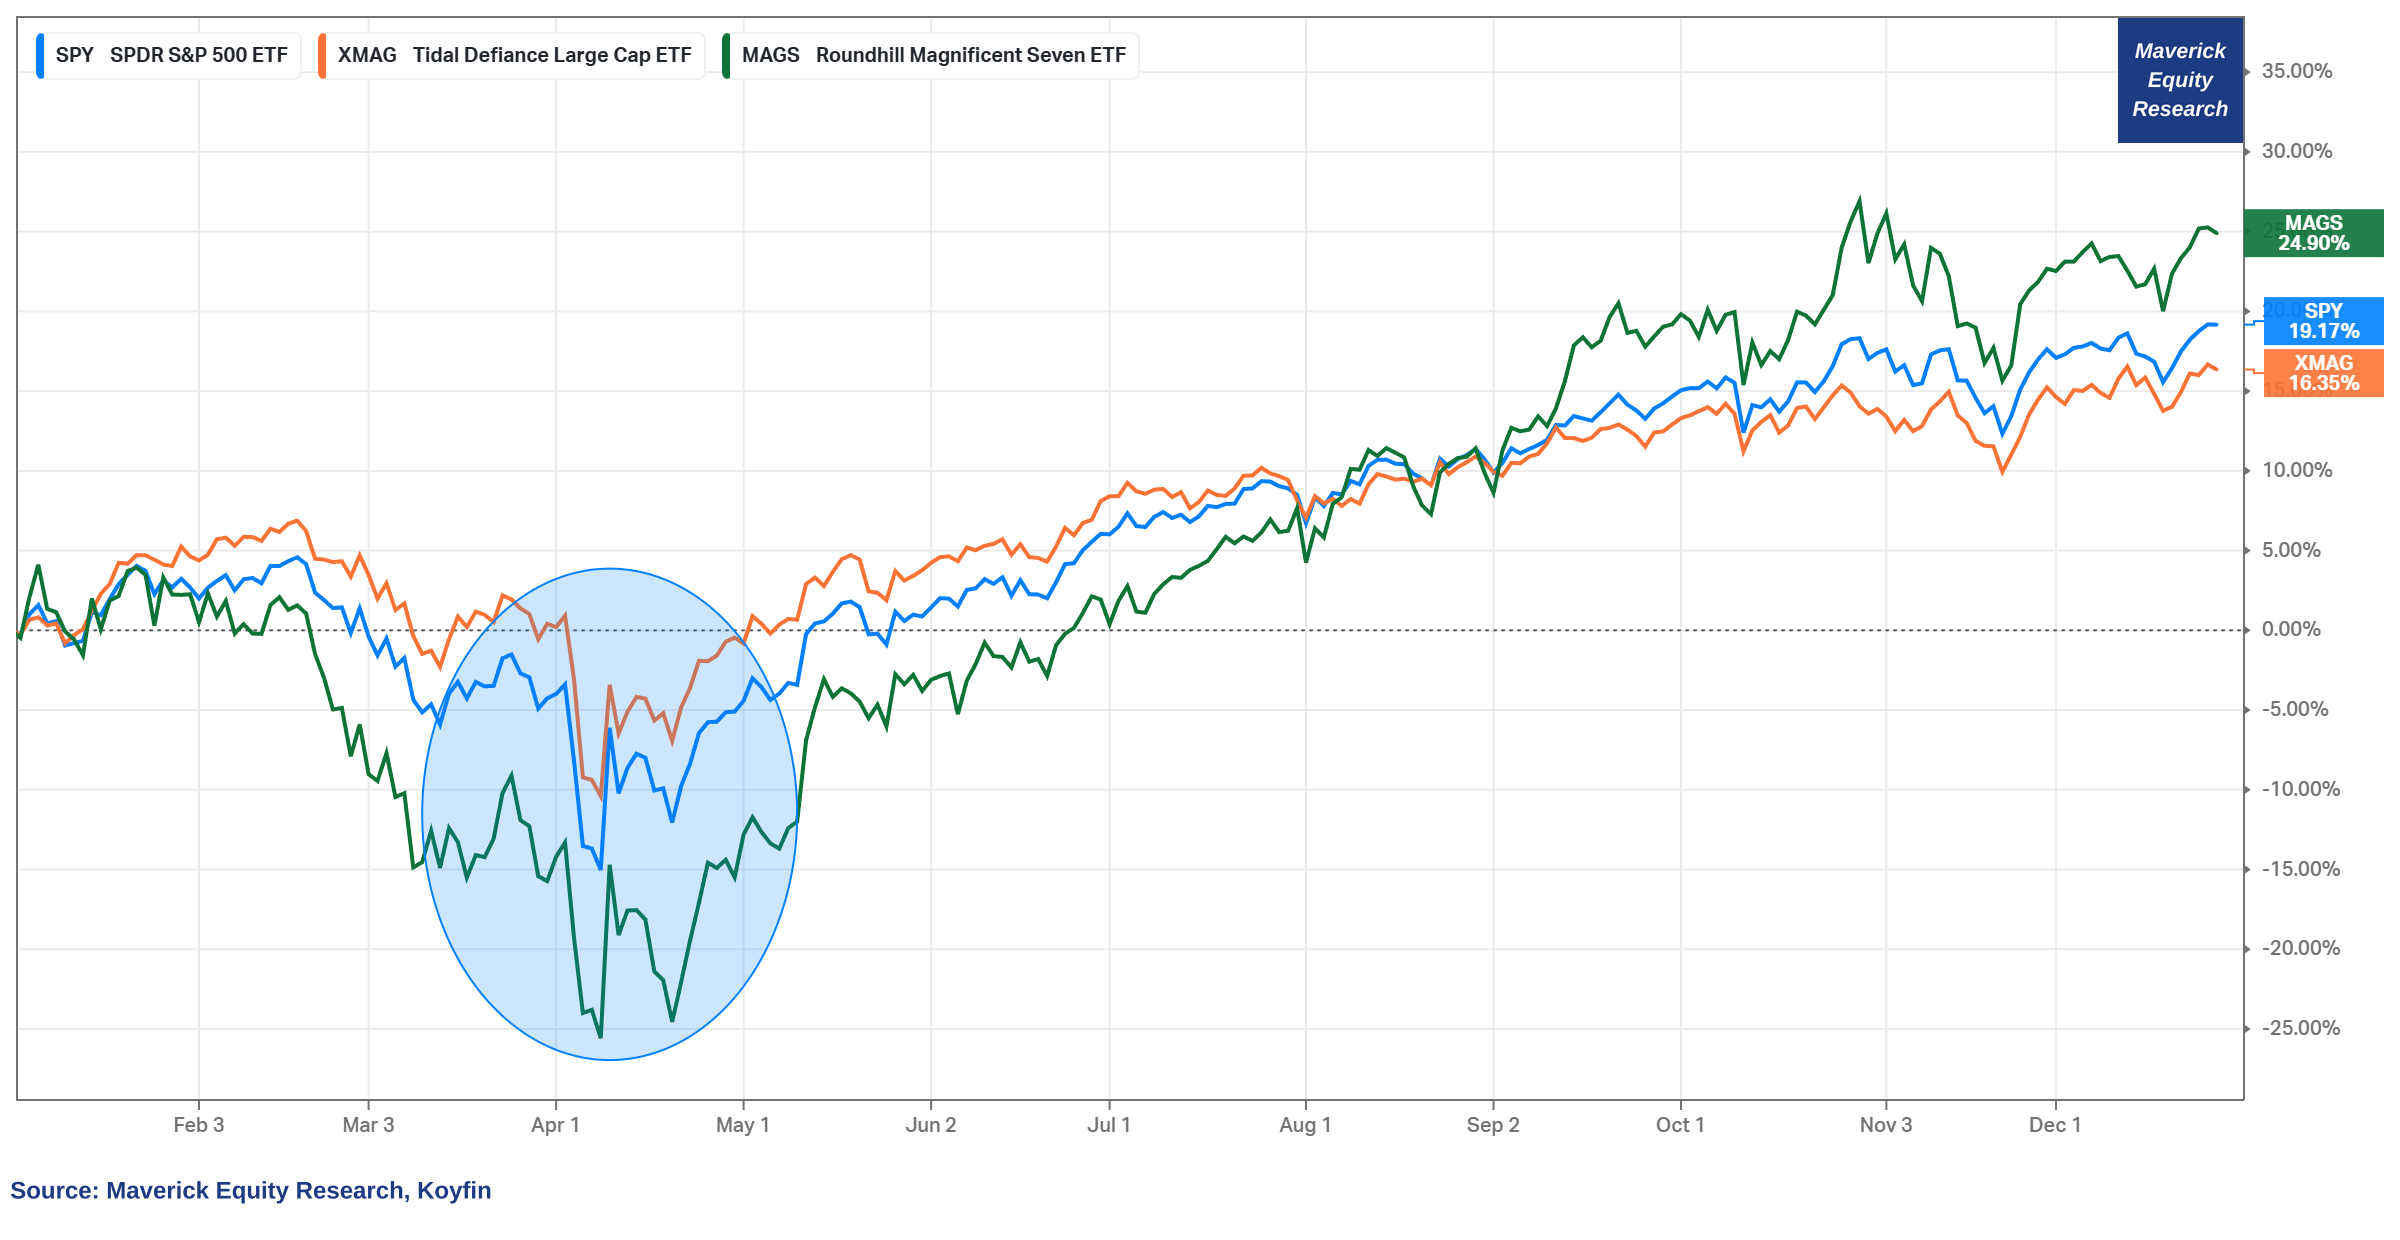
What about the mighty Magnificent 7 stocks?
👉 +24.9% for the Mag 7 stocks (green)
👉 +16.35% for the S&P 493, hence excluding Mag 7 (orange)
👉 +19.17% for the S&P 500 (blue)
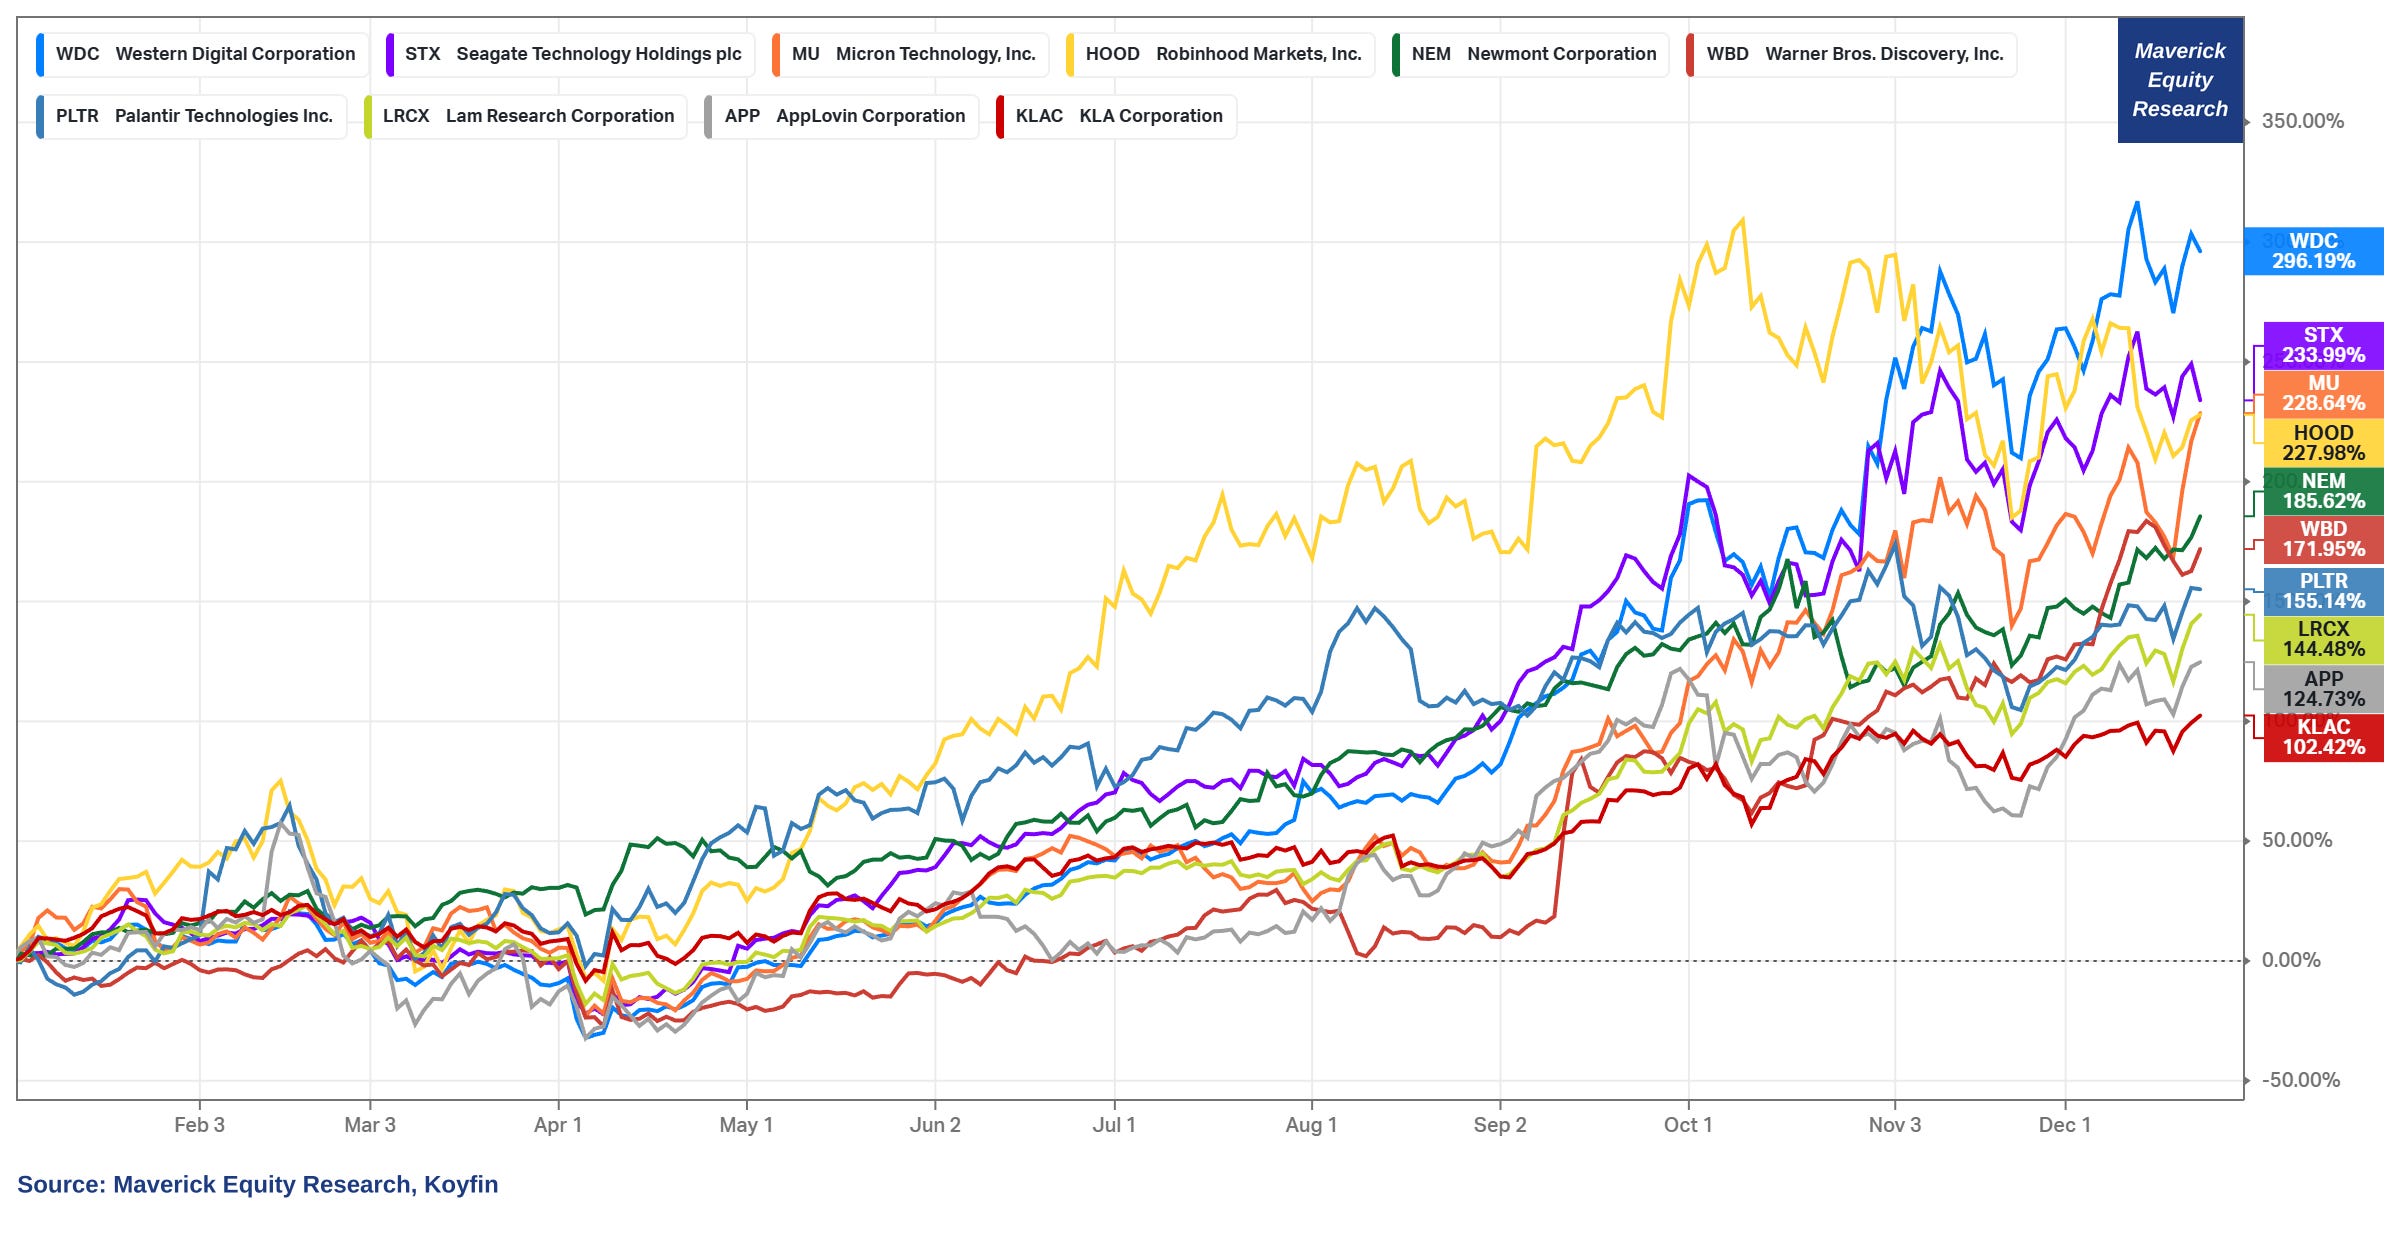
What about the S&P 500 Top 10 Performing Stocks, or like they say in Top Gun: “Up There With The Best Of The Best!”
👉 Western Digital (WDC) +296%, Seagate (STX) +234%, Micron (MU) +229%
👉 Robinhood (HOOD) +228%, Newmont (NEM) +186%, Warner Bros (WBD) +172%
👉 Palantir (PLTR) 155%, Lam Research (LRCX) +144%, AppLovin (APP) +125%, KLA Corporation (KLAC) +102%
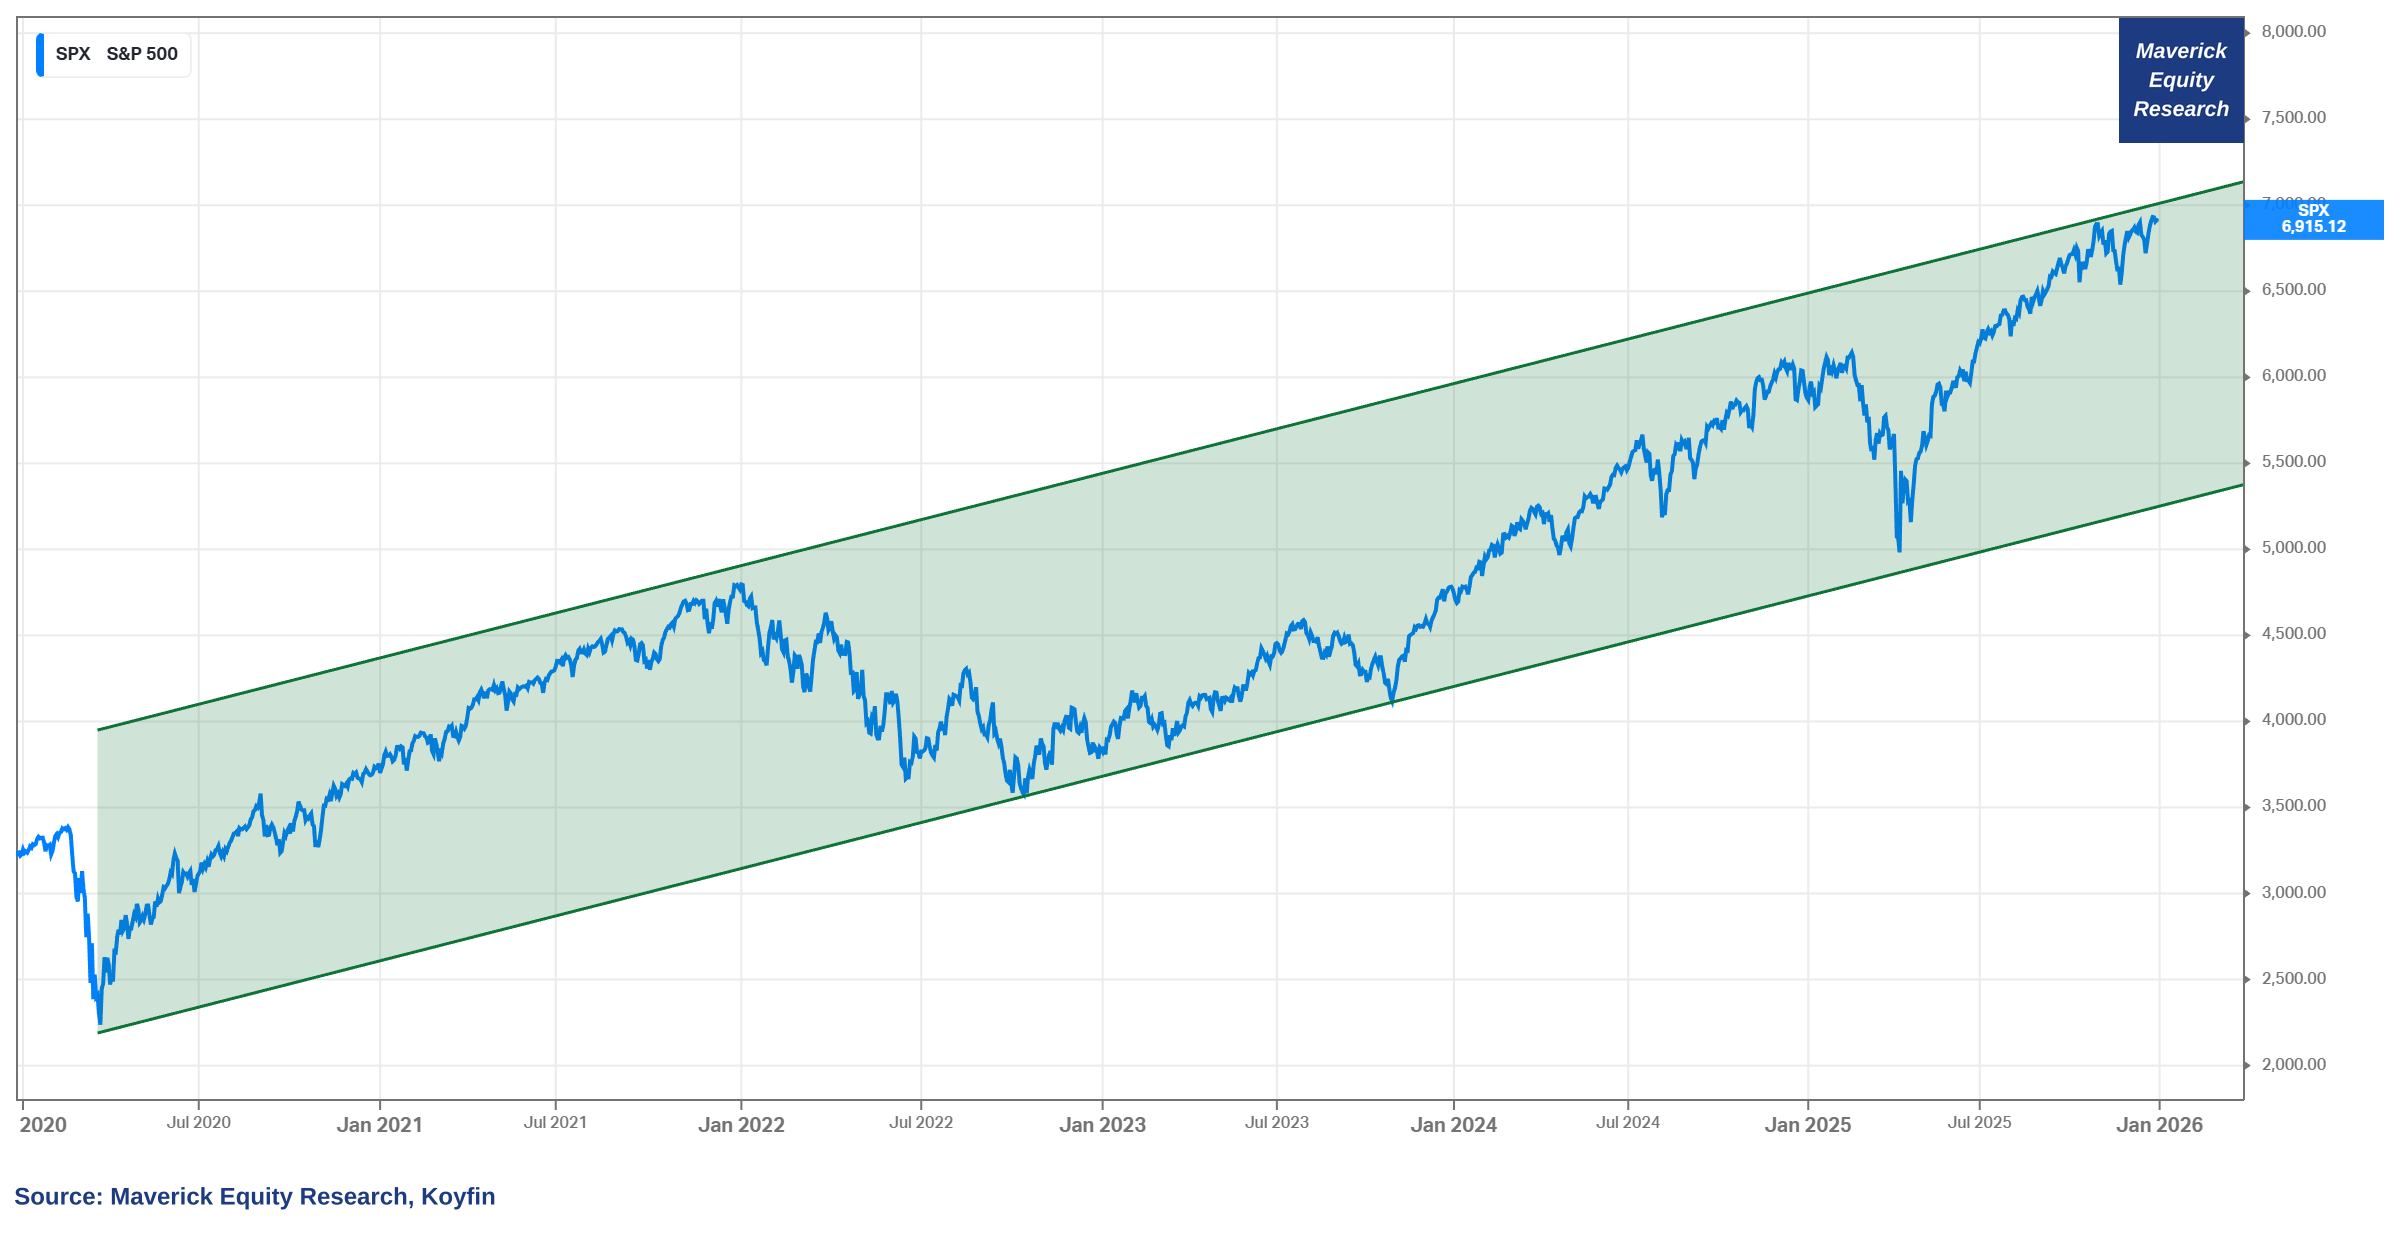
Lastly in terms of performance, zooming out and coupling it with the technicals:
👉 check the S&P 500 bull uptrend in off the COVID low! what a recovery and bounce!
👉 as usual, U.S. equities did in 2025 what they do best: go higher — recall Warren Buffett once famously saying: “Never Bet Against America!” (medium-long term)
👉 on the short term, also because it is America, a lot of things can happen as we saw in Q1 2025 with the POTUS Trade War 2.0 — it could have been worse and longer!
👉 going forward, the question with U.S. equities becomes one of Risk/Reward given where we are now in this sweet trend: at the upper bound!
📊 S&P 500 Valuation
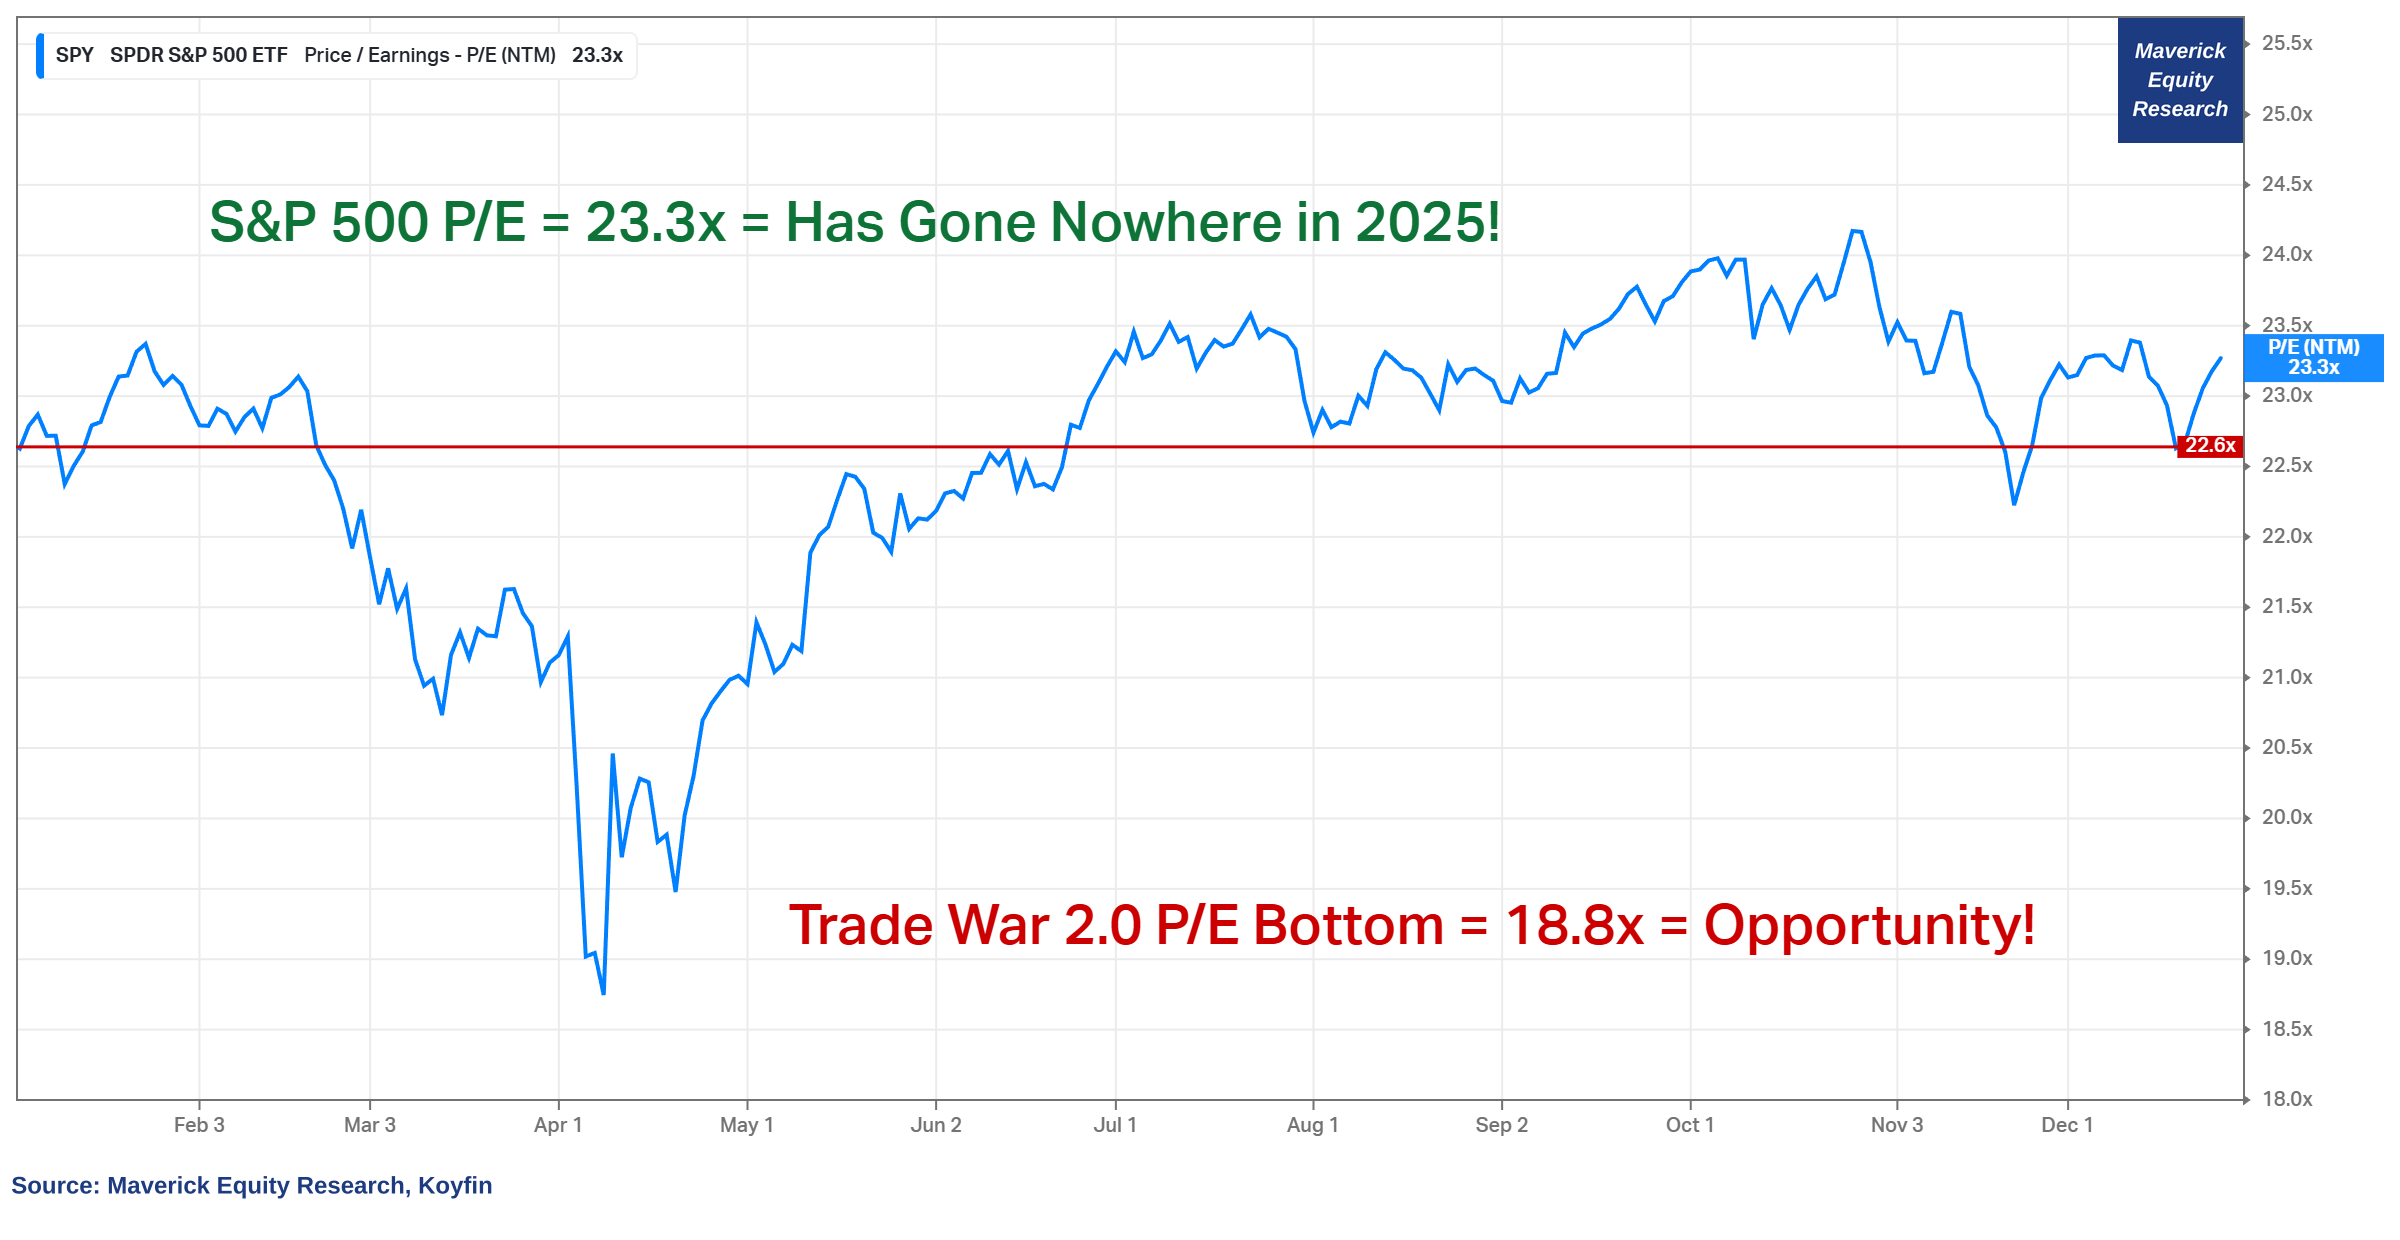
Forward P/E ratio — the evolving path in 2025:
👉 = 23.3x now, and we begun 2025 very similarly at 22.6x — with a 19% return! ‘What happened Mav’? It has gone about nowhere in 2025! ‘Why? What’s going on?’
👉 19% very solid 2025 rally with a major factor being the mighty Earnings growth (the ‘E’ denominator in the P/E ratio), hence not a price/multiple expansion this time around (the ‘P’ numerator in the P/E ratio) = a very good development!
👉 note the April Tariff War 2.0 / Liberation day saw a 18.8x P/E bottom as the market was tanking like there is no tomorrow = yet that was actually an opportunity!
👉 as a rule of thumb, every 4-5x fast drop in the forward P/E (15-20% drop in price) is a good buying opportunity, or just a sentiment and algo driven big fast correction
For way more, I will make 2 Maverick Special reports which shall be ‘evergreen’, and serve via being recalled anytime it is needed in the years and decades ahead:
✍️ Big Volatility & Drawdowns = Juicy Returns
✍️ Harvesting Geopolitical Risk Premium Through the Financial Markets and Economic Storms
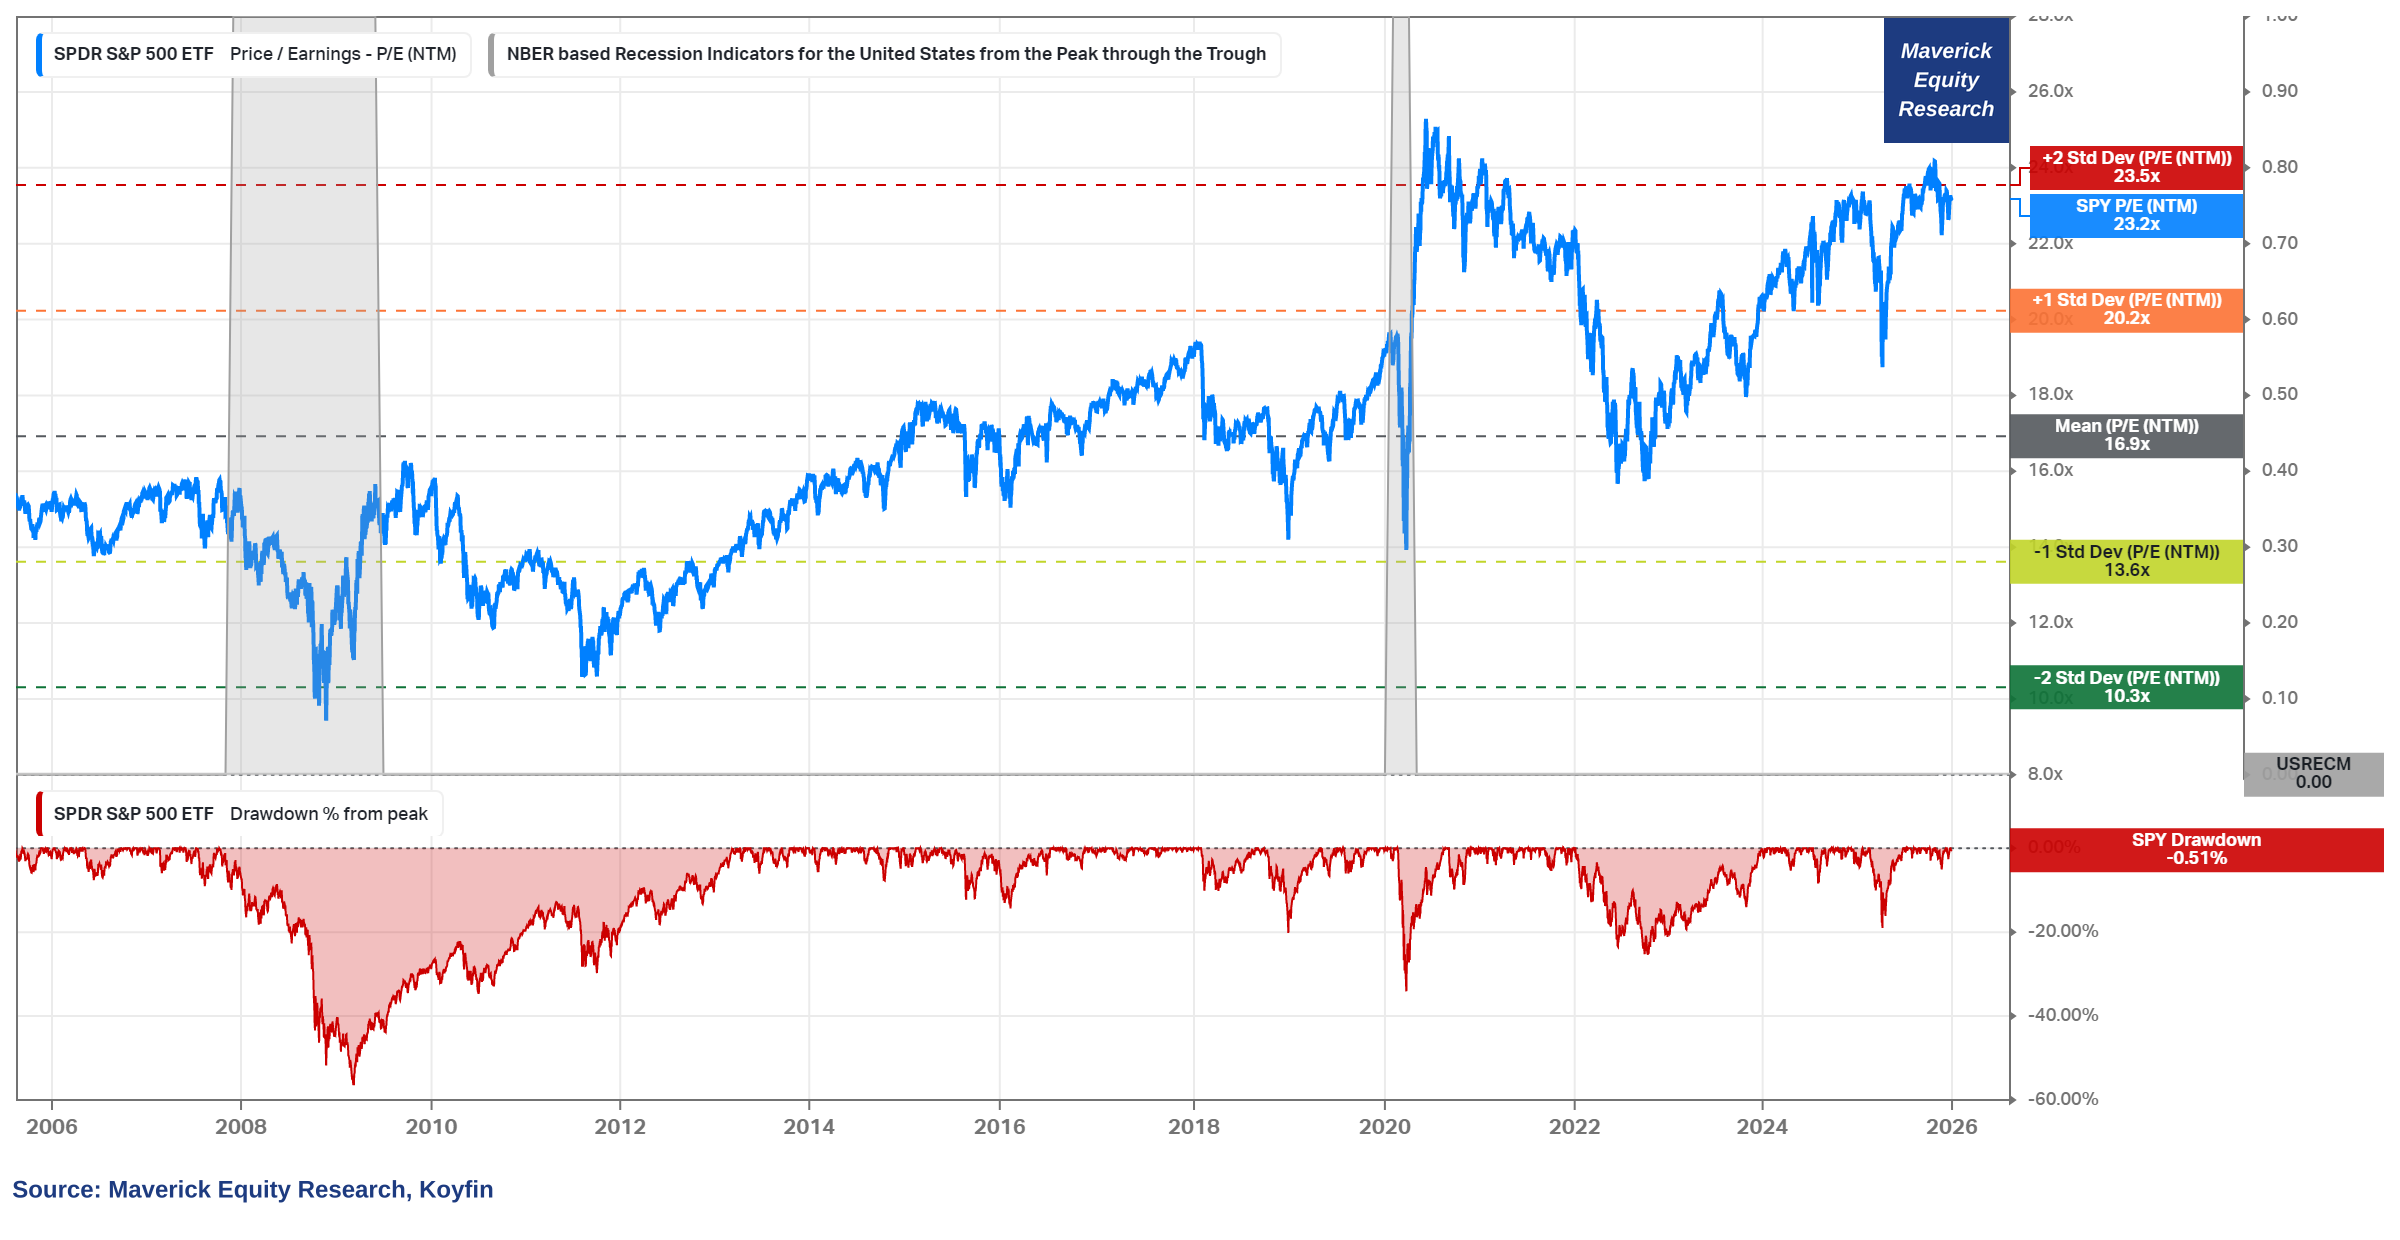
Zooming out via the Forward P/E ratio (last 20 years) — ‘Buy it Low Sell it High’
At a forward P/E of 23.2x now:
👉 = sitting very close to the +2 SD (Standard Deviations) of 23.5x
👉 = 37% higher than the 20 year average of 16.9x
👉 = not far from the 2021 stock market mania levels of 25x
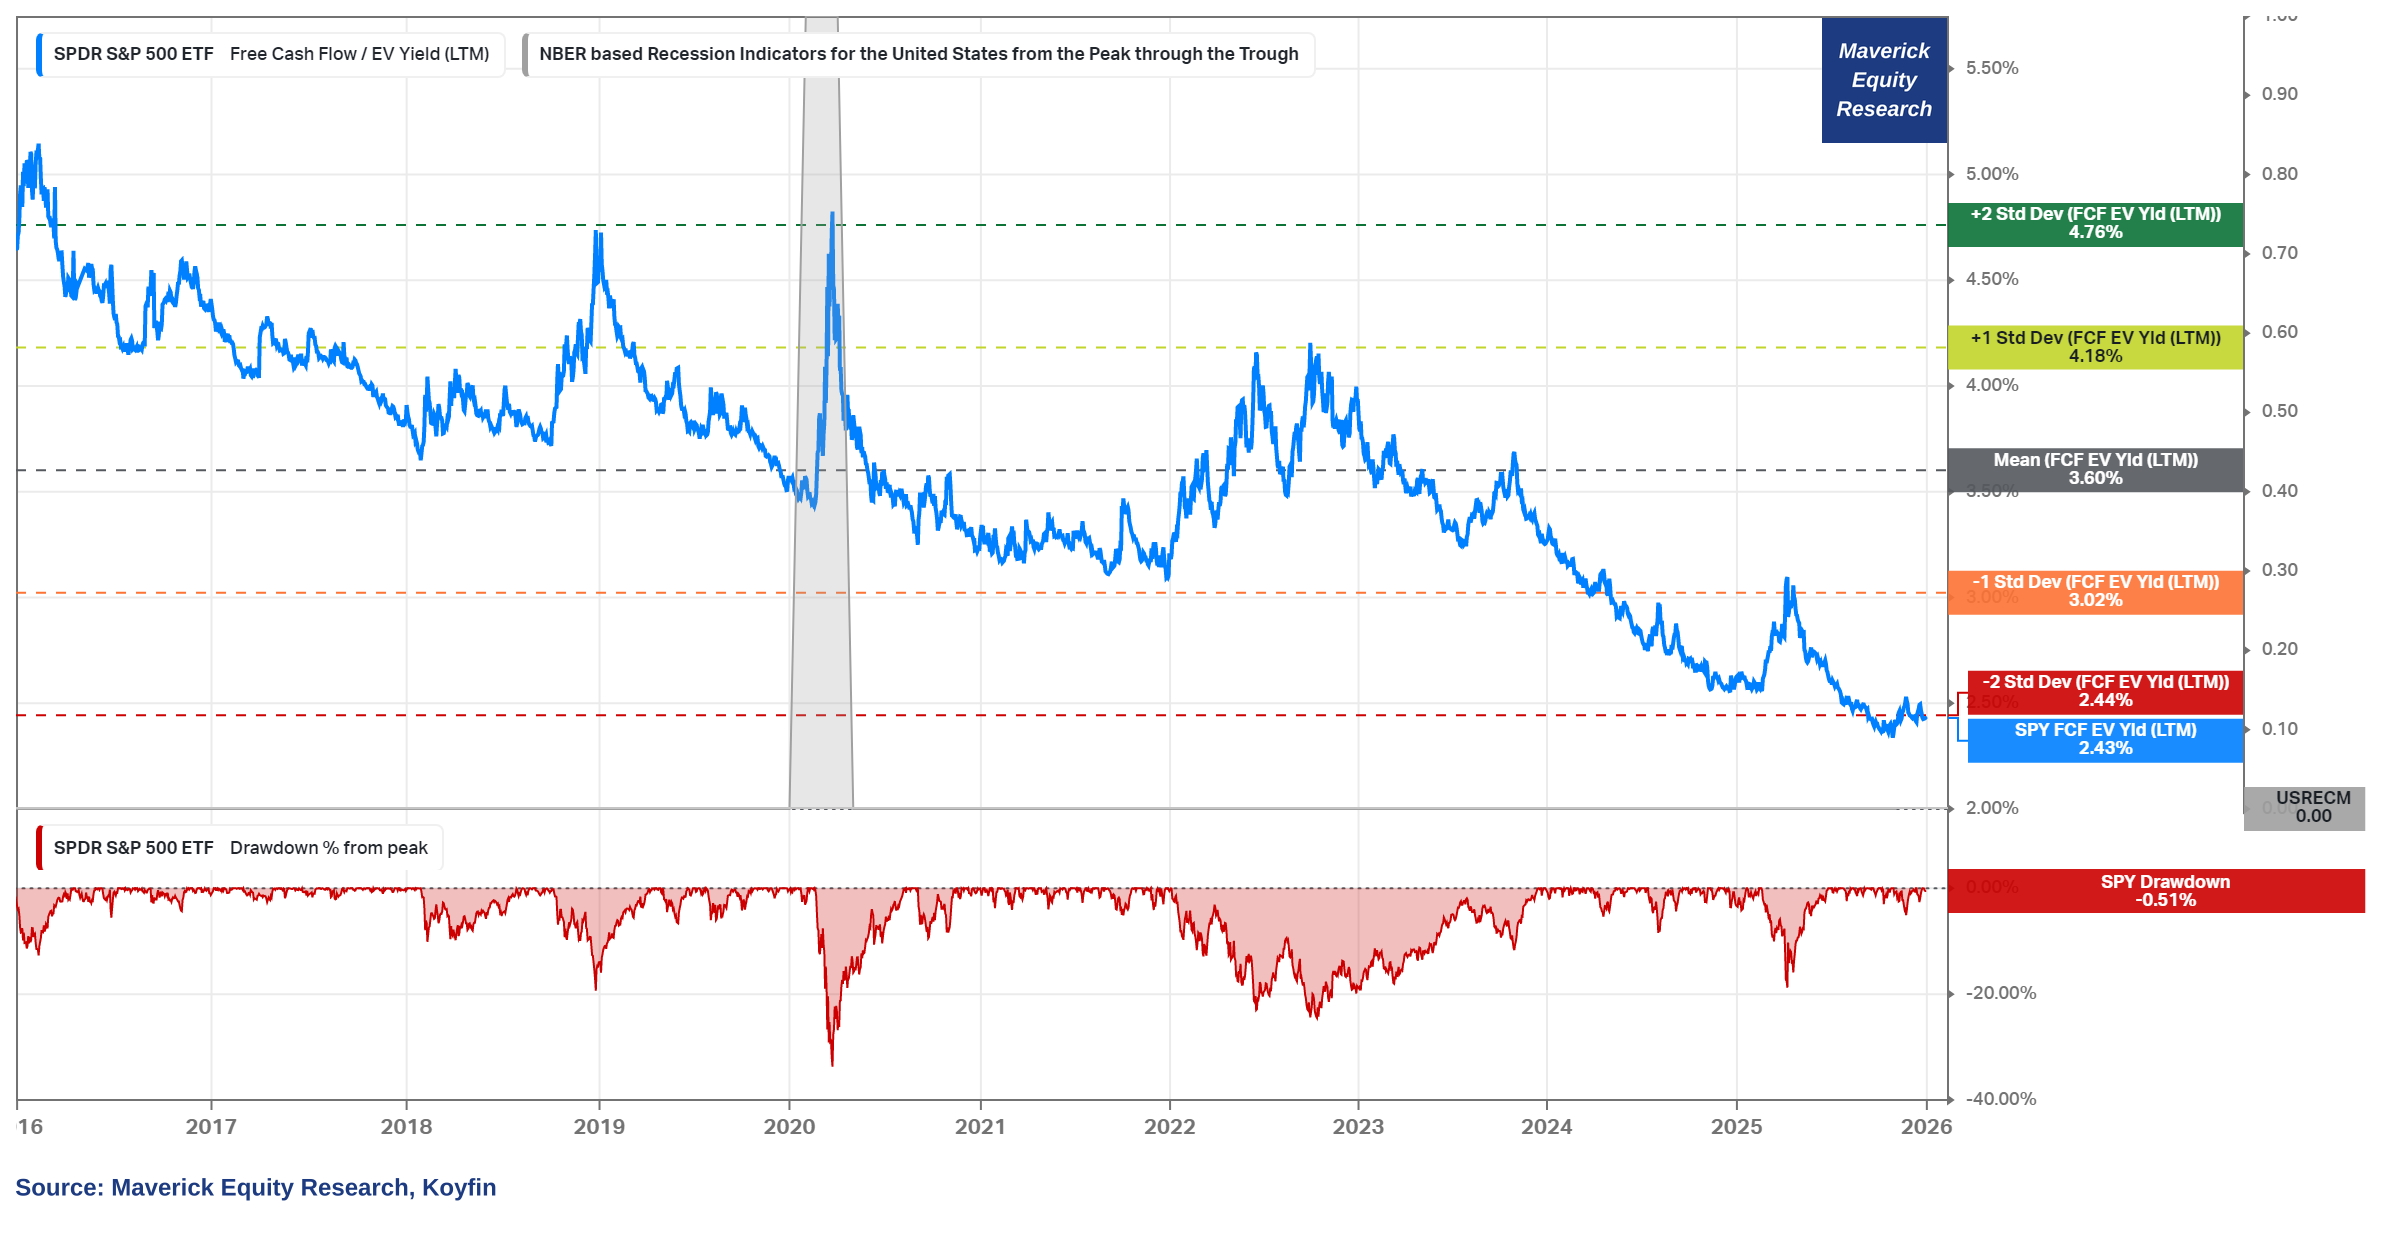
Free Cash Flow Yield (Free Cash Flow/Enterprise Value) — ‘Buy it High Sell it Low’
👉 at 2.43%, we are even below the -2 Standard Deviations (SD) of 2.44%
👉 = 33% lower than the 20 year average of 3.6%
P.S. way more on the S&P 500 via the quarterly 2 distinct reports, and lately materially improved in all areas: structure, flow, insights and special metrics you rarely see!
✍️ S&P 500 Report: Valuation, Fundamentals, Special Metrics & Leading Indicators
✍️ S&P 500 Report: Performance, Sentiment, Seasonality, Technical Analysis
📊 Thematic
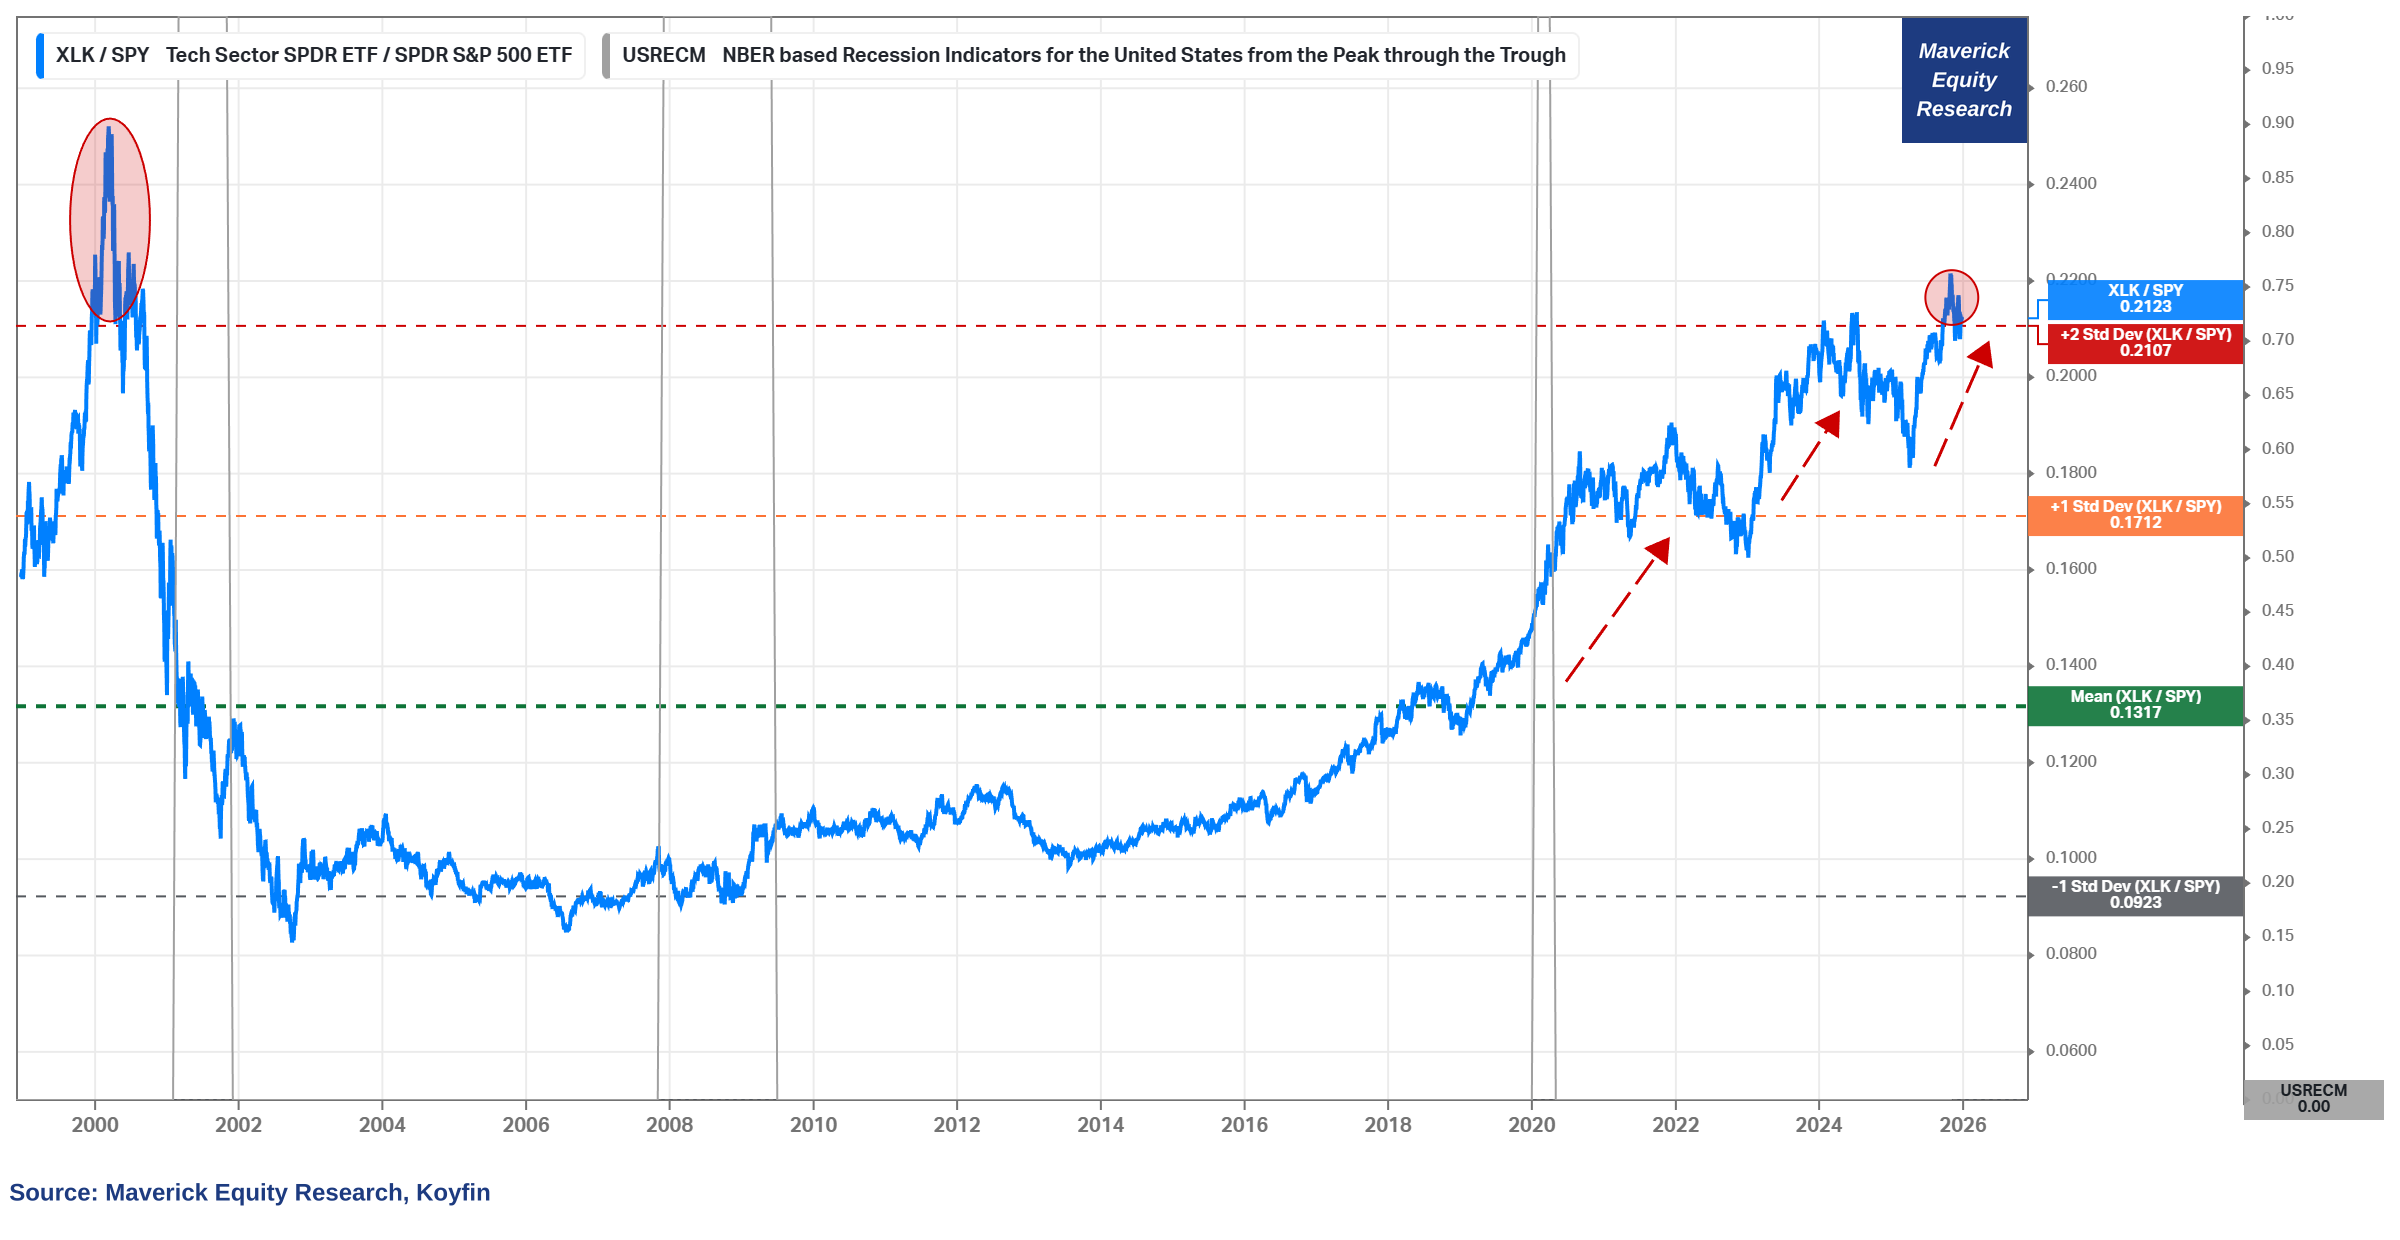
'Tech is Taking Over the World Baby!' chart via XLK/SPY, Tech relative to S&P 500:
👉 XLK US tech ETF sitting 2 standard deviations above the mighty S&P 500 SPY
👉 way above the mean, then during 2020 Covid it broke above the +1 Standard Deviation (SD) while since the 2023 ‘AI run’ now even above the +2 SD
👉 while tech today is real, it works, it is an integral part of all sectors of the economy, brings a lot of value (2001 dot-com empty concepts many), it’s hard to ignore the parabolic run lately, and how much future growth is baked into the valuations
‘Semiconductors are Taking Over the World Baby’ chart via SOXX/SPY:
👉 SOXX semis ETF sitting 2 standard deviations above the mighty S&P 500 SPY
👉 way above the mean, then during 2020 Covid it broke above the +1 Standard Deviation (SD) while since the 2023 ‘AI run’ now even above the +2 SD
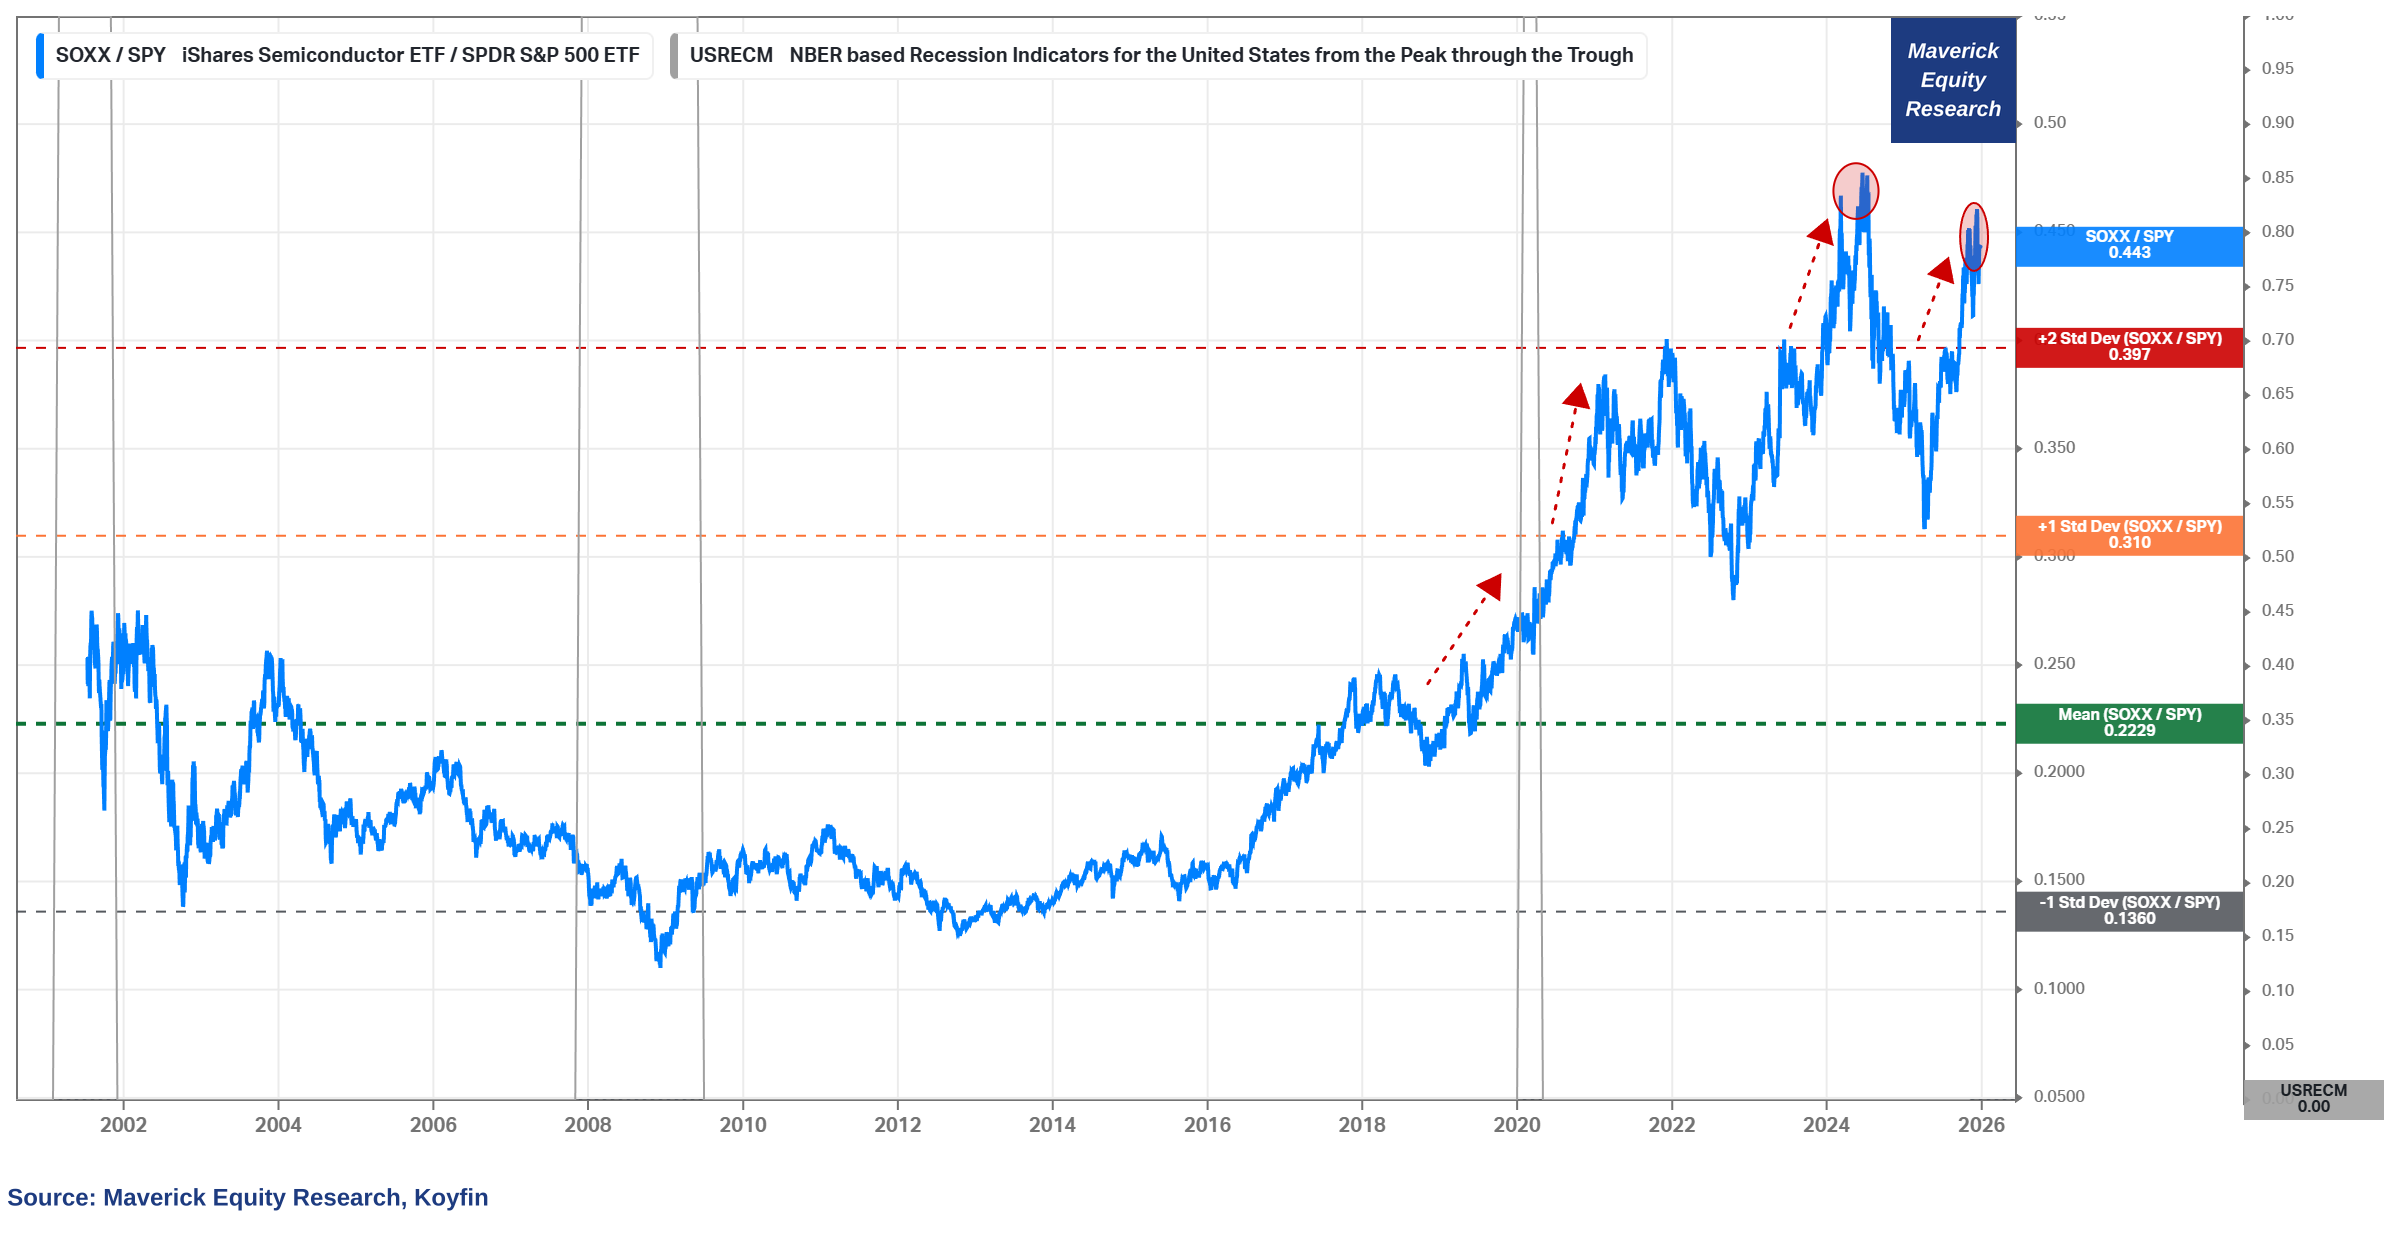
N.B. I do not compare the tech & semis to some gyzmo volatile empty sector, but to the mighty S&P 500 ... which is not a shabby construct at all, it’s the 11 sectors of corporate America which also derives 40% of revenues from outside the US ... and has performed very well since many many decades (if I would make the comparison with the S&P 500 excluding tech & semis, then the ratio would be even way higher!)
Let that sink in & ... food for thought(s) ... 😉
📊 Single Stocks
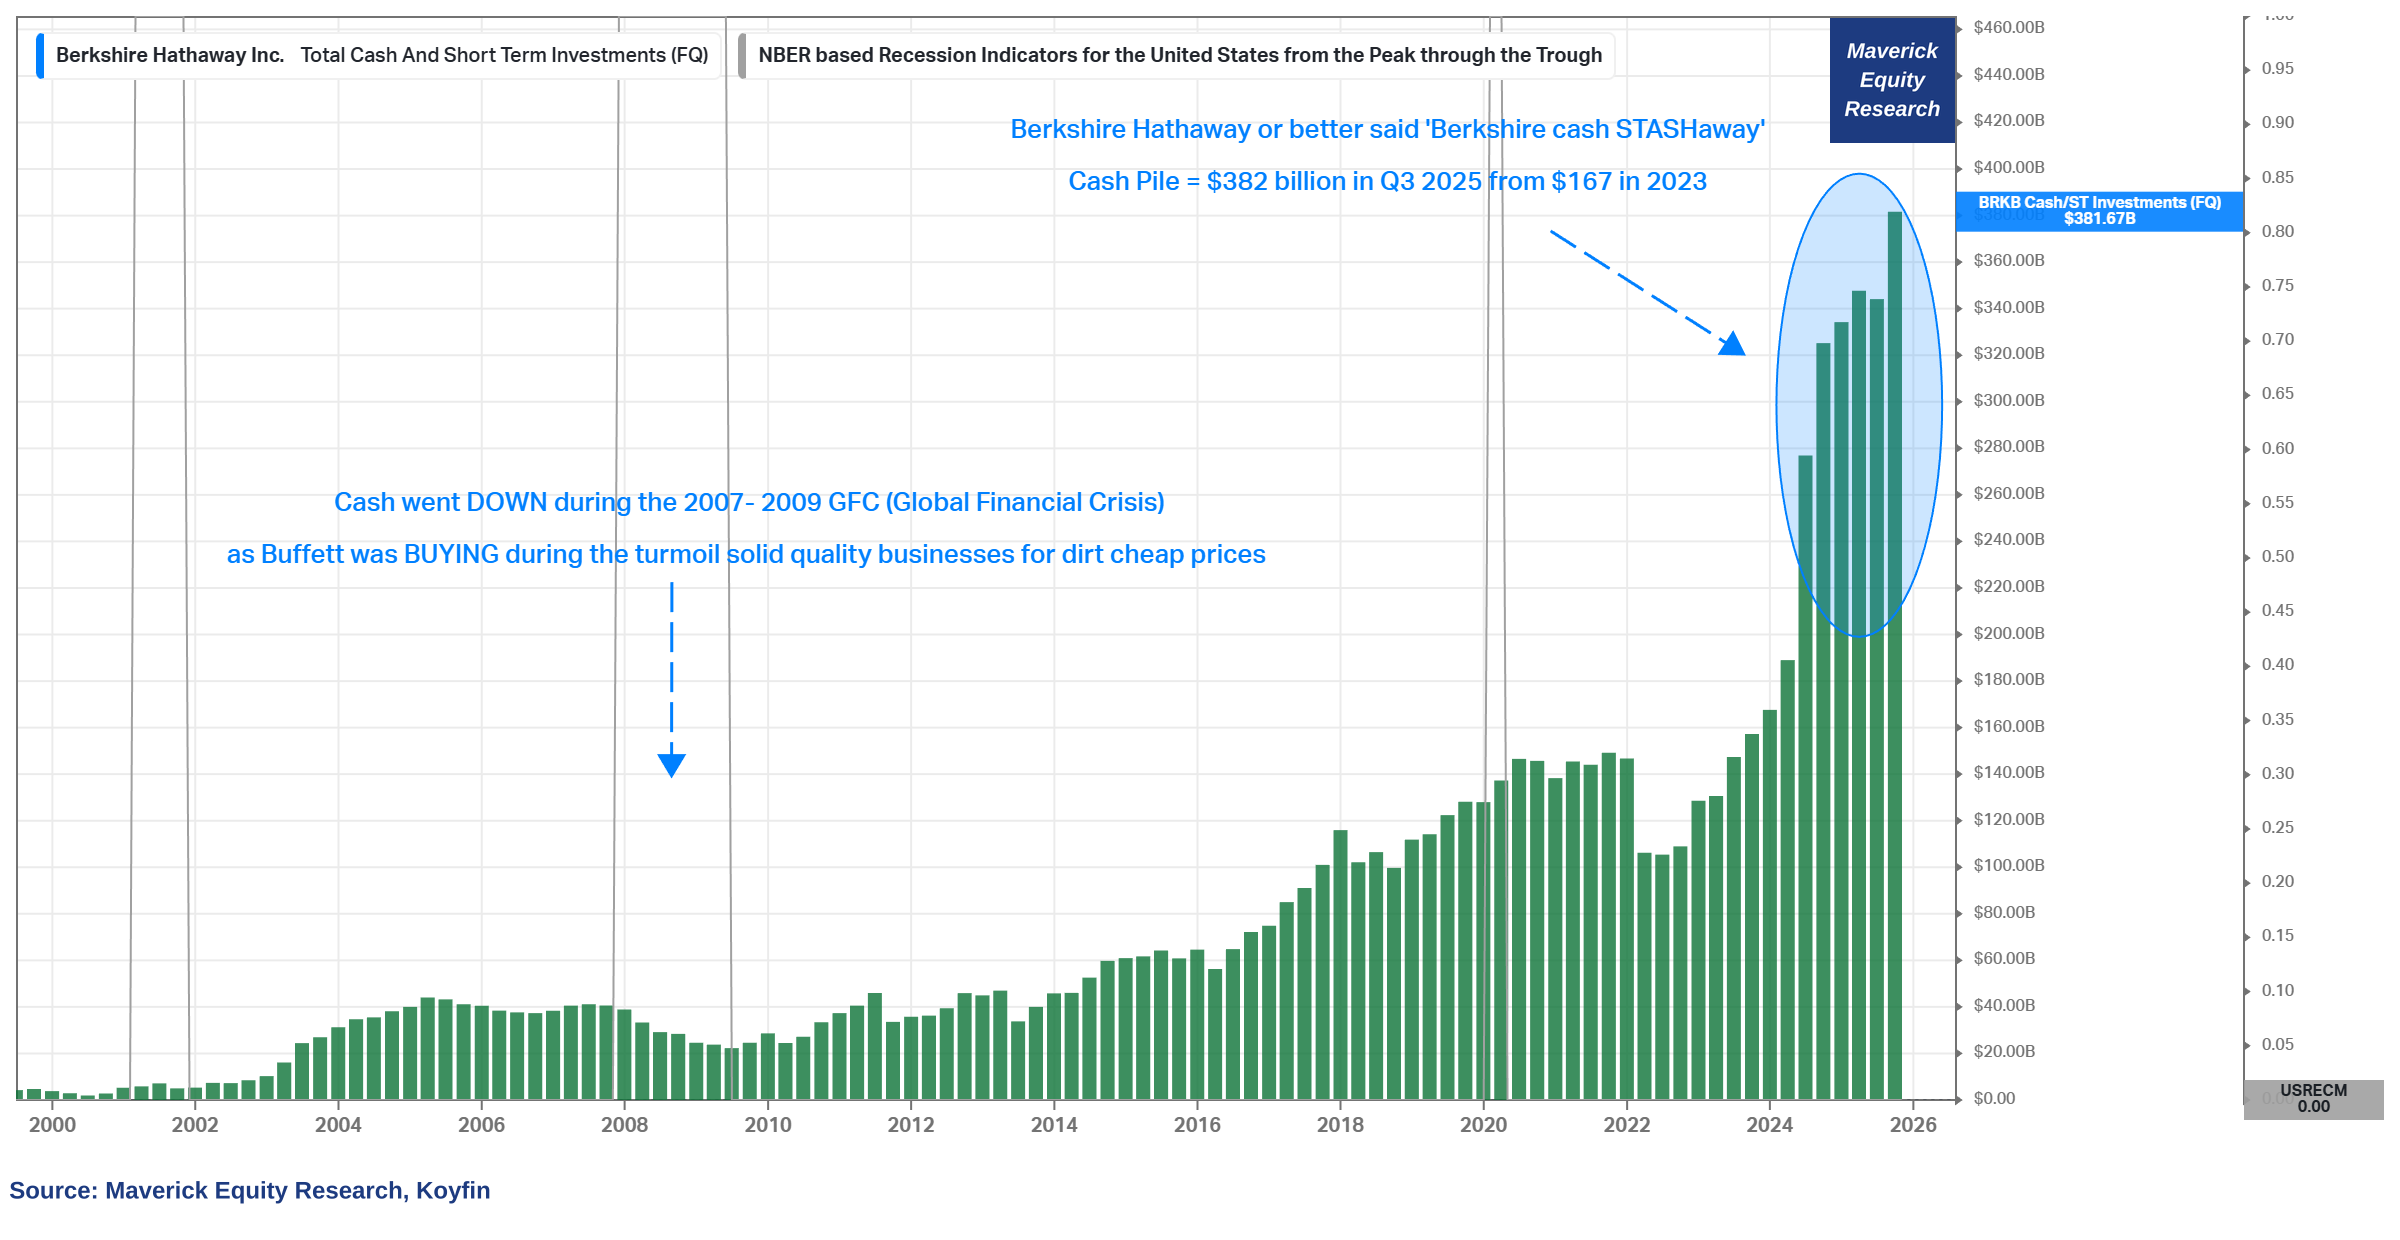
Buffet’s Berkshire (BRK-B) cash position — Stash Away Baby!
👉 spiked to $382 billion from $167 in 2023 for a 2.28x, and 33% as total assets!
👉 that yielding around $15 billion annually in a risk-free fashion!
👉 contrary to many headlines on the significance of this record cash pile, Buffett is NOT ‘forecasting’ a recession / market crash, he isn’t market timing, he isn’t making a ‘macro’ bet … he said he is not doing that many times! So, ‘what is he doing Mav?’
That will answered and a deeper coverage in the 2nd edition of The Berkshire Report!
✍️ Warren Buffett’s Cash Pile & More ... Stash Away Baby! Berkshire Hathaway Report #2
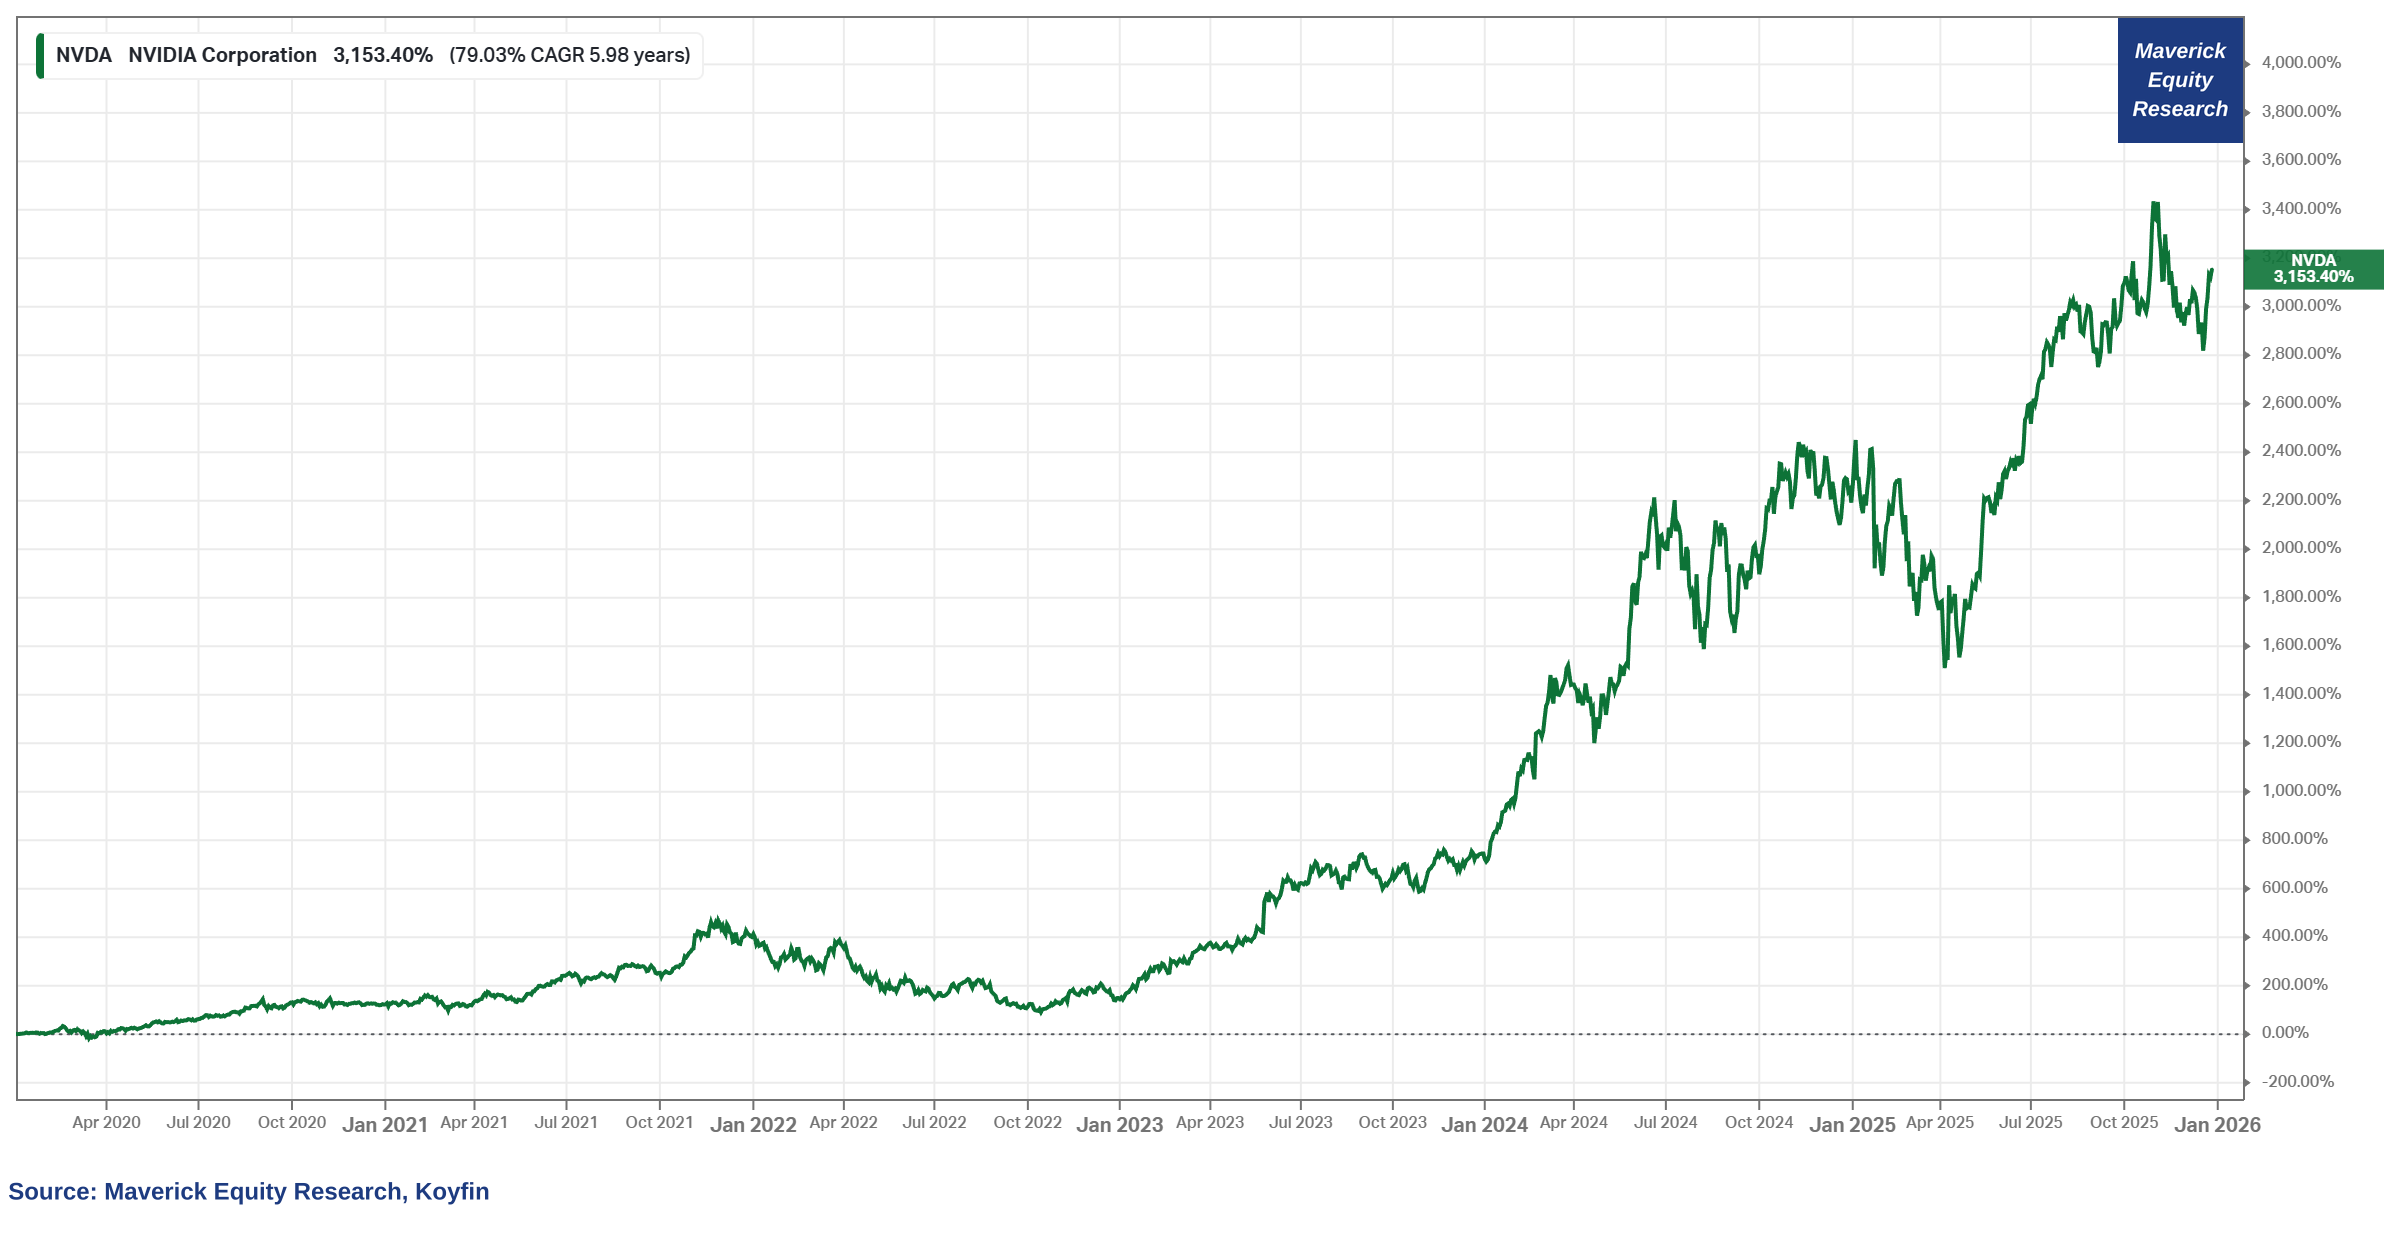
Nvidia (NVDA) via 2 Maverick charts to make you go 'hmmmmm ...':
👉 the parabolic performance we all know: 3,153% return for a 79% CAGR since 2020!
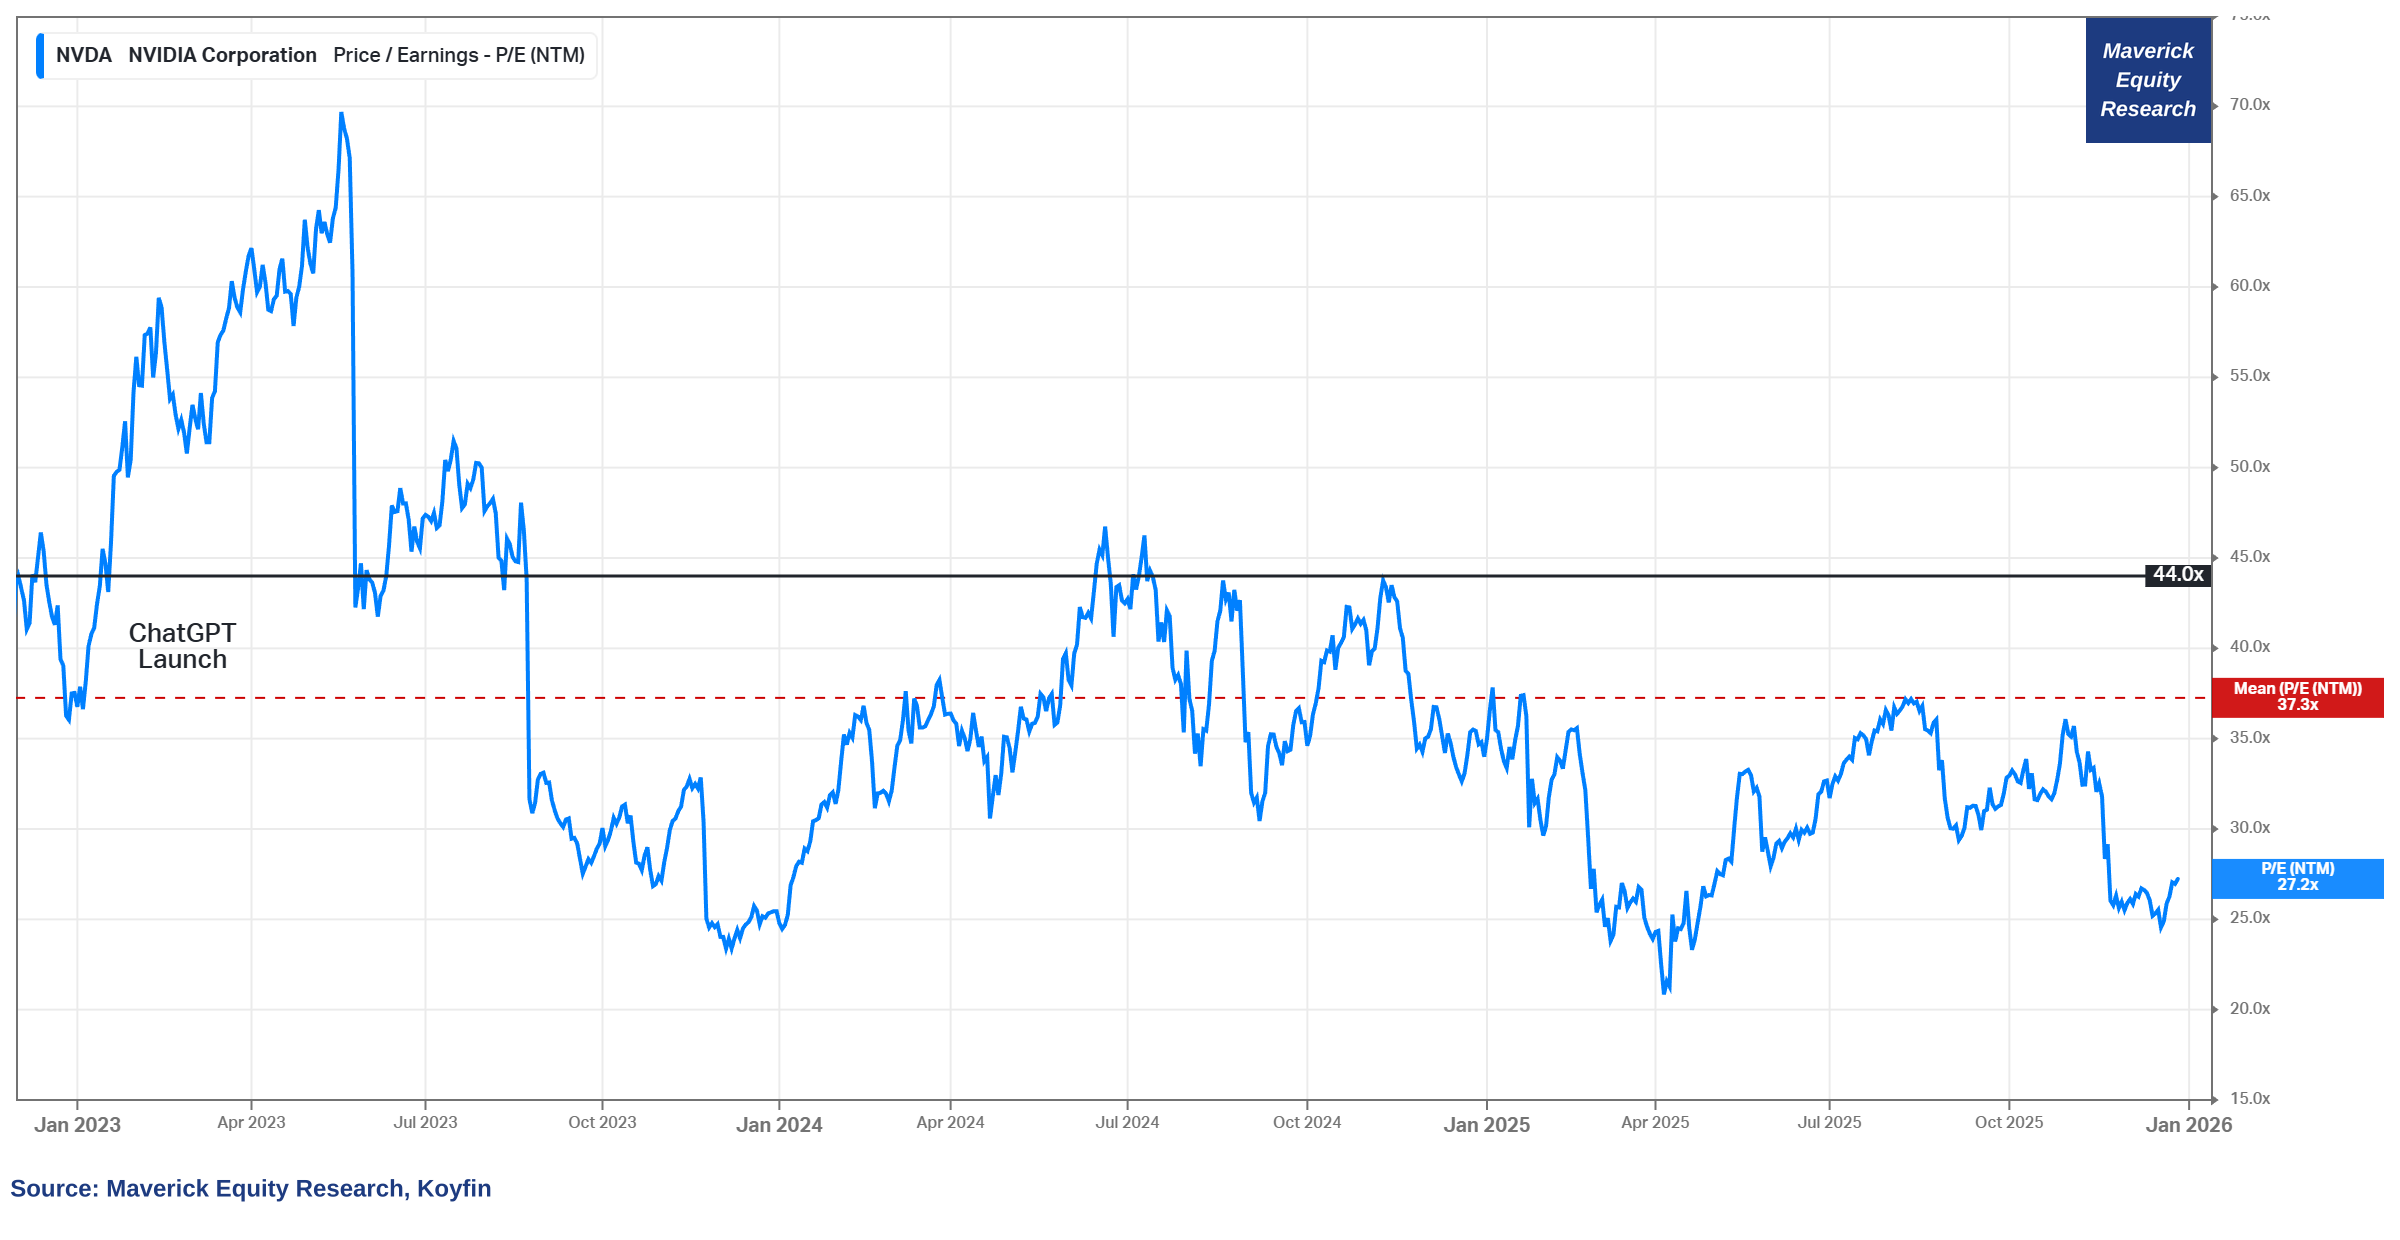
With that incredible outperformance, check the valuation via forward P/E = 27.2x:
👉 it dropped 16.8 points since the launch of ChatGPT!
👉 and way below the 37.3 average, hence a 10.1 points drop
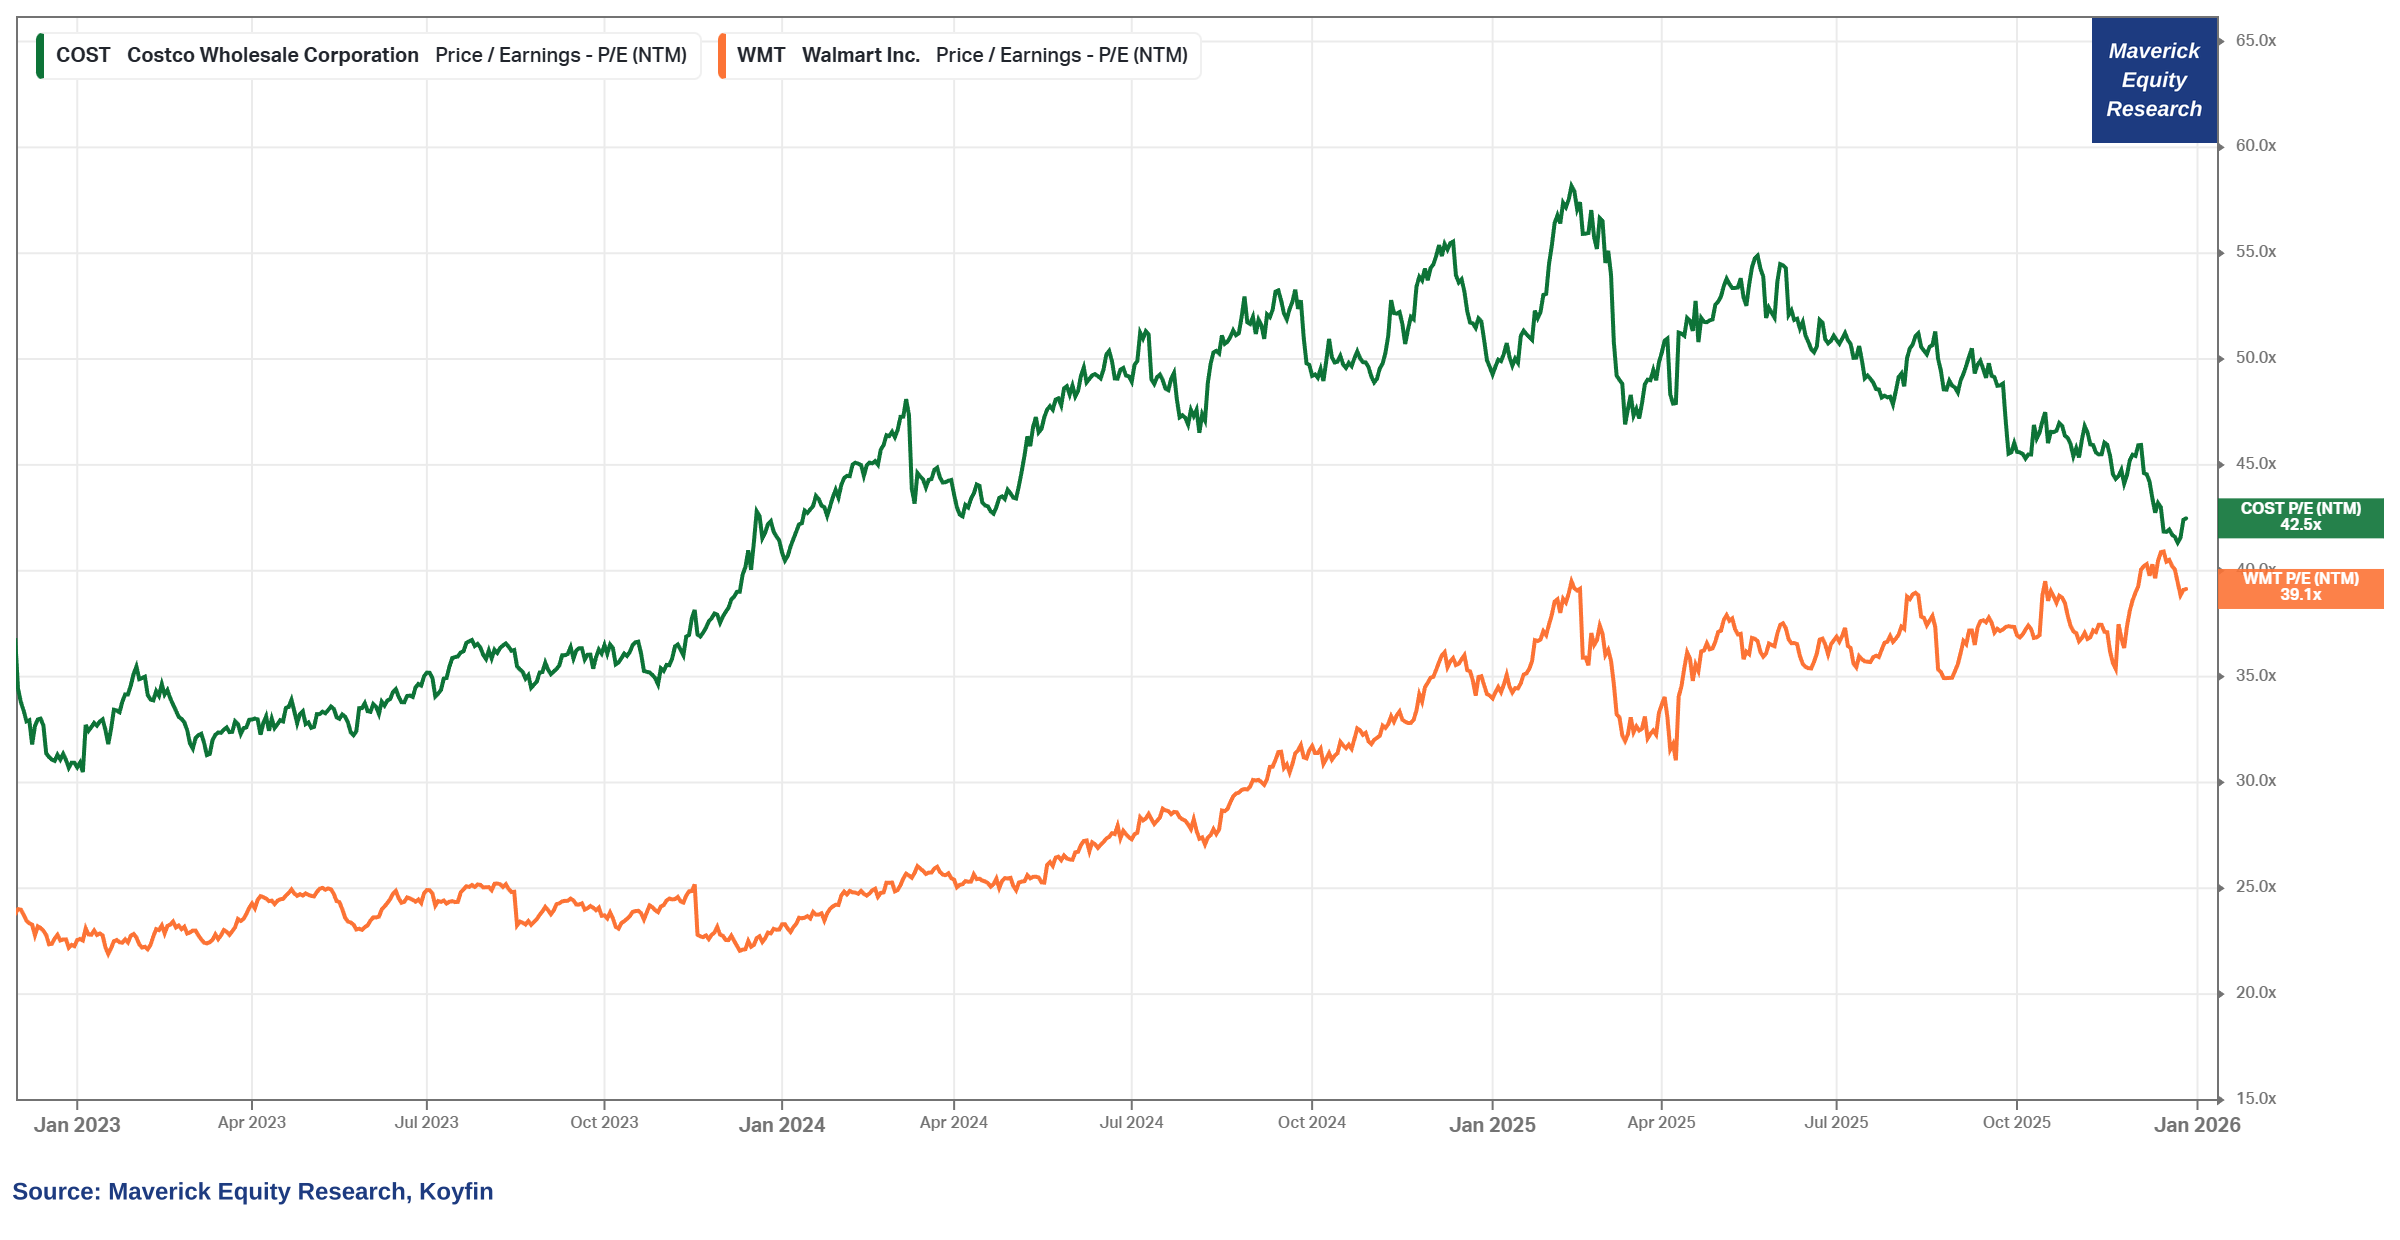
From Nvidia AI bro’ to retail non-AI bros, Walmart & Costco valuation via forward P/E:
👉 P/E of 42.5x for Costco and 39.1x for Walmart
👉 that is way higher than the Nvidia 27.2x …
Let that one sink in … bring the sink if you wish … and food for thought for you 😉
Musk danced with robots as Tesla shareholders approve a $1 trillion pay packet = largest in corporate history = $0 salary, all performance-based stock grants!
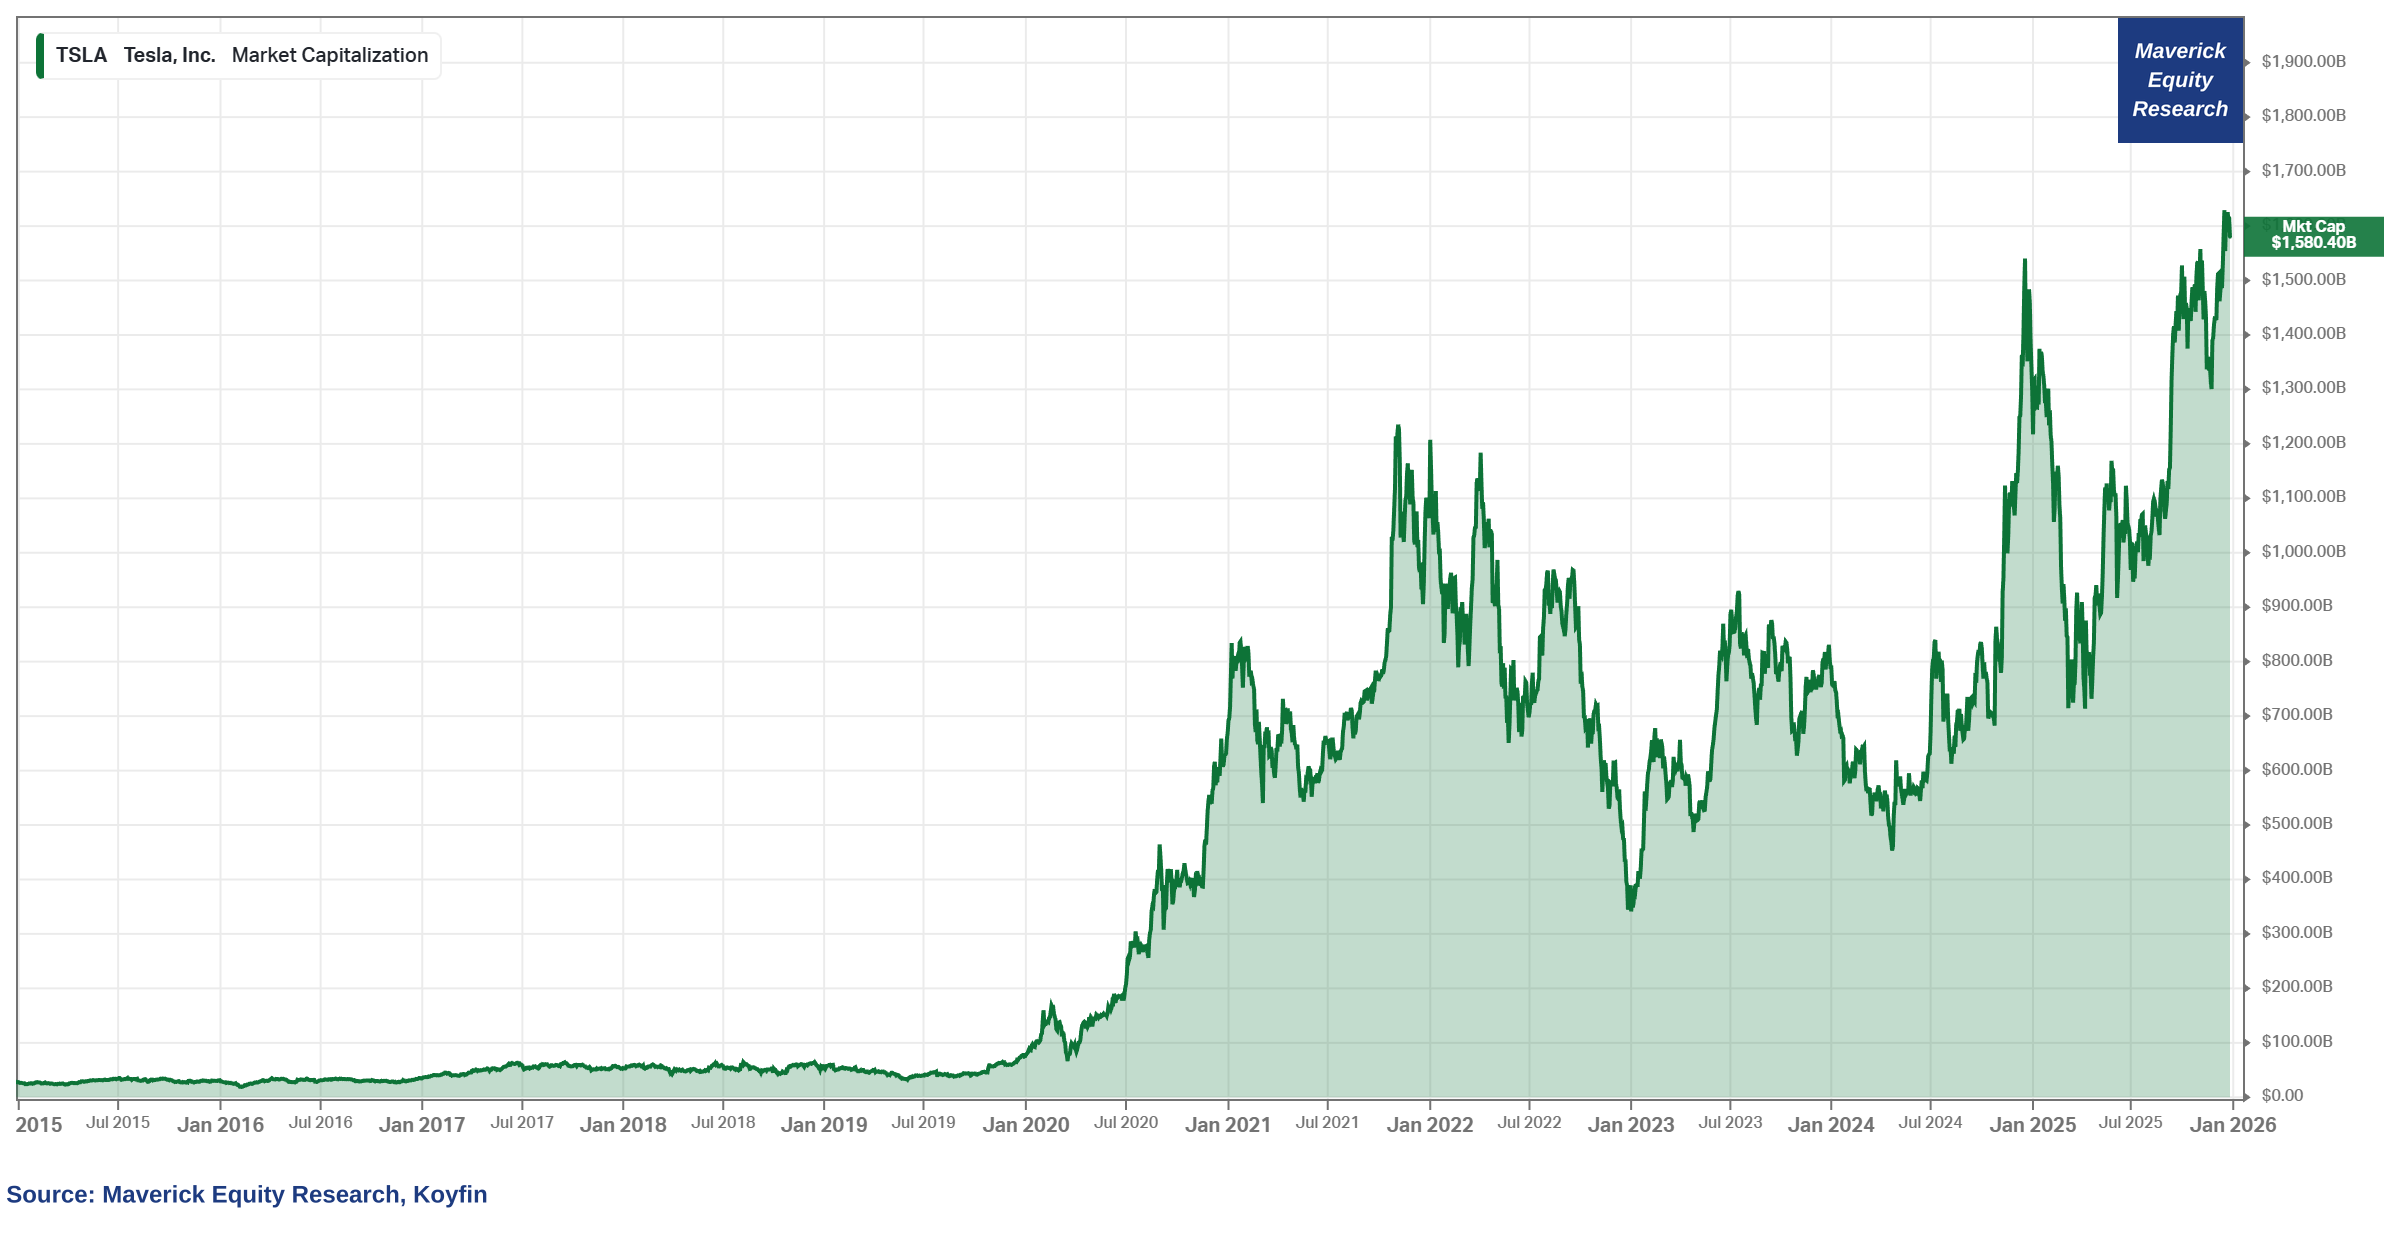
Before the targets for the $1 trillion check, a visual to show how Tesla did so far:
👉 Tesla IPO-ed in 2010 valued at $1.7 billion, and finished the 1st day at $2.2 billion
👉 2025 valued at $1.580 Trillion with a 60% CAGR since the IPO
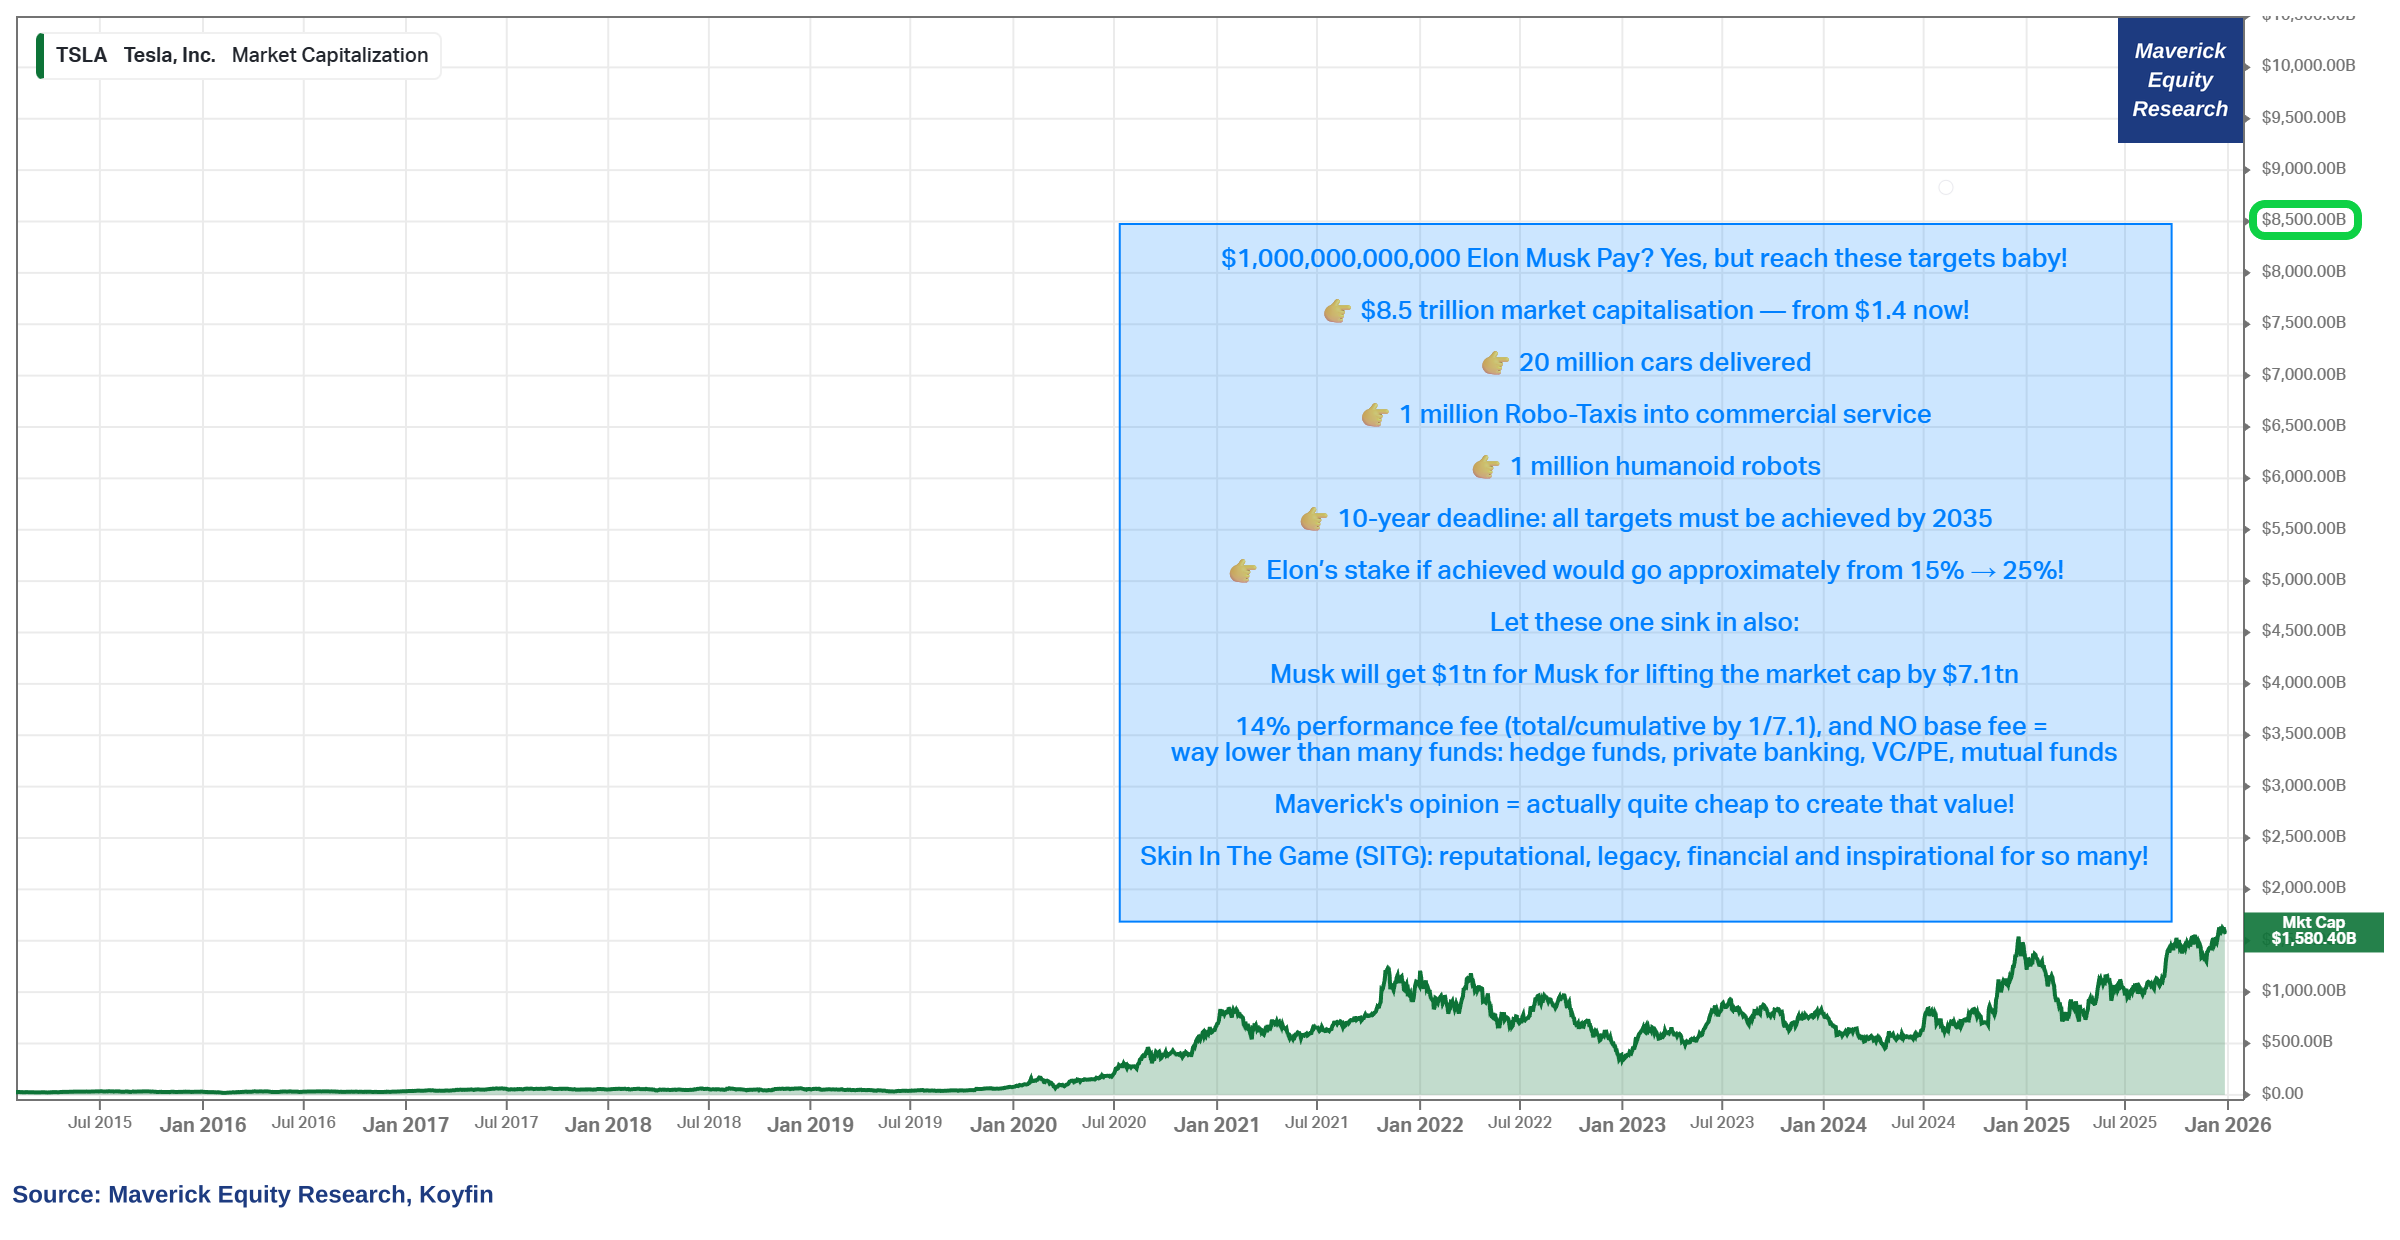
Bonkers pay = bonkers milestones in order to get that $1 trillion pay:
👉 $8.5 trillion market capitalisation target — from $1.4 now!
👉 20 million cars delivered
👉 10 million FSD (Full Self-Driving) active subscriptions
👉 1 million Robo-Taxis into commercial service
👉 1 million humanoid robots
👉 10-year deadline: all targets must be achieved by 2035
👉 Elon’s stake if achieved would go approximately from 15% → 25%!
Let these ones sink in also, I did not see these takes of mine out there:
$1tn pay for Musk for lifting the market cap by $7.1tn in order to reach $8.5 tn
= 14% performance fee (total/cumulative by 1/7.1), and NO base fee = way lower than many funds: hedge funds, private banking, VC/PE, mutual funds (Europe) etc
Maverick’s opinion = that is actually very decent, or even quite cheap! — I mean I personally got to know across time many CEO’s, entrepreneurs, investors, bankers, lawyers that would not move a finger for 14% for 10 years … so yeah …)
Super Solid Skin In The Game (SS-SITG): Musk must remain as CEO or in an executive role over product and operations for a specific period (at least 7.5 years) for the shares to be fully vested + reputation, legacy & inspirational for so many!
I did tens of thousandths of charts so far at many places and countries: stocks, bonds, macro, commodities, asset management, investor relations, investment banking, strategy, lending, leasing, risk management … charts for bank CEOs that were meeting Ms. Christine Lagarde ... you name it ... nonetheless, I never ever have thought I will make this truly special outlier one on Musk and Tesla! 😉
Why are some criticizing the pay package? It is their own shareholders who said YES for the pay = they can do whatever they want with with their own company & money!
Independent research here for sure, no politics, though a tendency I noticed generally:
👉 socialists angle: ‘crazy, too much, no way, not fair …’
👉 capitalists angle: ‘what targets need to be met?’
How achievable are the targets? Well, definitely ultra ambitious! If met, Musk deserves the trillion, if not met, then not met, hence not given! After all, as I always like to say: ‘you need 100,000 dreamers to make breakthroughs happen!’ So let’s let the people dance, dream and let’s see the achievements coming in, we need innovation!

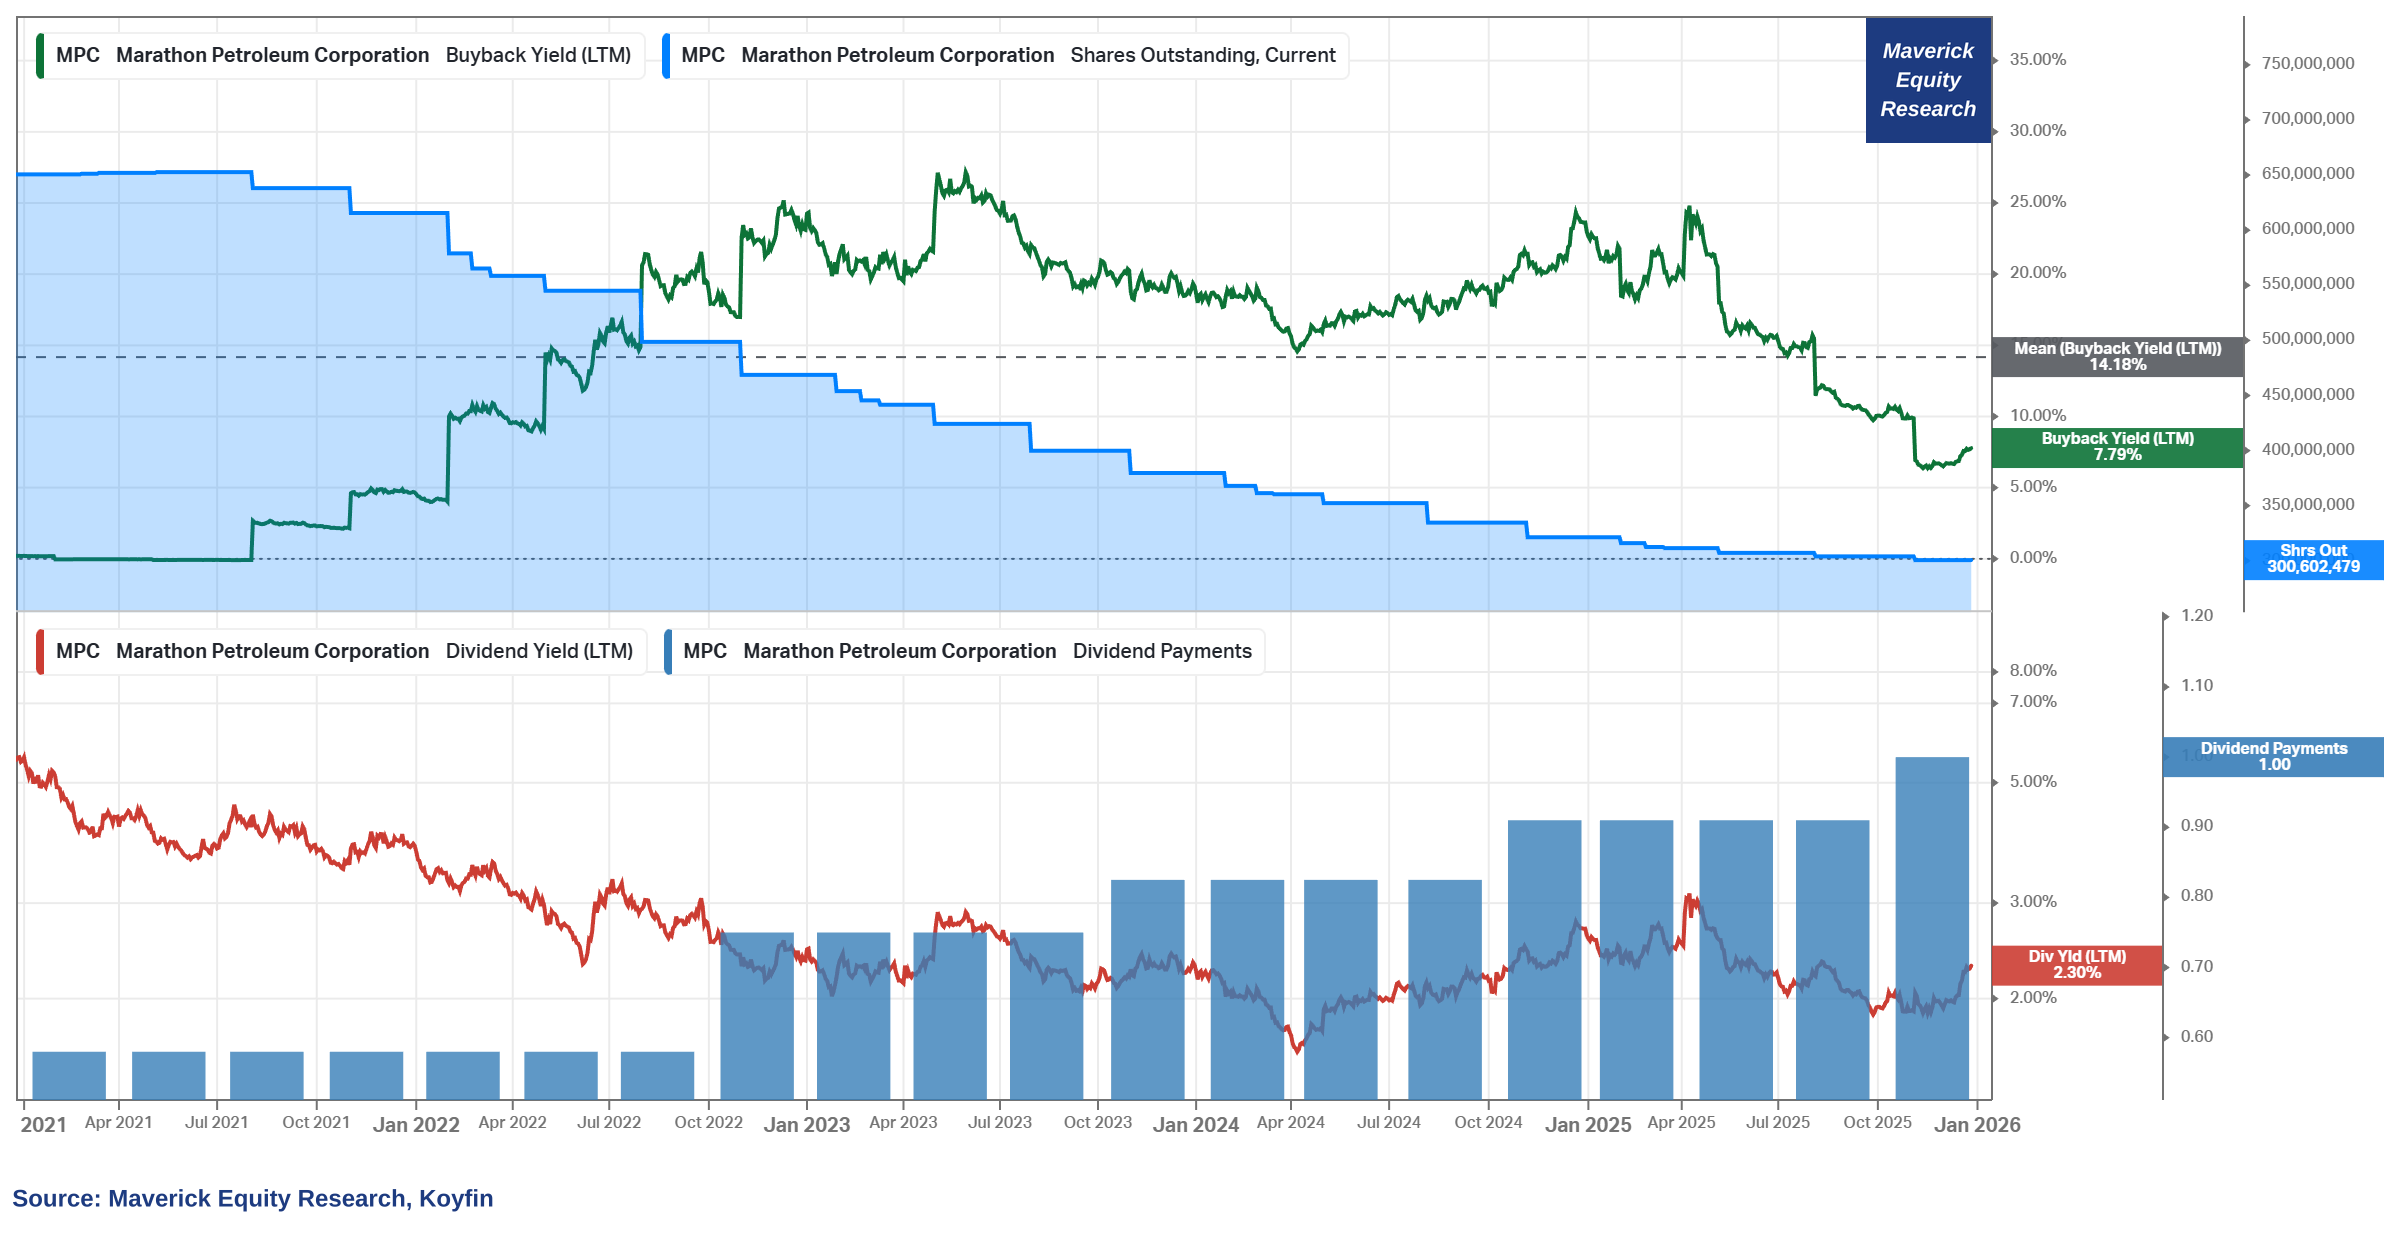
Marathon Petroleum Corporation (MPC) — Oil Baby Oil, Energy Baby Energy!
👉 7.79% buyback yield, +20% for quite a while, 14.18% average in the last 5 years, hence shares outstanding getting lower lower lower ...
👉 dividend yield = 2.3%, increasing dividend payments, 4 years in a row
👉 stock return in the last 5 years? 352% with a whooping 35% CAGR — not a sexy business, not in the headlines, not popular … yet delivering solid energy/oil & returns!
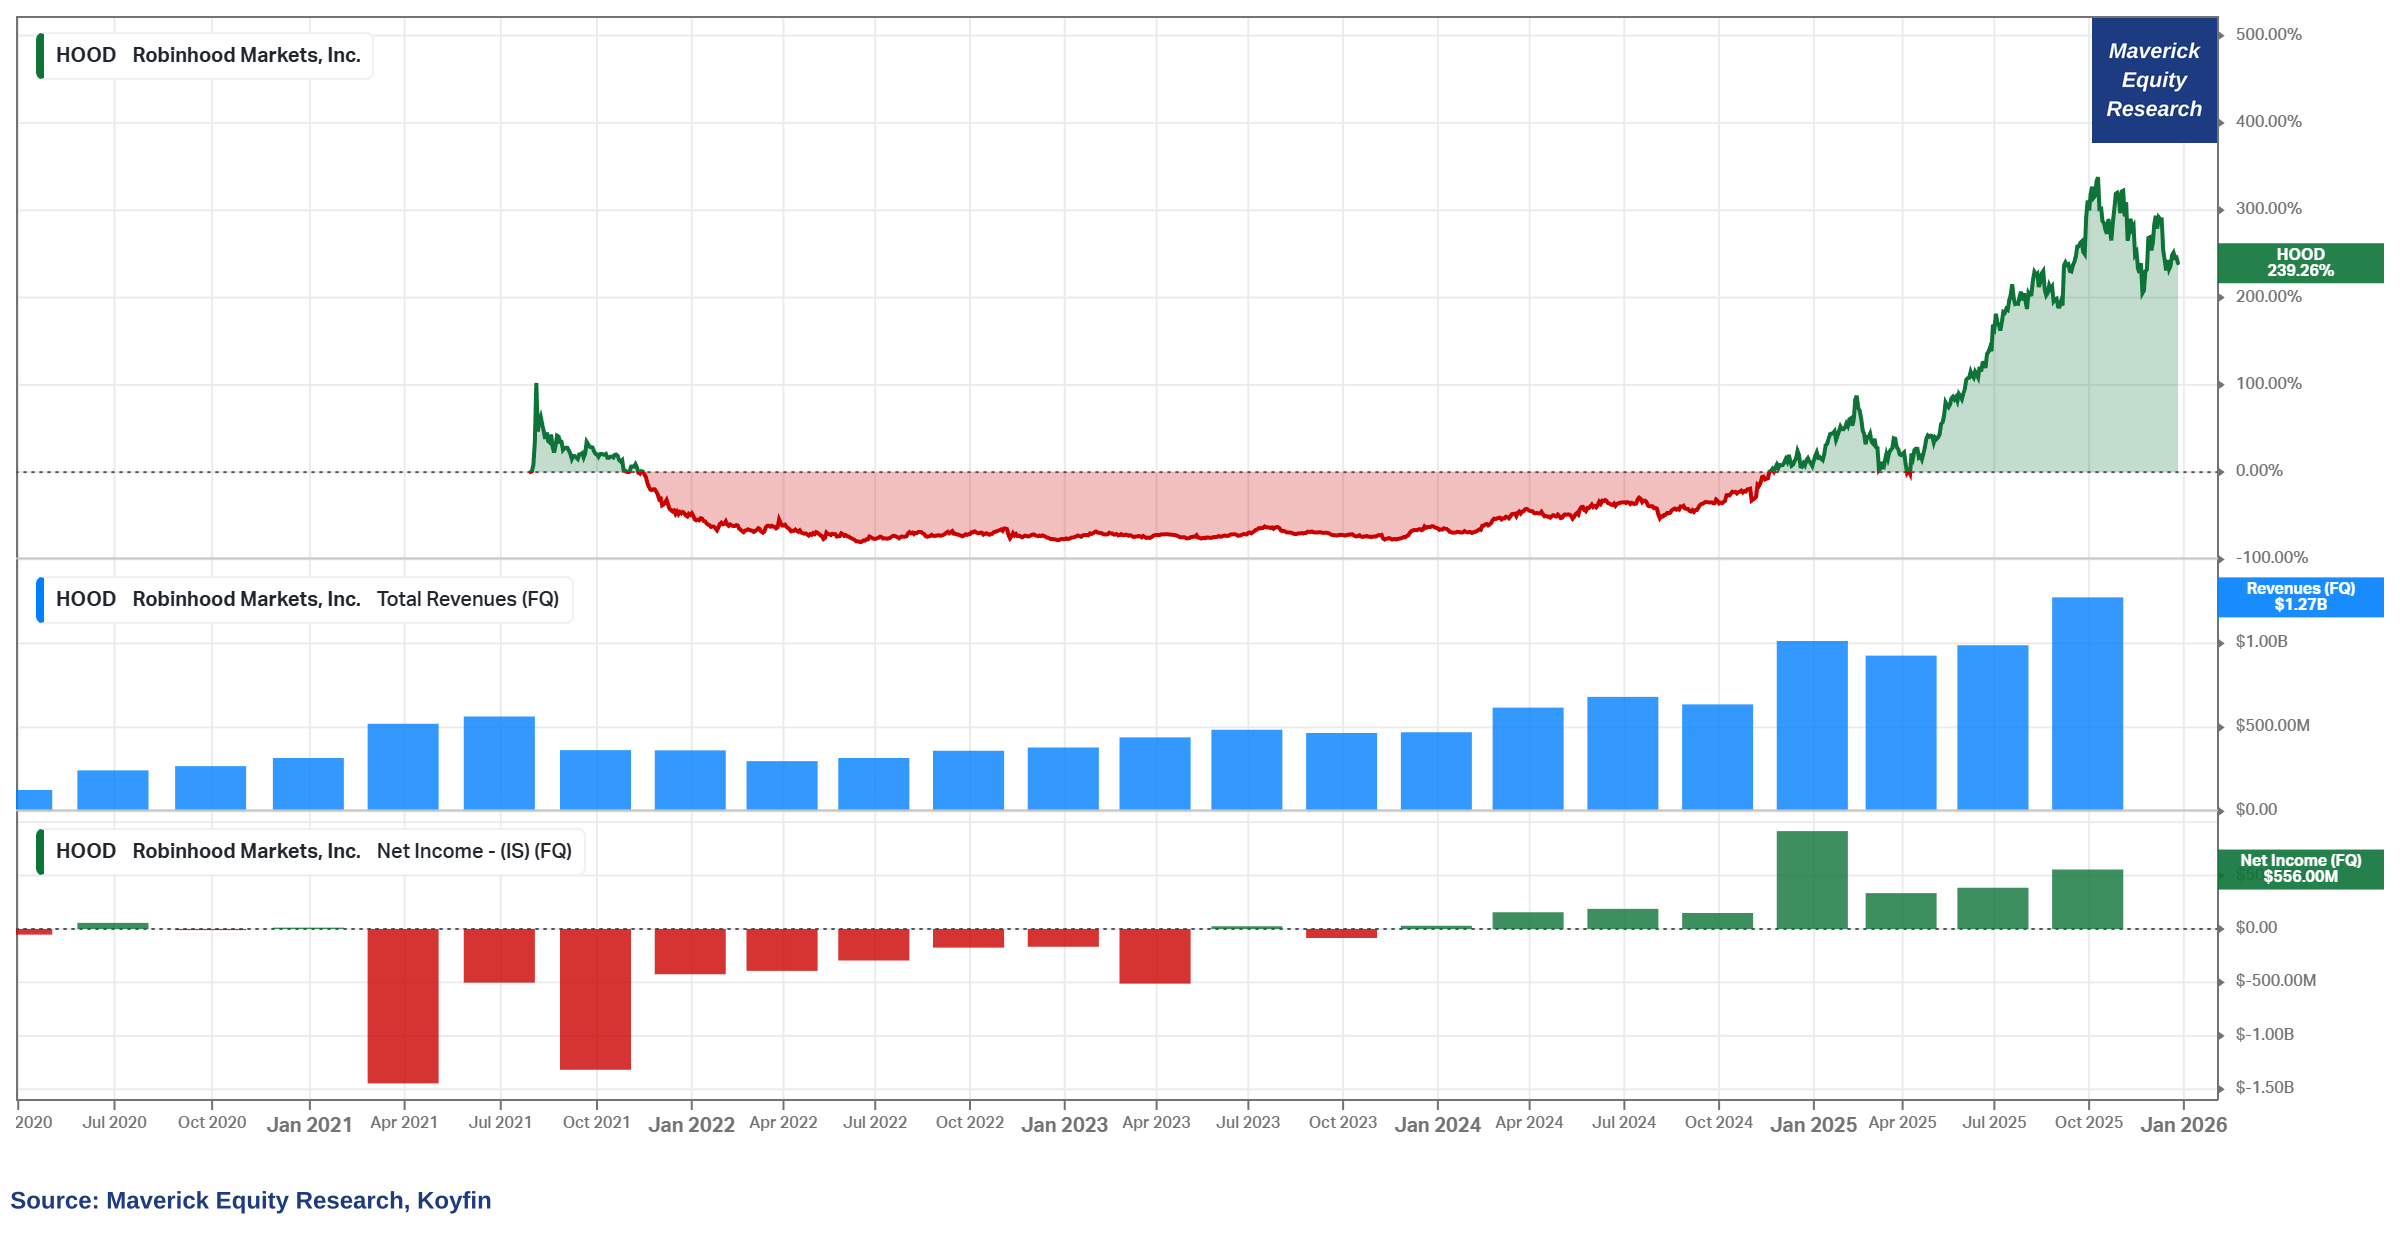
Robinhood ‘alpha’ trader vs Robinhood alpha stockholder (HOOD) = why it is bad to be a Robinhood trader, but great to be a Robinhood stockholder:
👉 Robinhood stockholder ringing the cash machine like there is no tomorrow:
+239% since IPO (July 2021) with a 23.73% CAGR
+198% last 12 months, and
+217% in 2025 (sales & net income performing very well lately via direct fees, PFOF & more)
👉 since 2021, typical Robinhood user/trader/investor not even breaking even, and that is as expected of course, at least by me (chart 2)
‘Why this performance gap Mav? It is upside down!’
Simple: the latter (stock) is due to the former (client) … let that one sink in also!
P.S. it’s a bit like MicroStrategy & Bitcoin, and generally with Crypto: bad if you trade it, great if you own of the infrastructure, heads you win tails you win = more trades, more hype, more money (not to mention the bitcoin/crypto pumpers and scammers)!

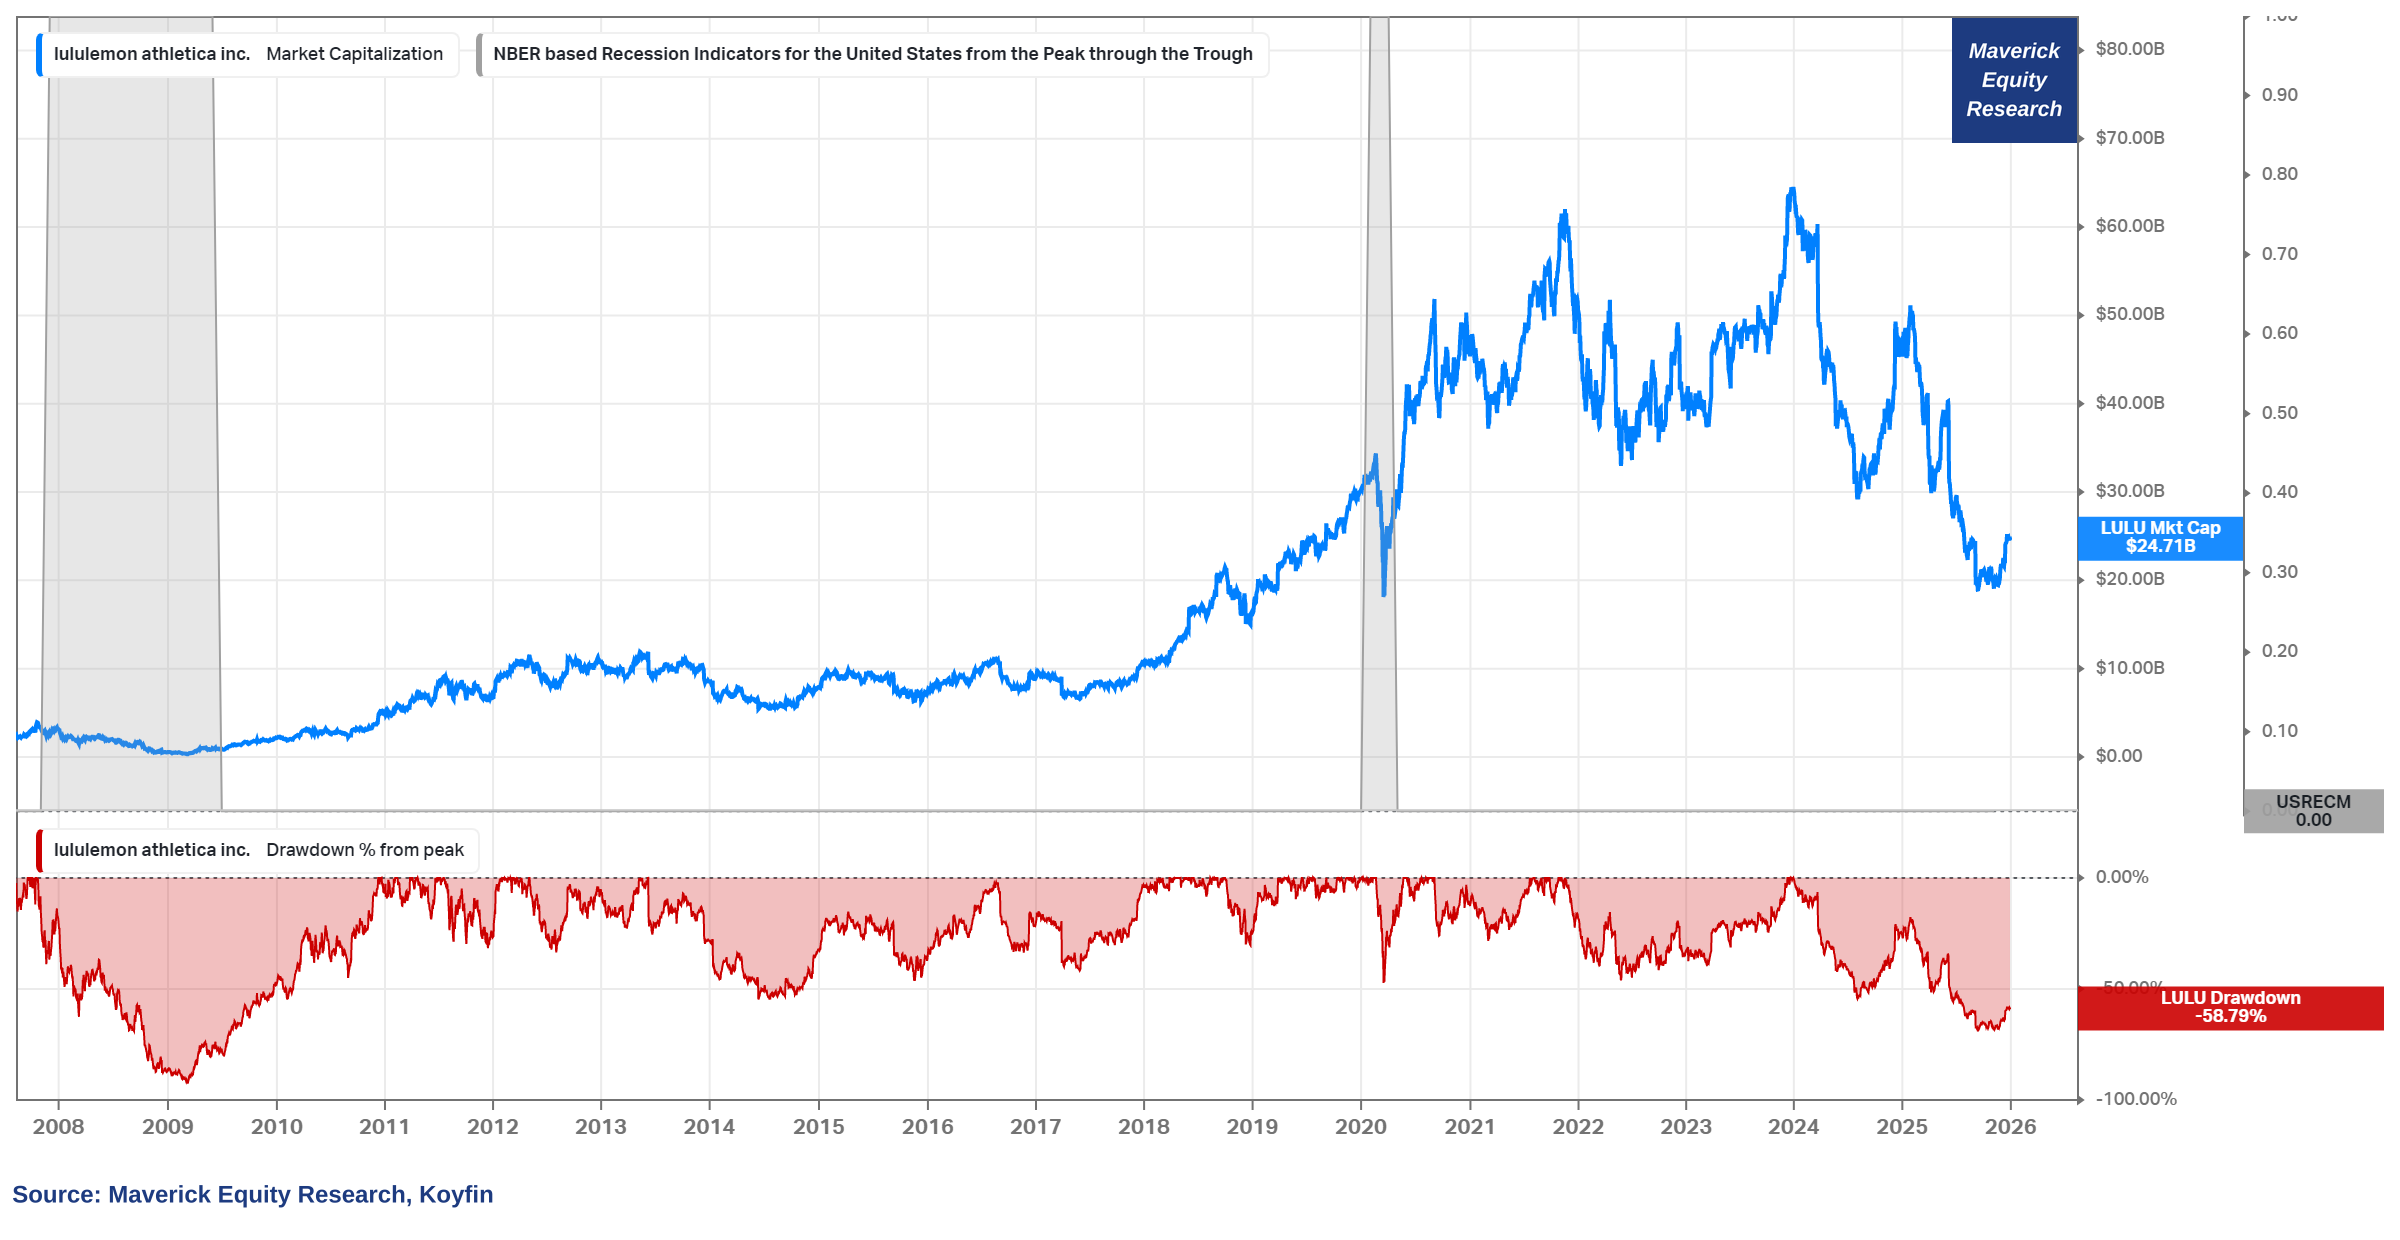
Lululemon (LULU) sexy leggings get tighter and tighter, yet the stock can’t resist the heat (pun intended):
👉 from a $65 billion market cap in December 2023, now at $24.5 billion market cap
👉 shed a remarkable $40 billion in market cap in the last 2 years & a 59% drawdown
👉 nonetheless, stock rebounding in December on the back of the resignation of long-term serving CEO, Calvin McDonald, and as well announcements of activist activity
📊 Macro & Fixed Income
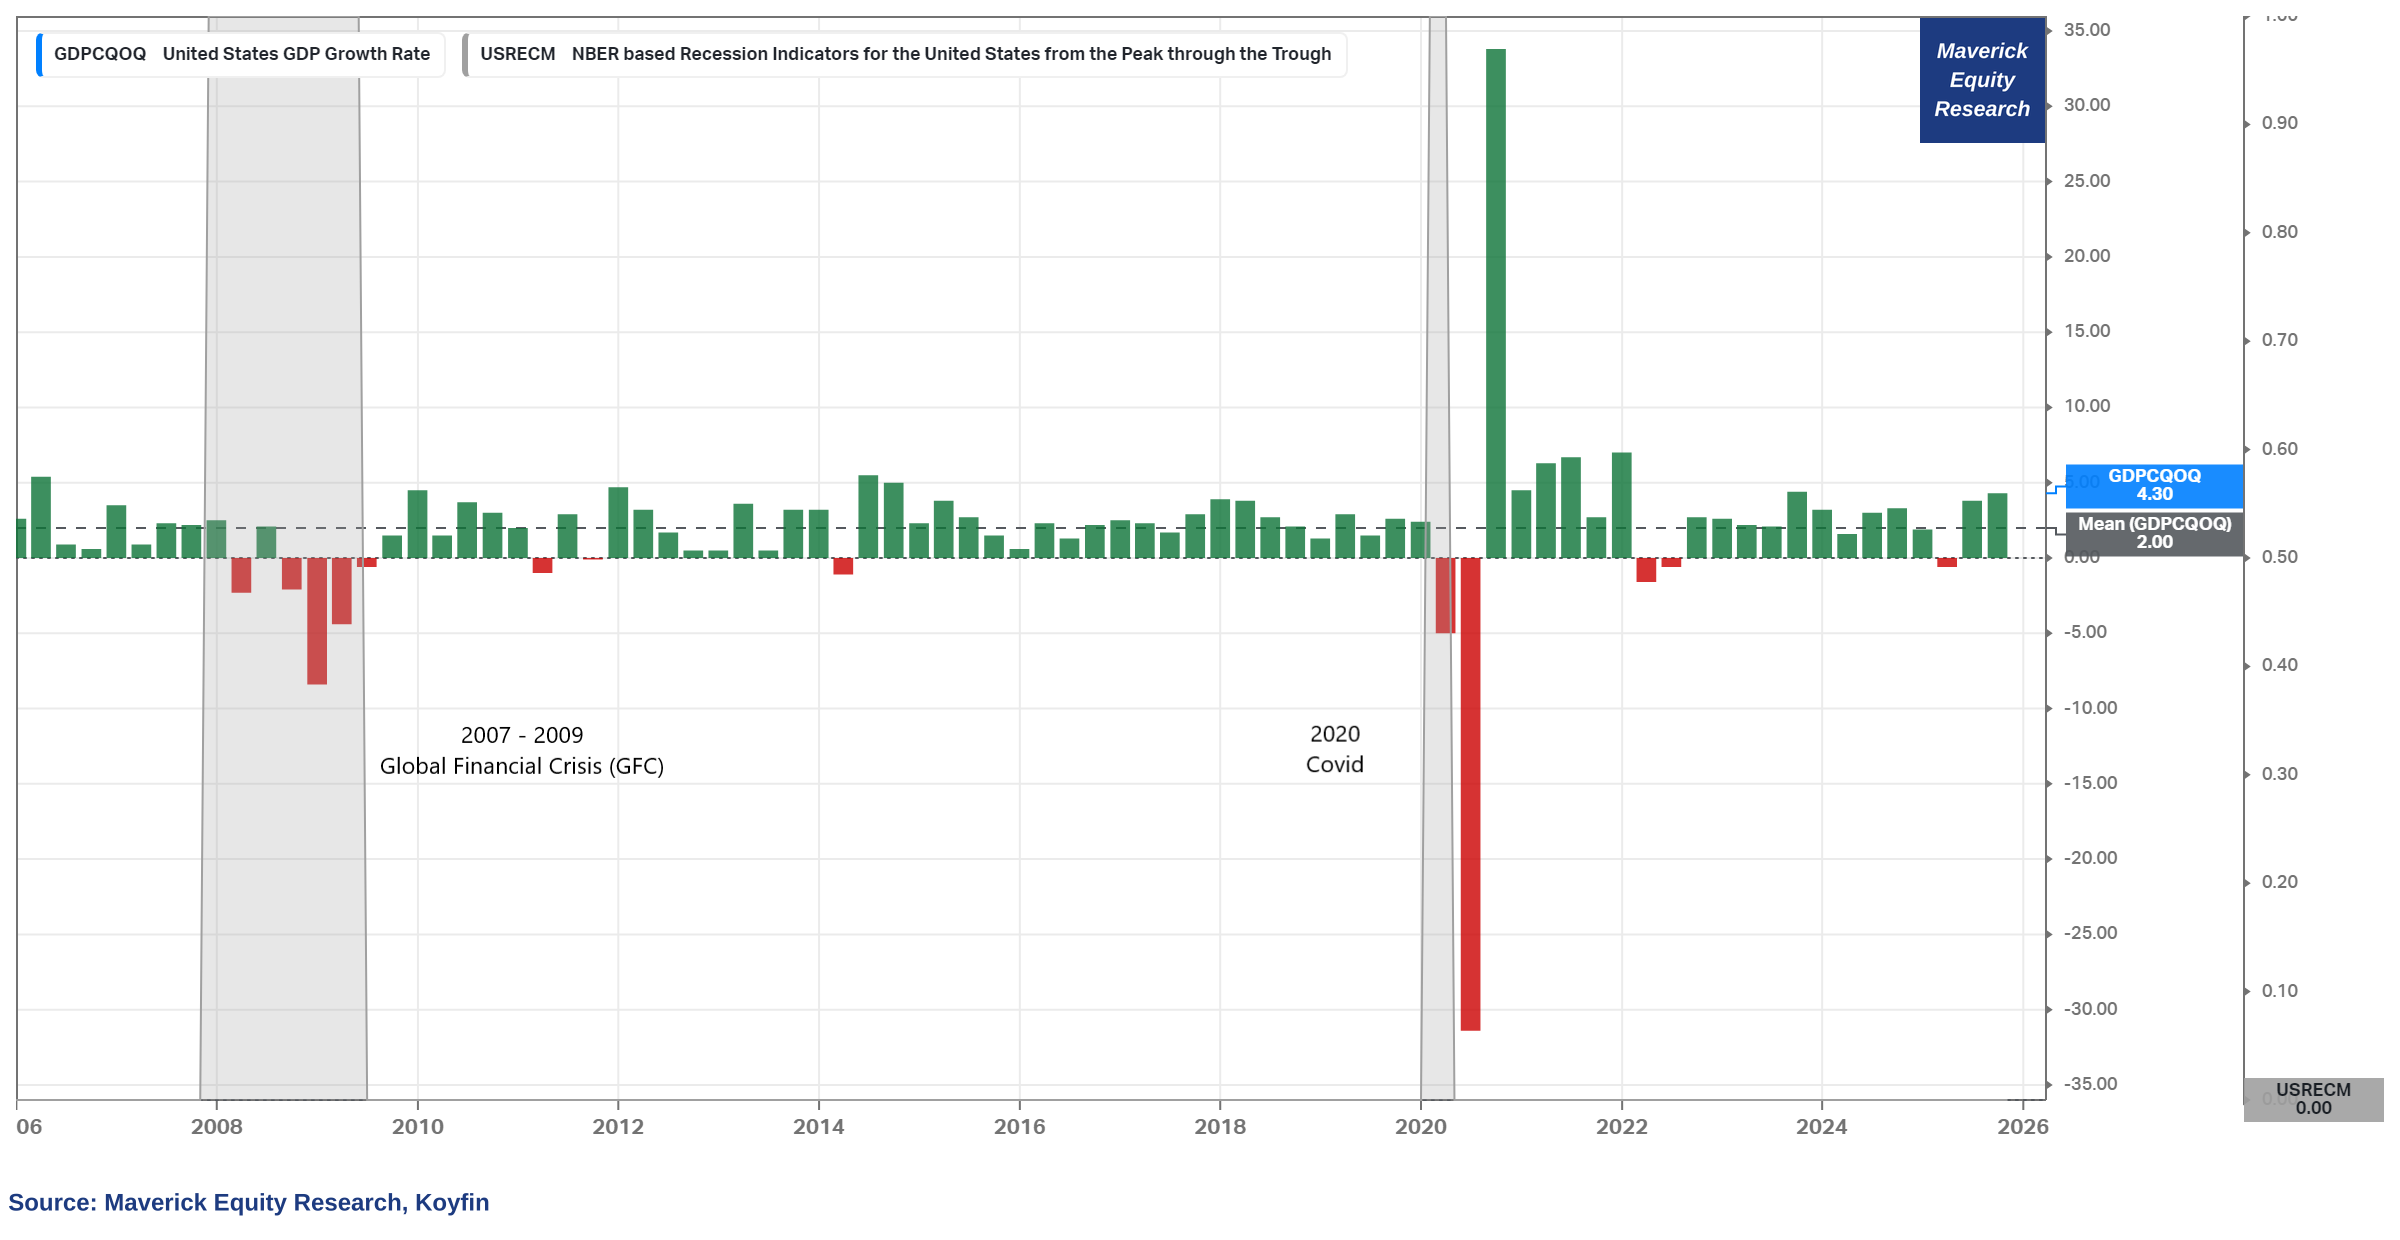
U.S. GDP — quarterly data since 2005 to capture well the business cycle:
👉 Q3 2025: +4.3% real growth annualized = strongest growth in two years = above prior quarter's Q2 3.8% increase = growing way above the 2% average since 2005
👉 Q4 2025: +3.0 via the December 23rd GDPNow Altanta FED estimate and +2.1% via the December 26th New York Fed Staff Nowcast = 2.55% average of the two
👉 once the data is out for Q4, hence 2025 overall = a good year in any case!
P.S note the 2007-2009 recession, and also the 2020 Covid stop & go big swing
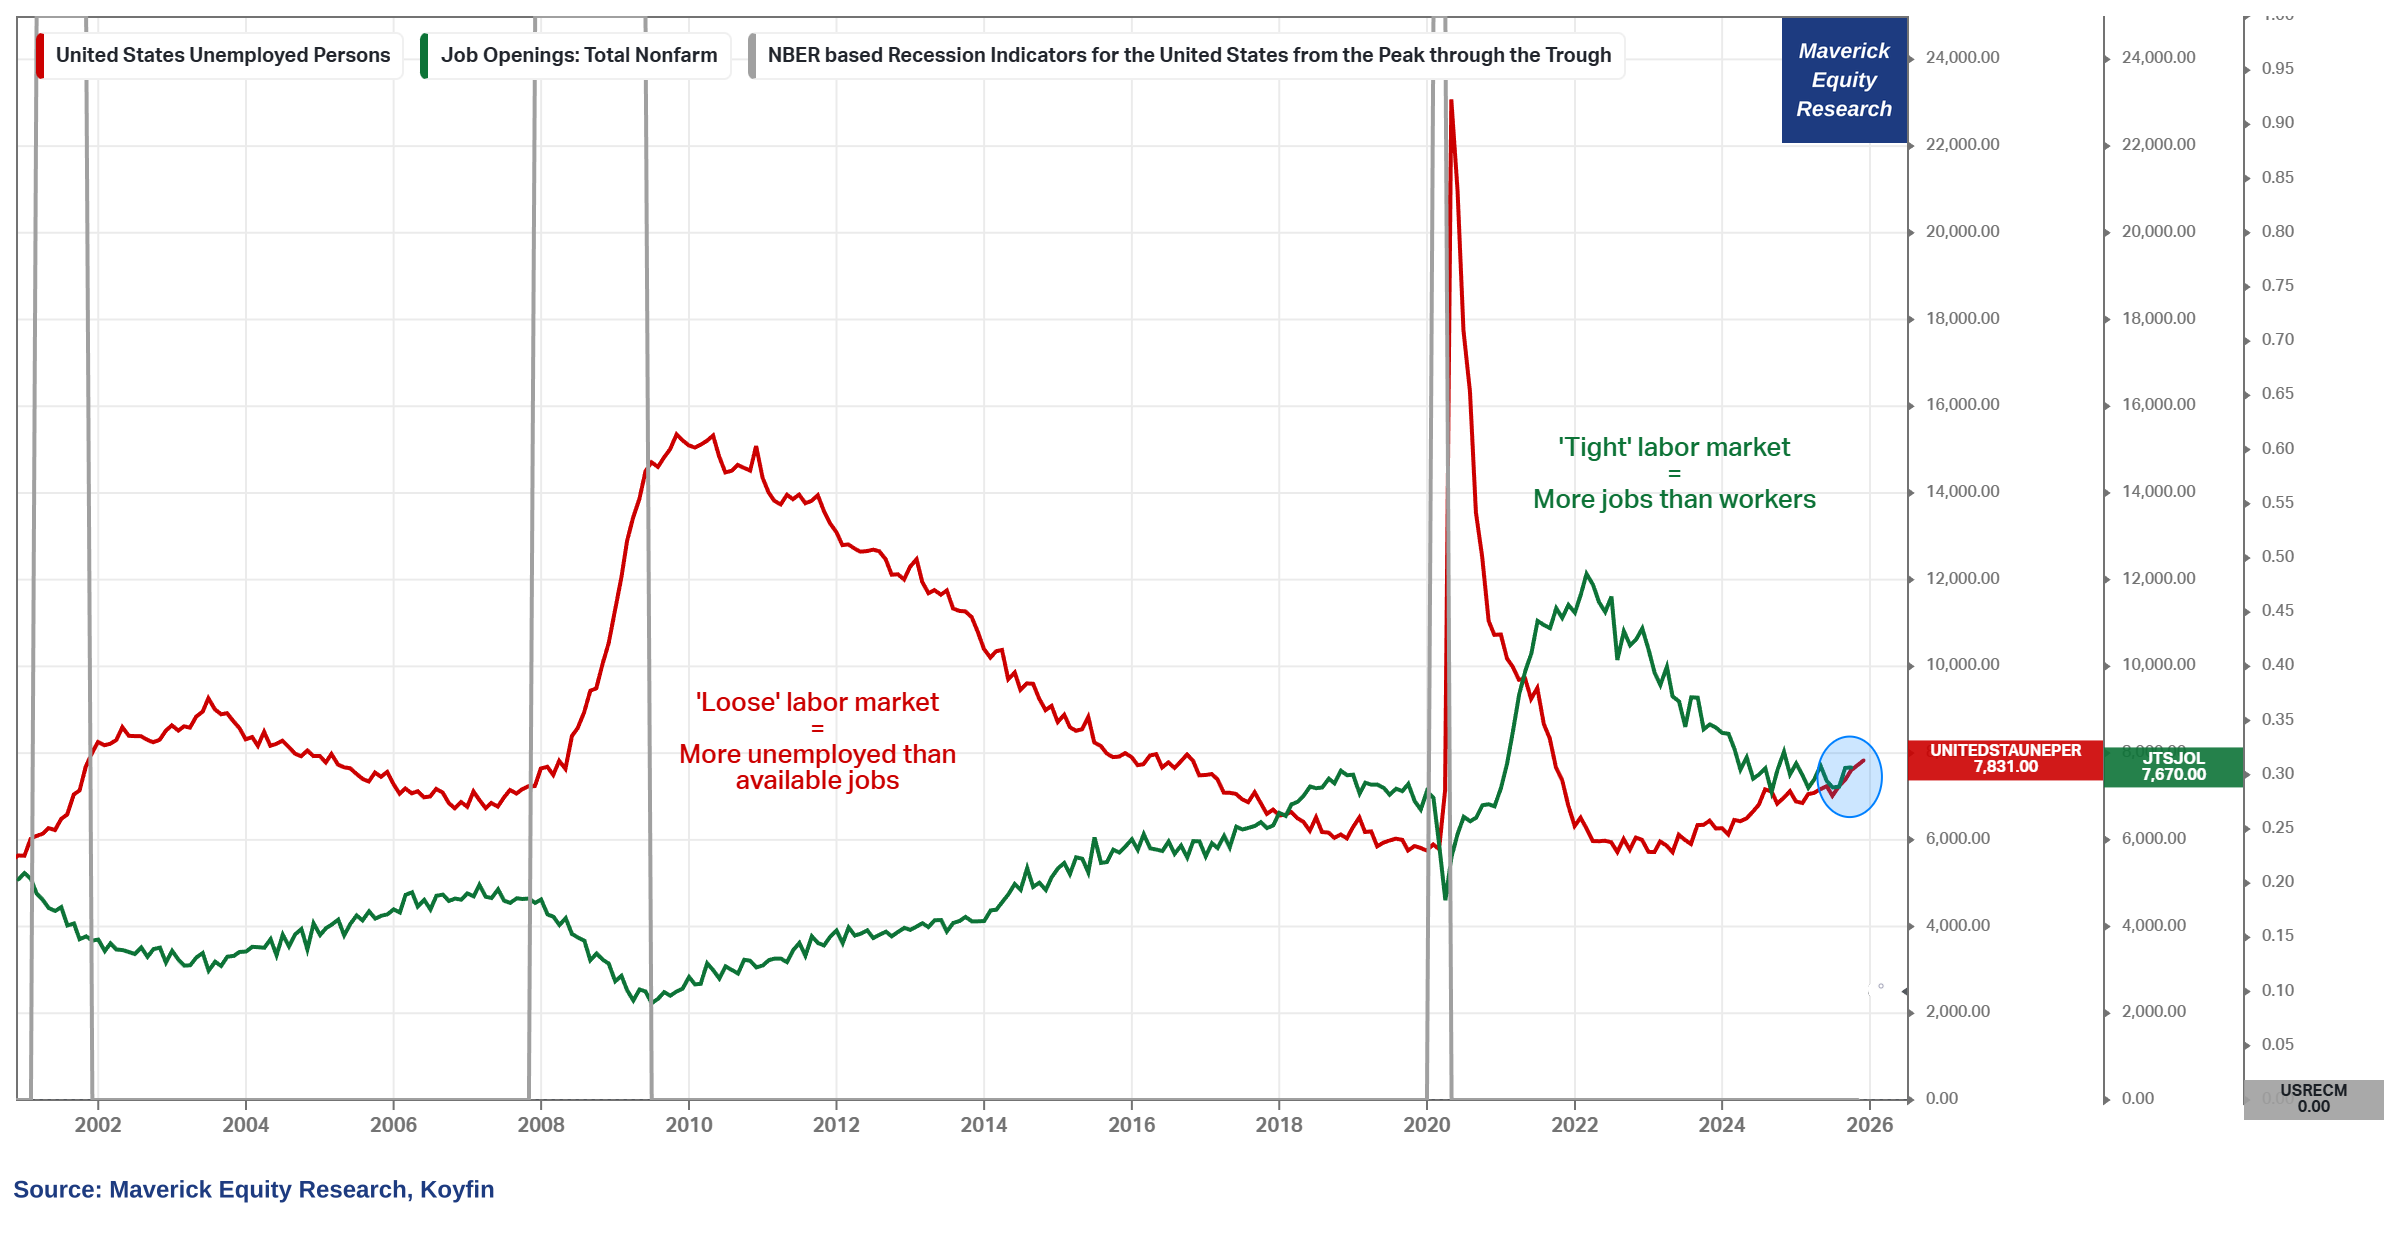
Labor Market not tight anymore — Job Openings VS Unemployed People:
👉 more Unemployed People (red) than Job Openings (green) = quite a contrast since the 2021-2022 job hiring and stock market mania
👉 7.670 million job openings VS 7.831 million unemployed people = as a ratio that is 0.98 from a crazy 2.02 back in 2022
👉 not an ‘employees market’ anymore will likely push down Wage Growth (which is still quite good) which would lower Consumption, but on the other side it will help with inflation (Wage Growth is a “sticky” inflation variable), hence lower interest rates
N.B. Unemployed People and Job Openings ‘matrix’ is a nice monthly visual overview, while I will go deeper with other metrics for more insights & timeliness — until then, as a preview: the labor market is not too tight nor too hot, quite balanced overall
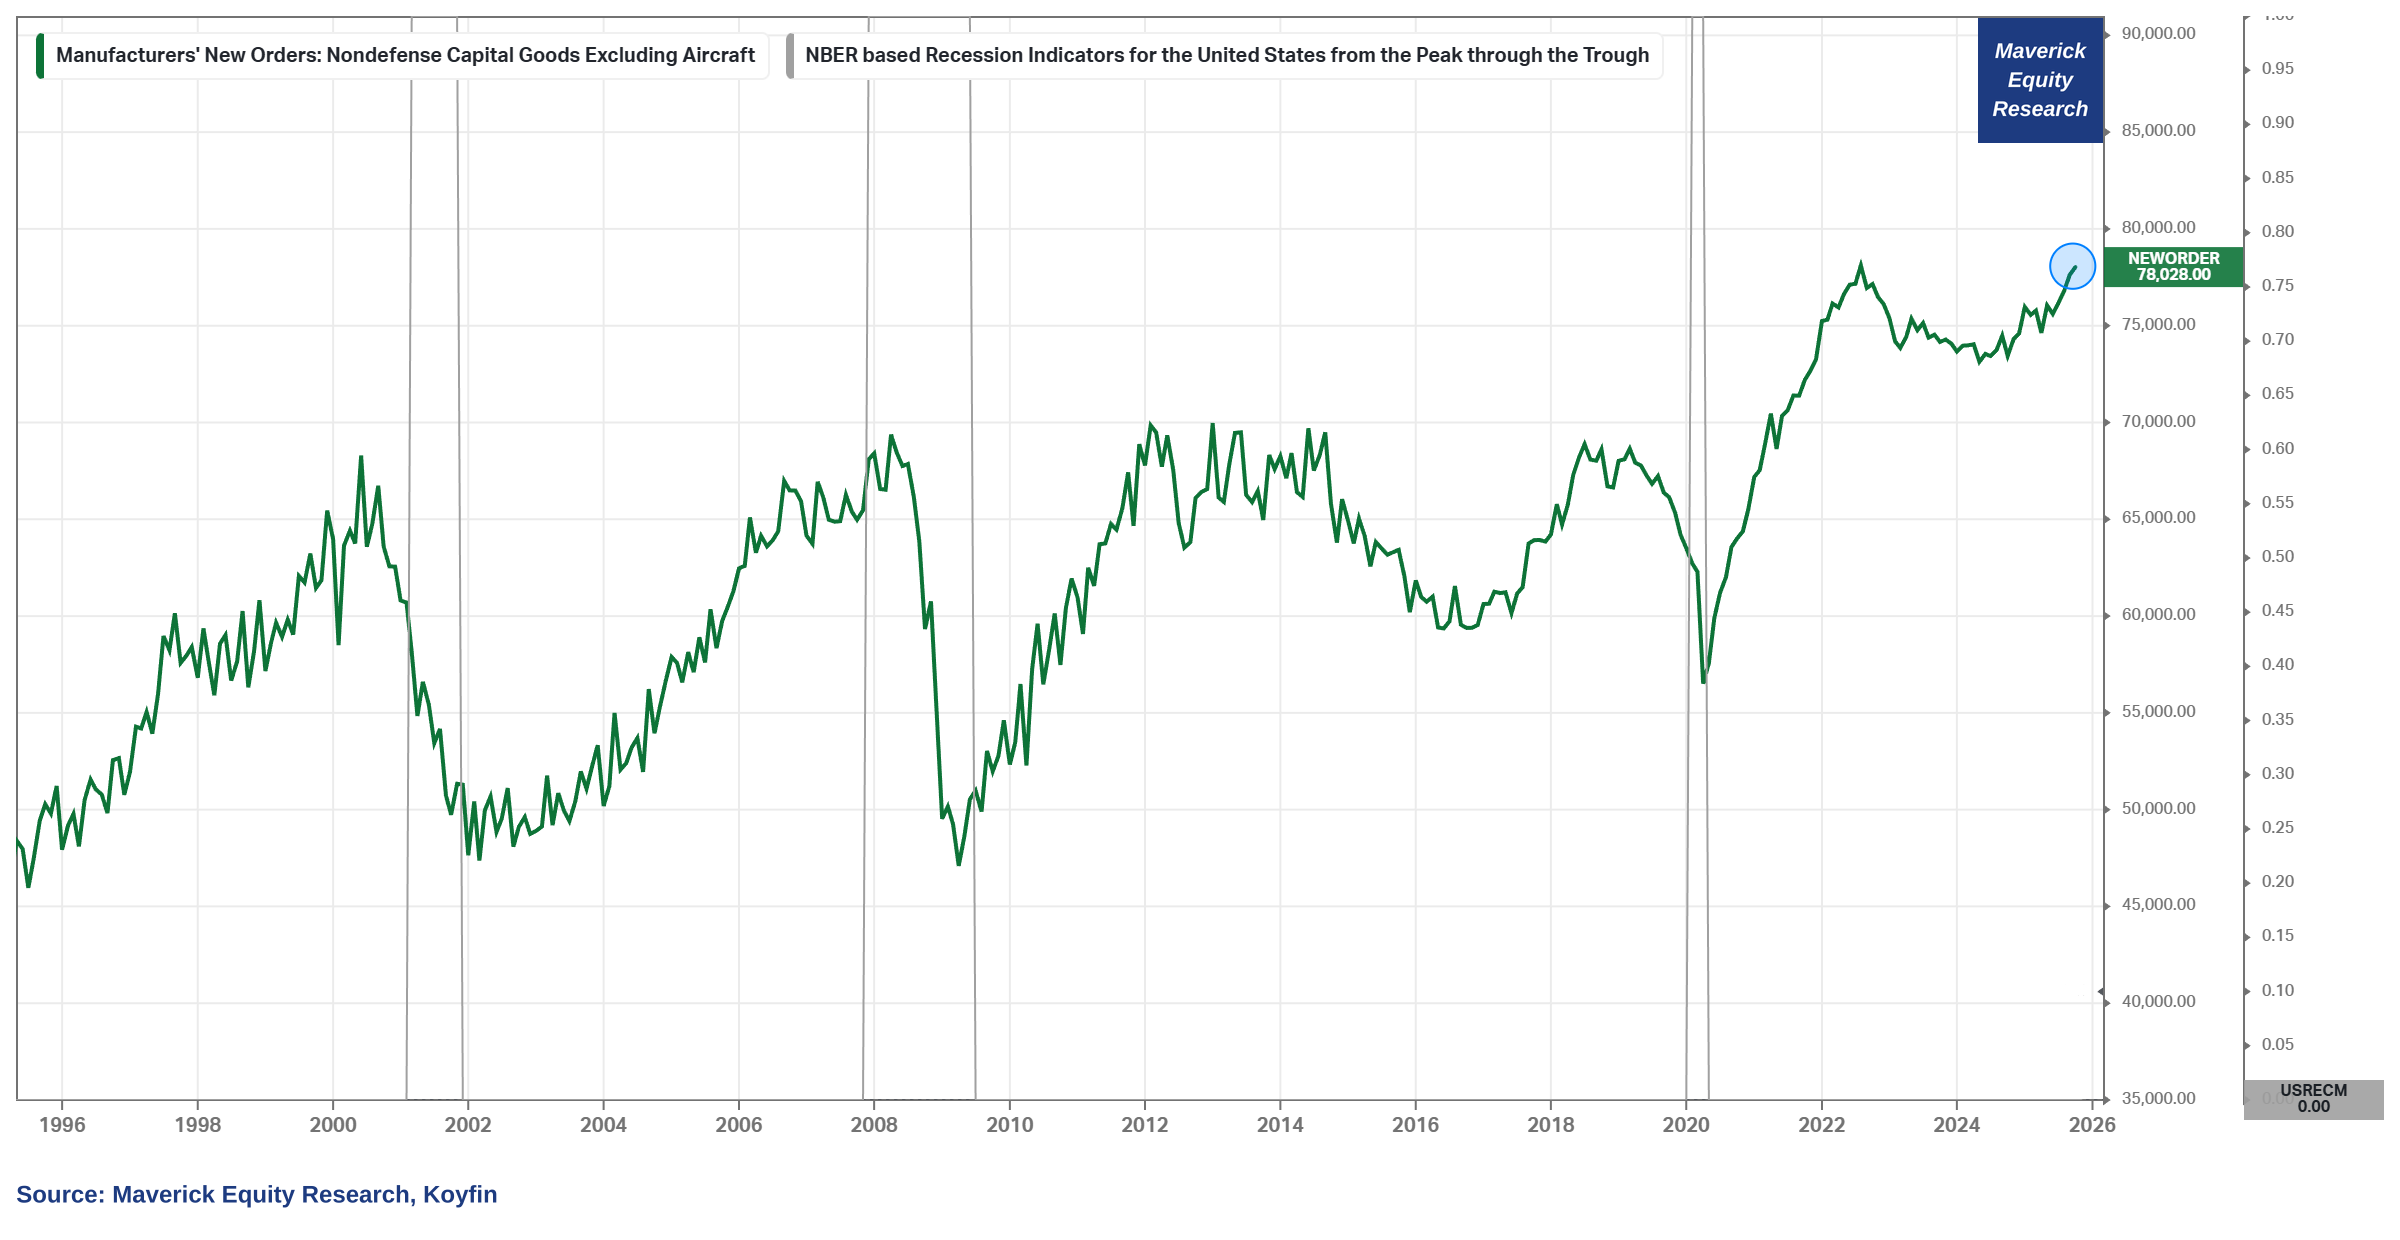
A special one now: Business Investment Activity aka ‘core CAPEX’ — it is UP!
👉 New Orders for Non-Defense Capital Goods (excluding aircraft) with a very sharp rebound since the 2020 pandemic, and currently at a high level of $78 billion (also known as ‘core CAPEX’ or simply put ‘Business Investment’ so that you can connect the dots and/or do not get confused with other research or media reports)
👉 while it did slow down a bit in the 2022 economic slowdown and bear market, a very solid rebound since 2024, hence signalling a positive outlook and economic strength in the months to come
The main message behind this indicator:
👉 it reflects very broad trends in Business Investment and Private Sector confidence, both very important for the investment-production-consumption loop
👉 the key insight = purely focused on orders for long-lasting business equipment, and removing large fluctuations from defense and commercial aircraft orders
👉 Core CAPEX is regarded as a key factor driving the economy and one of the leading indictors of Business Activity or Business CAPEX
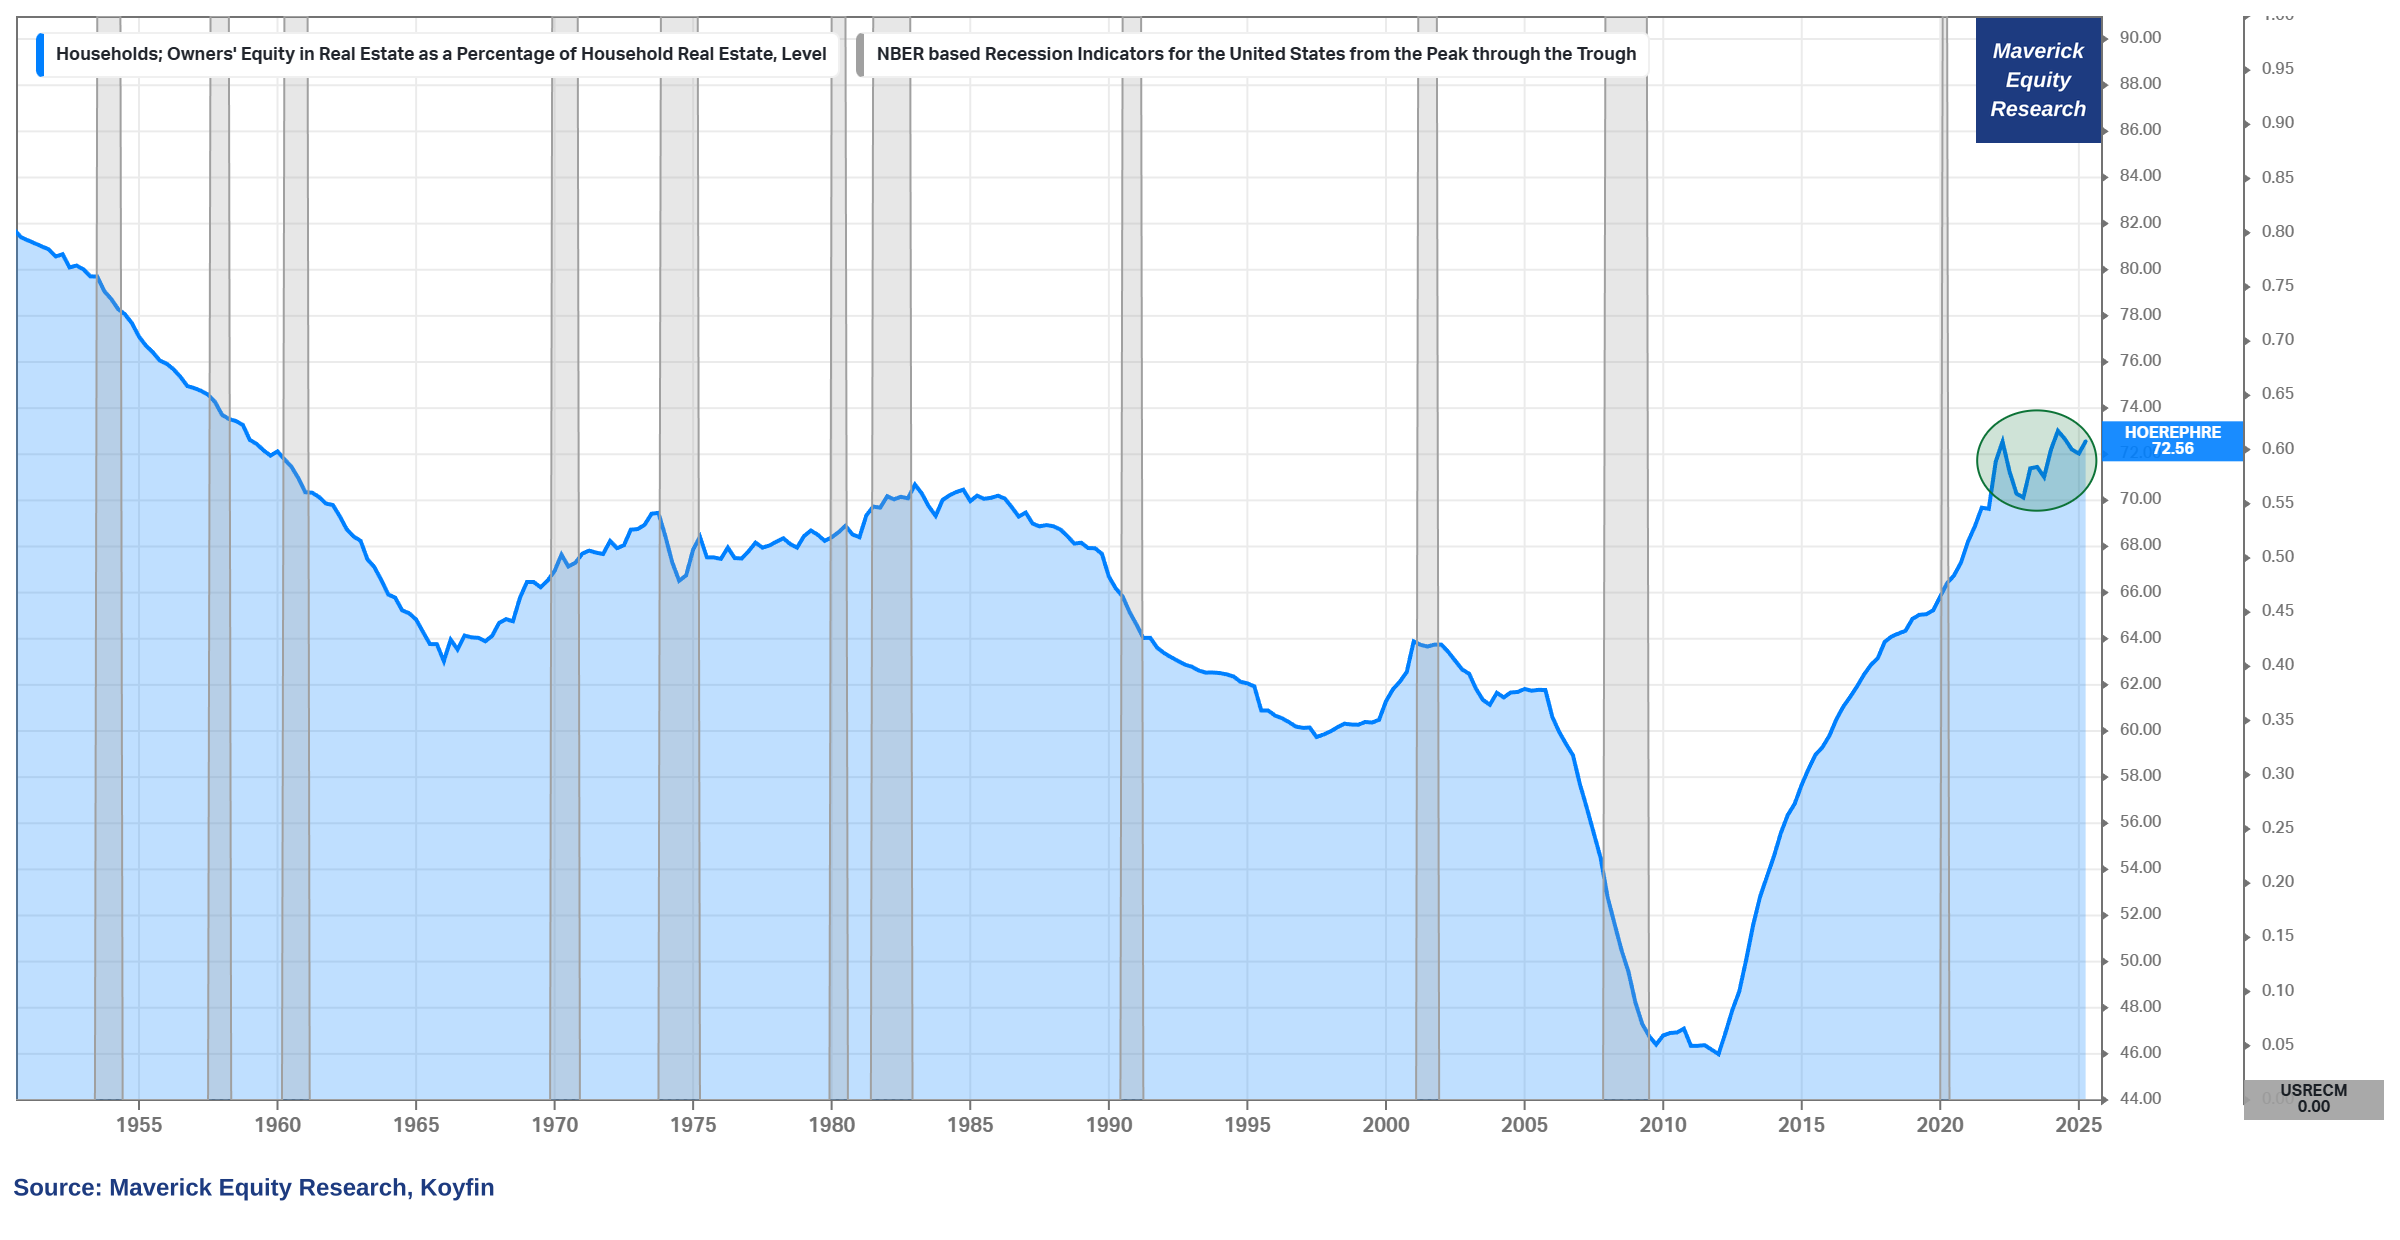
What about Housing & the mighty Consumer? Well connected & stable? For that we look at the Home Equity values compared to the Total Value of Household Real Estate:
👉 Owners’ Equity in Real Estate as a % of Household Real Estate, solid at 72.56%
👉 the longest continuous stretch above 70% since the late 1950s, hence, we have the strongest Consumer-Housing Balance Sheet in 70 years
👉 “But what about affordability for new homeowners Mav?” Well, yes, it is low, but that is another story, and in general, at any given point, it won’t be good for everybody
Maverick’s net takeaway:
1) Housing will NOT take DOWN the Economy which I hear quite a lot these days
2) Owners’ equity in their homes is important via the ‘wealth effect’ which is real: higher confidence, invest more into stocks, higher consumption patterns, HELOC loans etc. In general, Real Estate is a big part of the economy and with its many facets it is quite complex. Commercial Real Estate (CRE) has some issues, and I will offer more dedicated insights in the future.
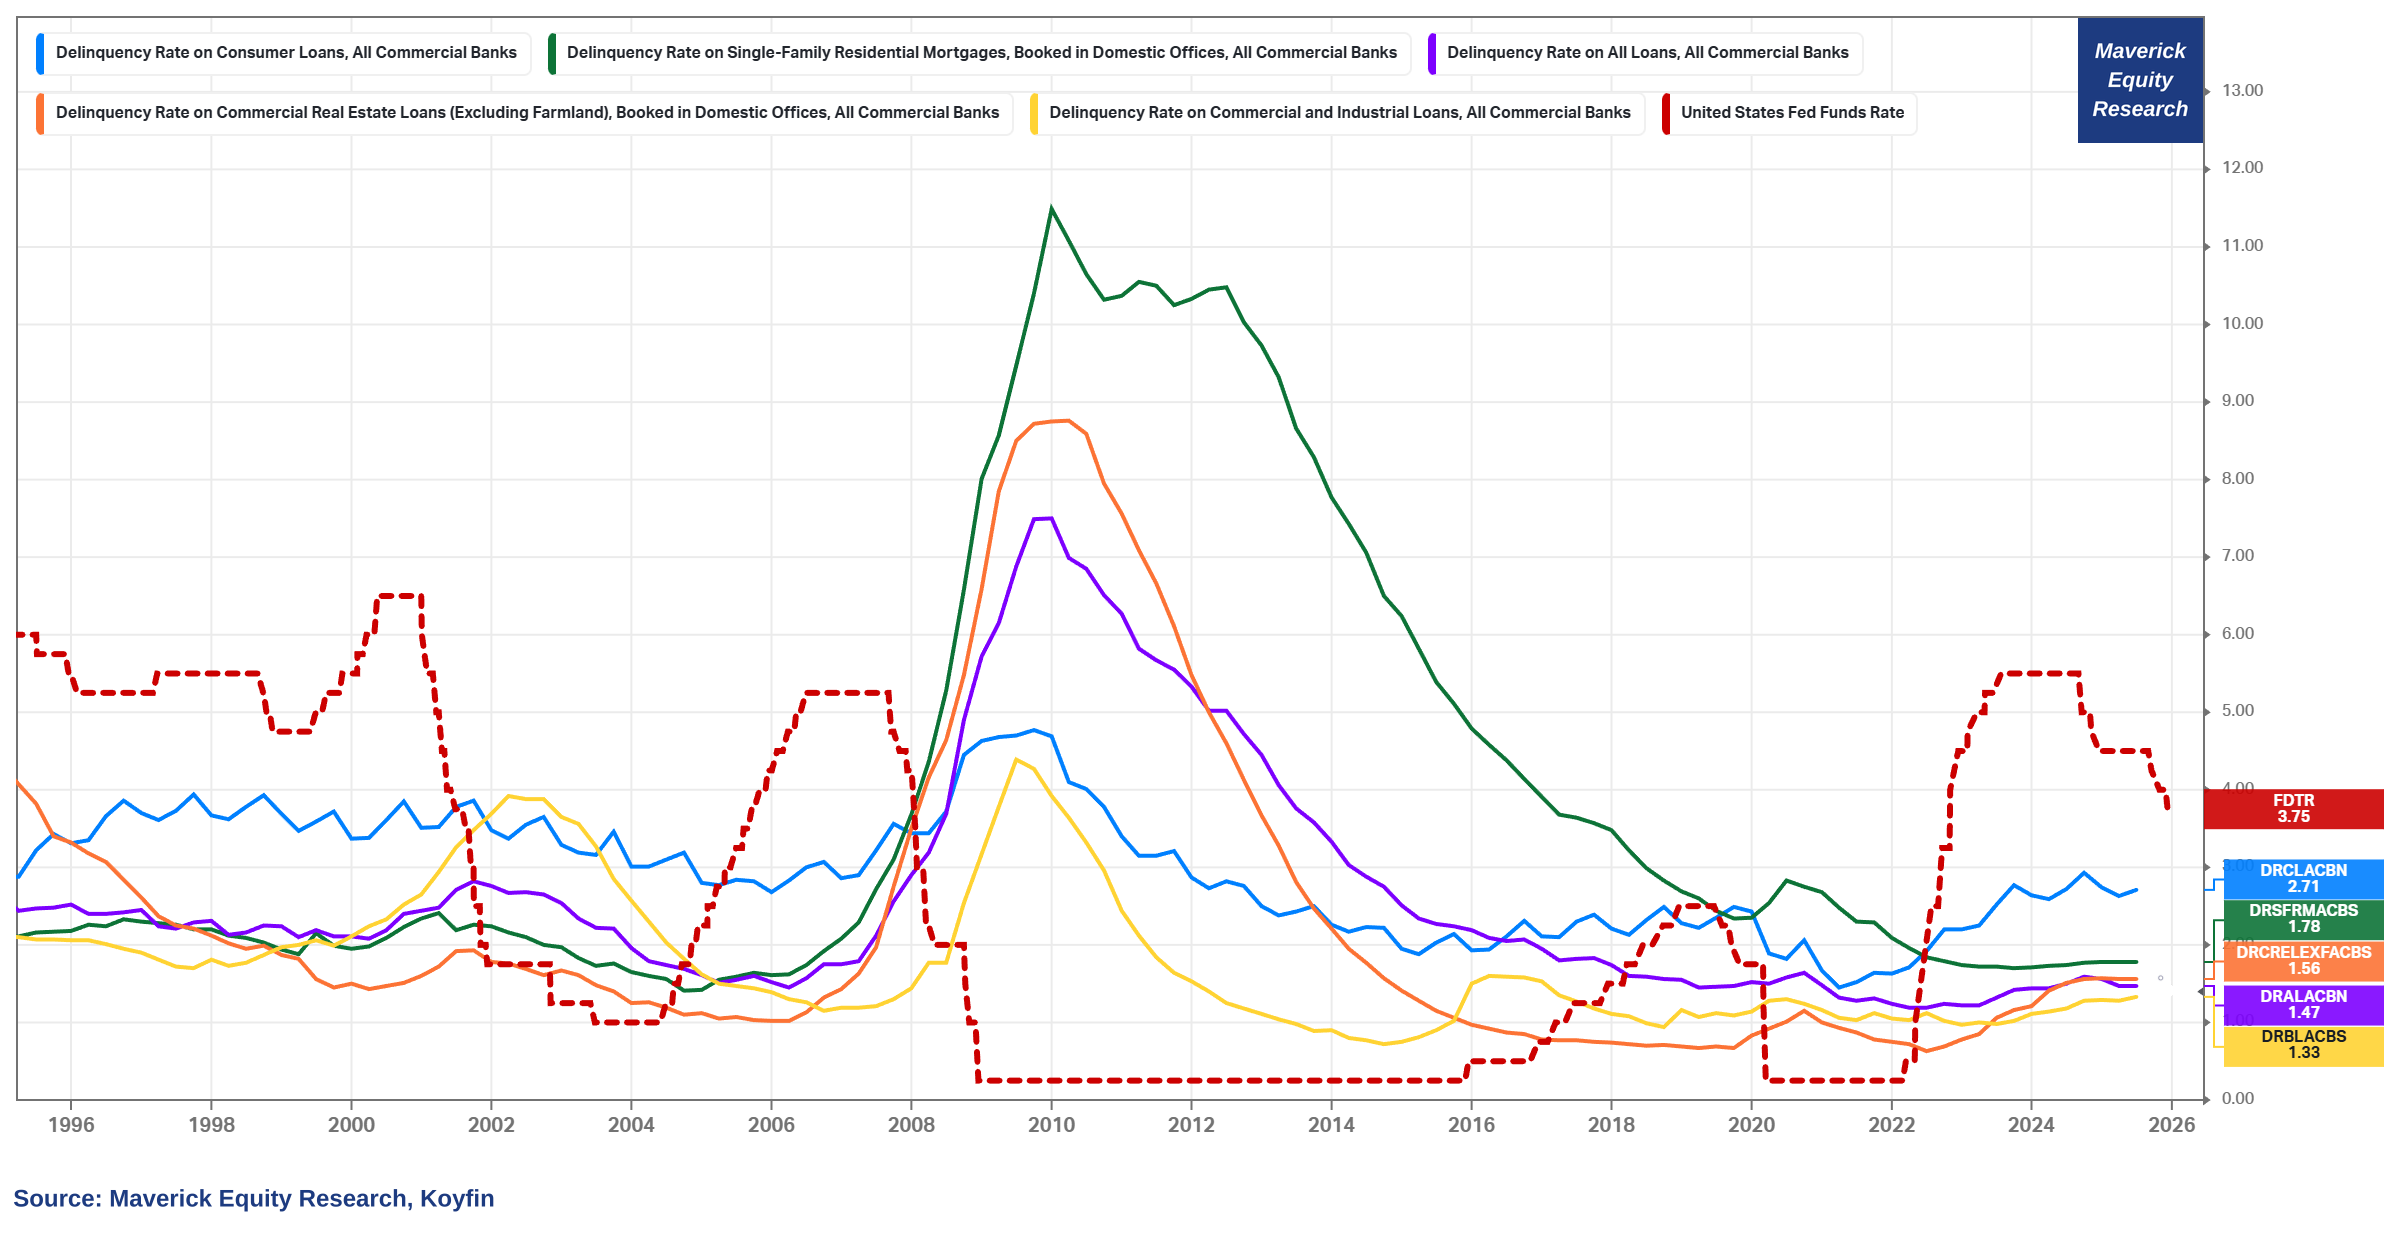
How are Delinquency Rates doing for payment on loans? Overview loan types:
👉 with higher interest rates given the 2021 inflation spike, higher overall
👉 yet not at worrying levels for now, and dropping rates act as more cushion
👉 nonetheless, to be monitored in 2026 …
All this will be covered in 2026 through my quarterly deep dive into the U.S Economy:
✍️ The State of the U.S. Economy in 75 Charts
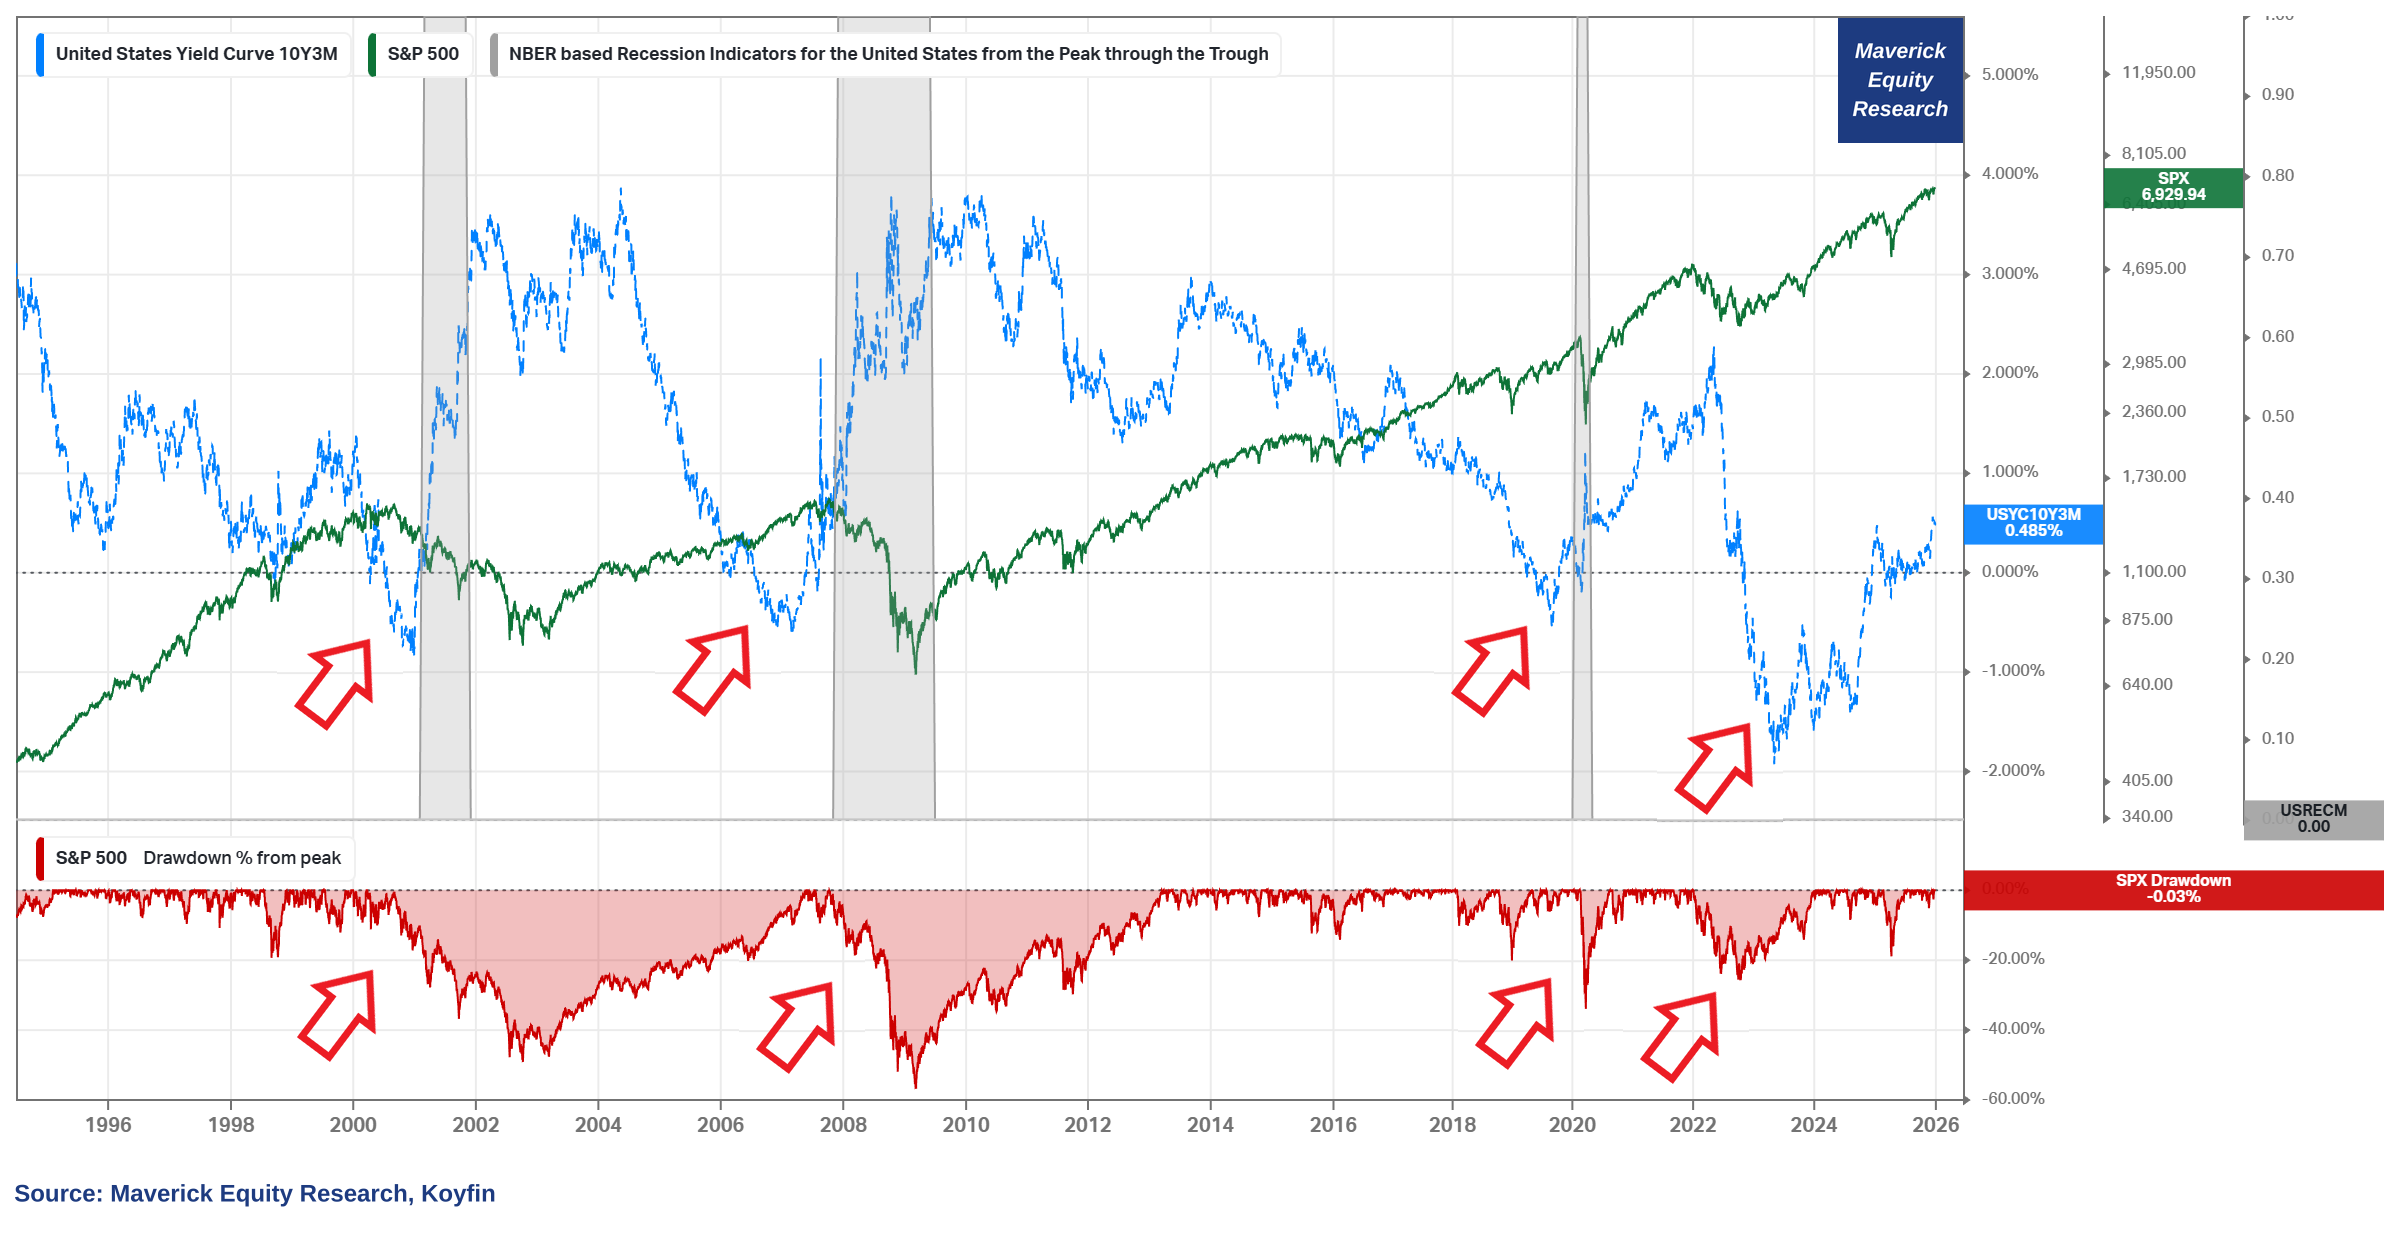
U.S. Yield Curve (YC): “mighty curvy curve, what are you telling us?” I ask because you are connecting monetary policy, the bond market, with the economy overall and the stock market via the S&P 500 = Macro-Finance!
Yield Curve 10Y-3M (blue) = 0.485% again positive, and un-inverting strongly in 2025! Chart = last 30 years of YC inversions/un-inversions (blue), recession periods (grey), S&P 500 price (green) and S&P 500 drawdowns (red) — all for the famous markets/economics mantra ‘Is This Time Different?’
👉 2022 recession wise: YC inversions most of the time signals an incoming recession, though most recently it gave us the head fake (false signal) in 2022 as the most anticipated recession never came = ‘It Was Different This Time’
👉 2022: stock market wise: though the signal was still partly valid also for the 2022 bear market as the YC was falling fast and became inverted = ‘It Was Not (That) Different This Time Either’
Maverick takeaways:
👉 Recessions wise:
YC inversions are to be watched for likely incoming tough periods
note that the exact inversion points are not the real/true signal for an incoming recession, but it’s the un-inversion period coming right after — in other words, it is the steepening post un-inversion that is when things start to happen
given that the YC is positive again and un-inversion is happening now, technically the YC could still foresee a recession should it go higher / steepen
on the other side, this inversion & un-inversion has been going on for +3 years which is very atypical — in any case, the current steepening is to be watched!
👉 Stock Bear Markets wise:
just like Maverick in Top Gun going inverted, it very likely DOES show us the birdie, hence the incoming bear market - fair & nice guy, no? 😉
each of the past 4 big bear markets since 1995 were preceded by YC inversions or they happened as the YC was dropping fast towards inversion (being negative)
Hence, the Yield Curve is still to be watched both for the economy & stock market!
N.B. there is for sure a lot more about the Yield Curve special topic:
more yield curve types, context, nuances, other variables, hence still judgement calls to be made on a case by case (regime by regime) basis
that is why in 2026 I will also do a Maverick Special dedicated report covering: longer history, more key stats, more intricacies, more insights and takeaways
✍️ Yield Curves, Recessions and Bear Markets = a Deep Dive! Maverick Special
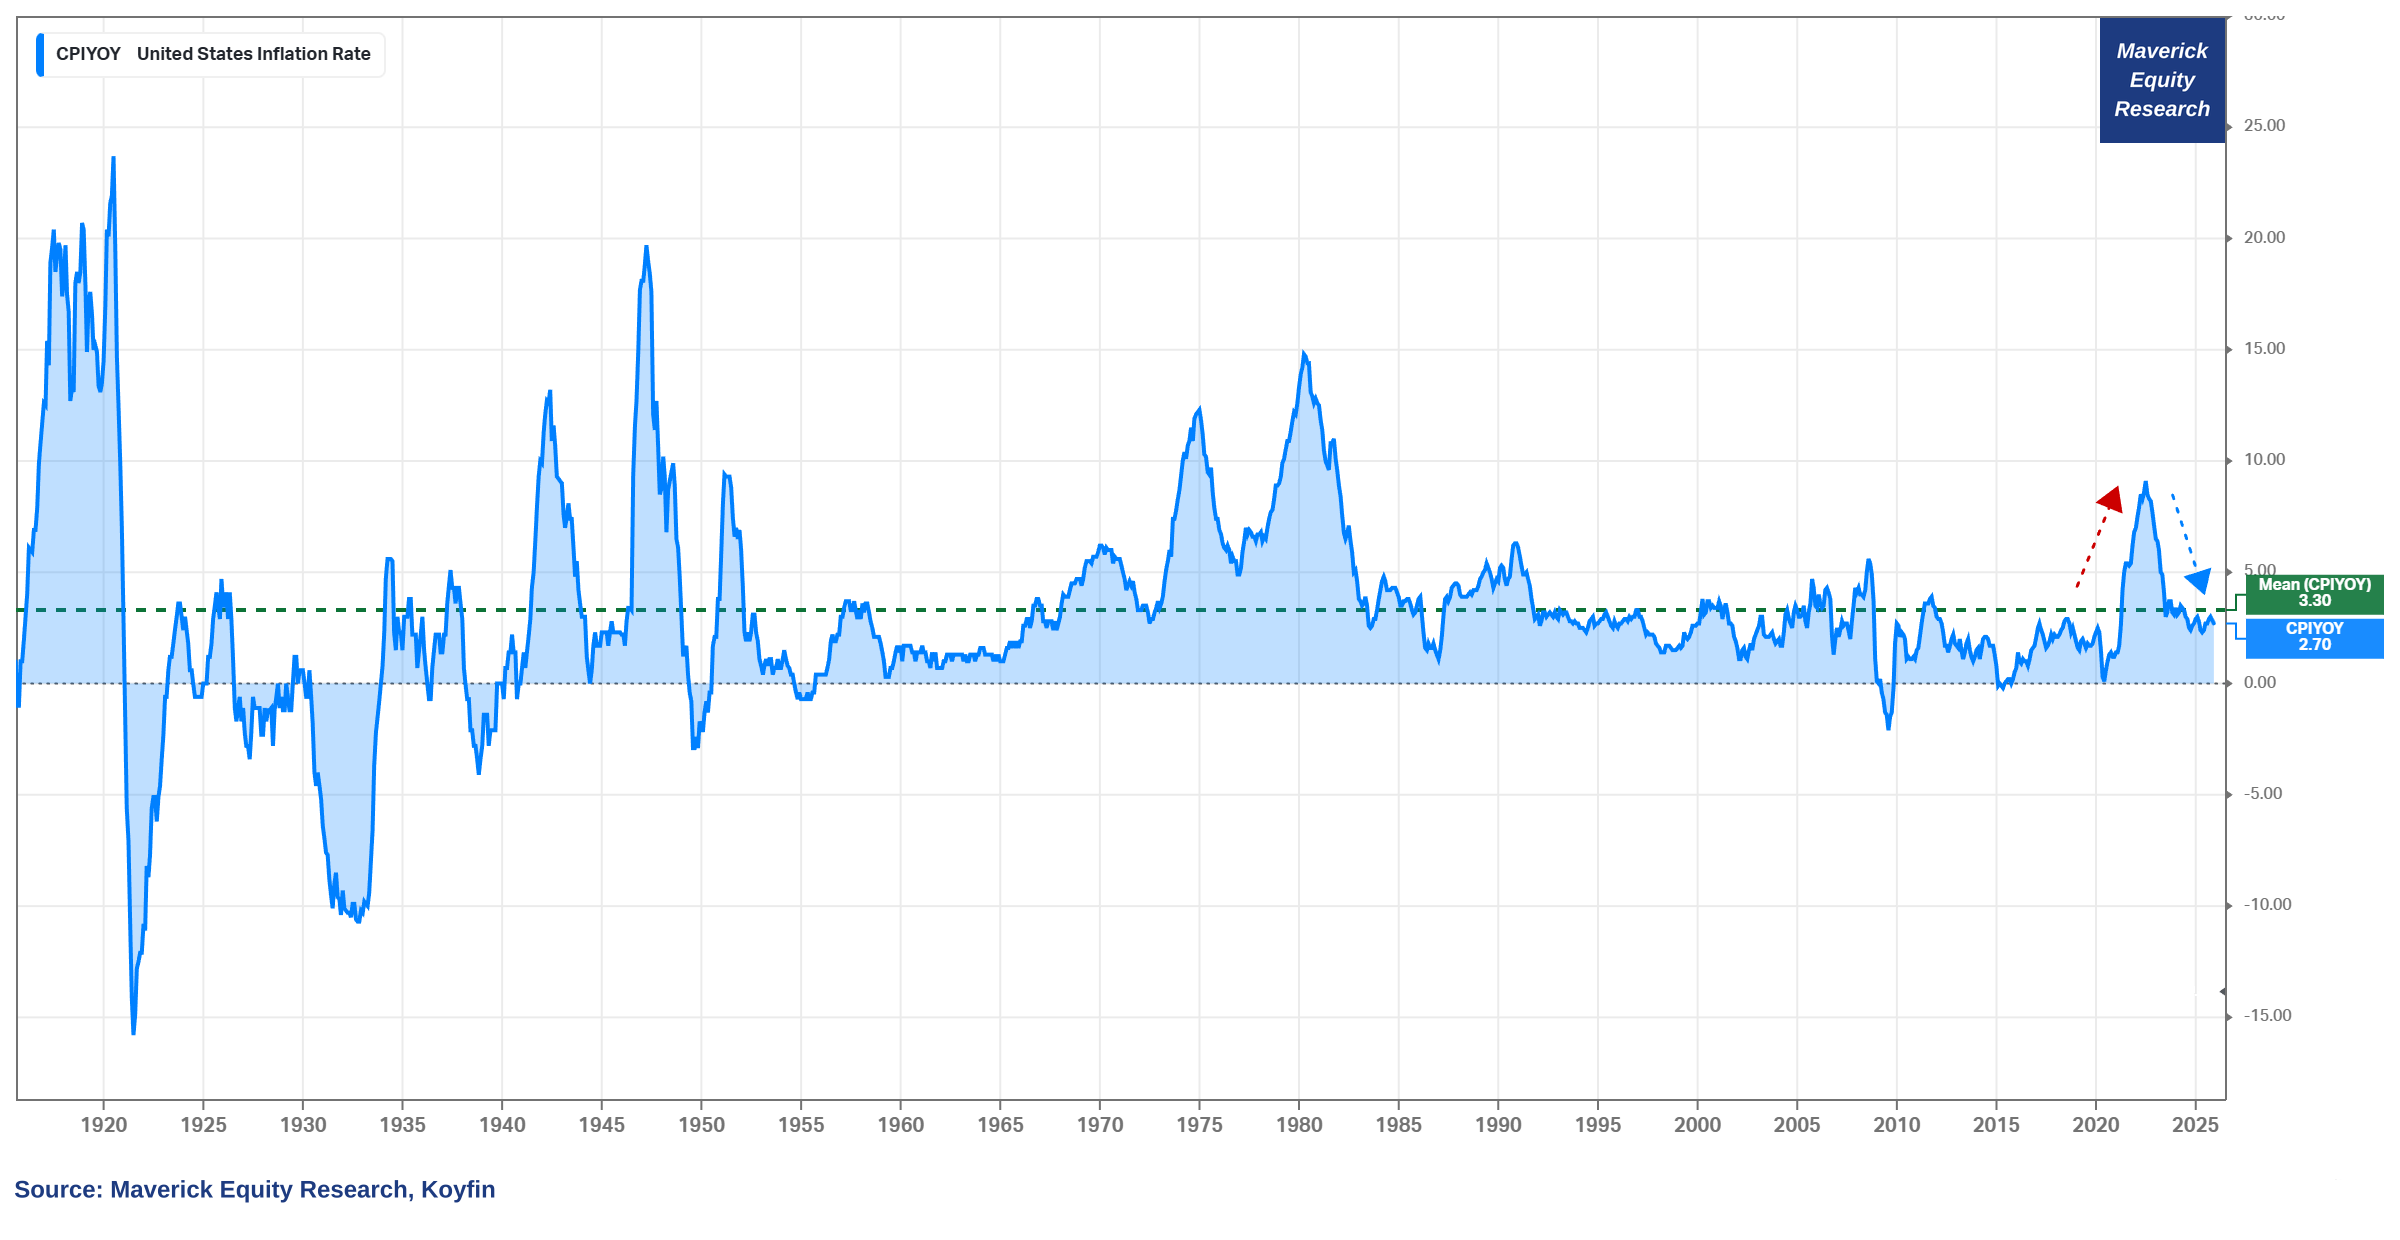
Inflation, the hot topic of the last years, what is going on there? A Maverick chart with 110 years of Inflation rate (CPI YoY%), a very long series!
👉 2.9% at the start of 2025 with 2.7% to finish, below the 3.3% long-term average
👉 therefore, with further stabilisation closer to the targeted 2%
👉 inflation chatter is that the FED should change to target closer to 3%, hence if you ask me, if that happens, based on this very long historical average, we should not be that surprised and that big of a deal
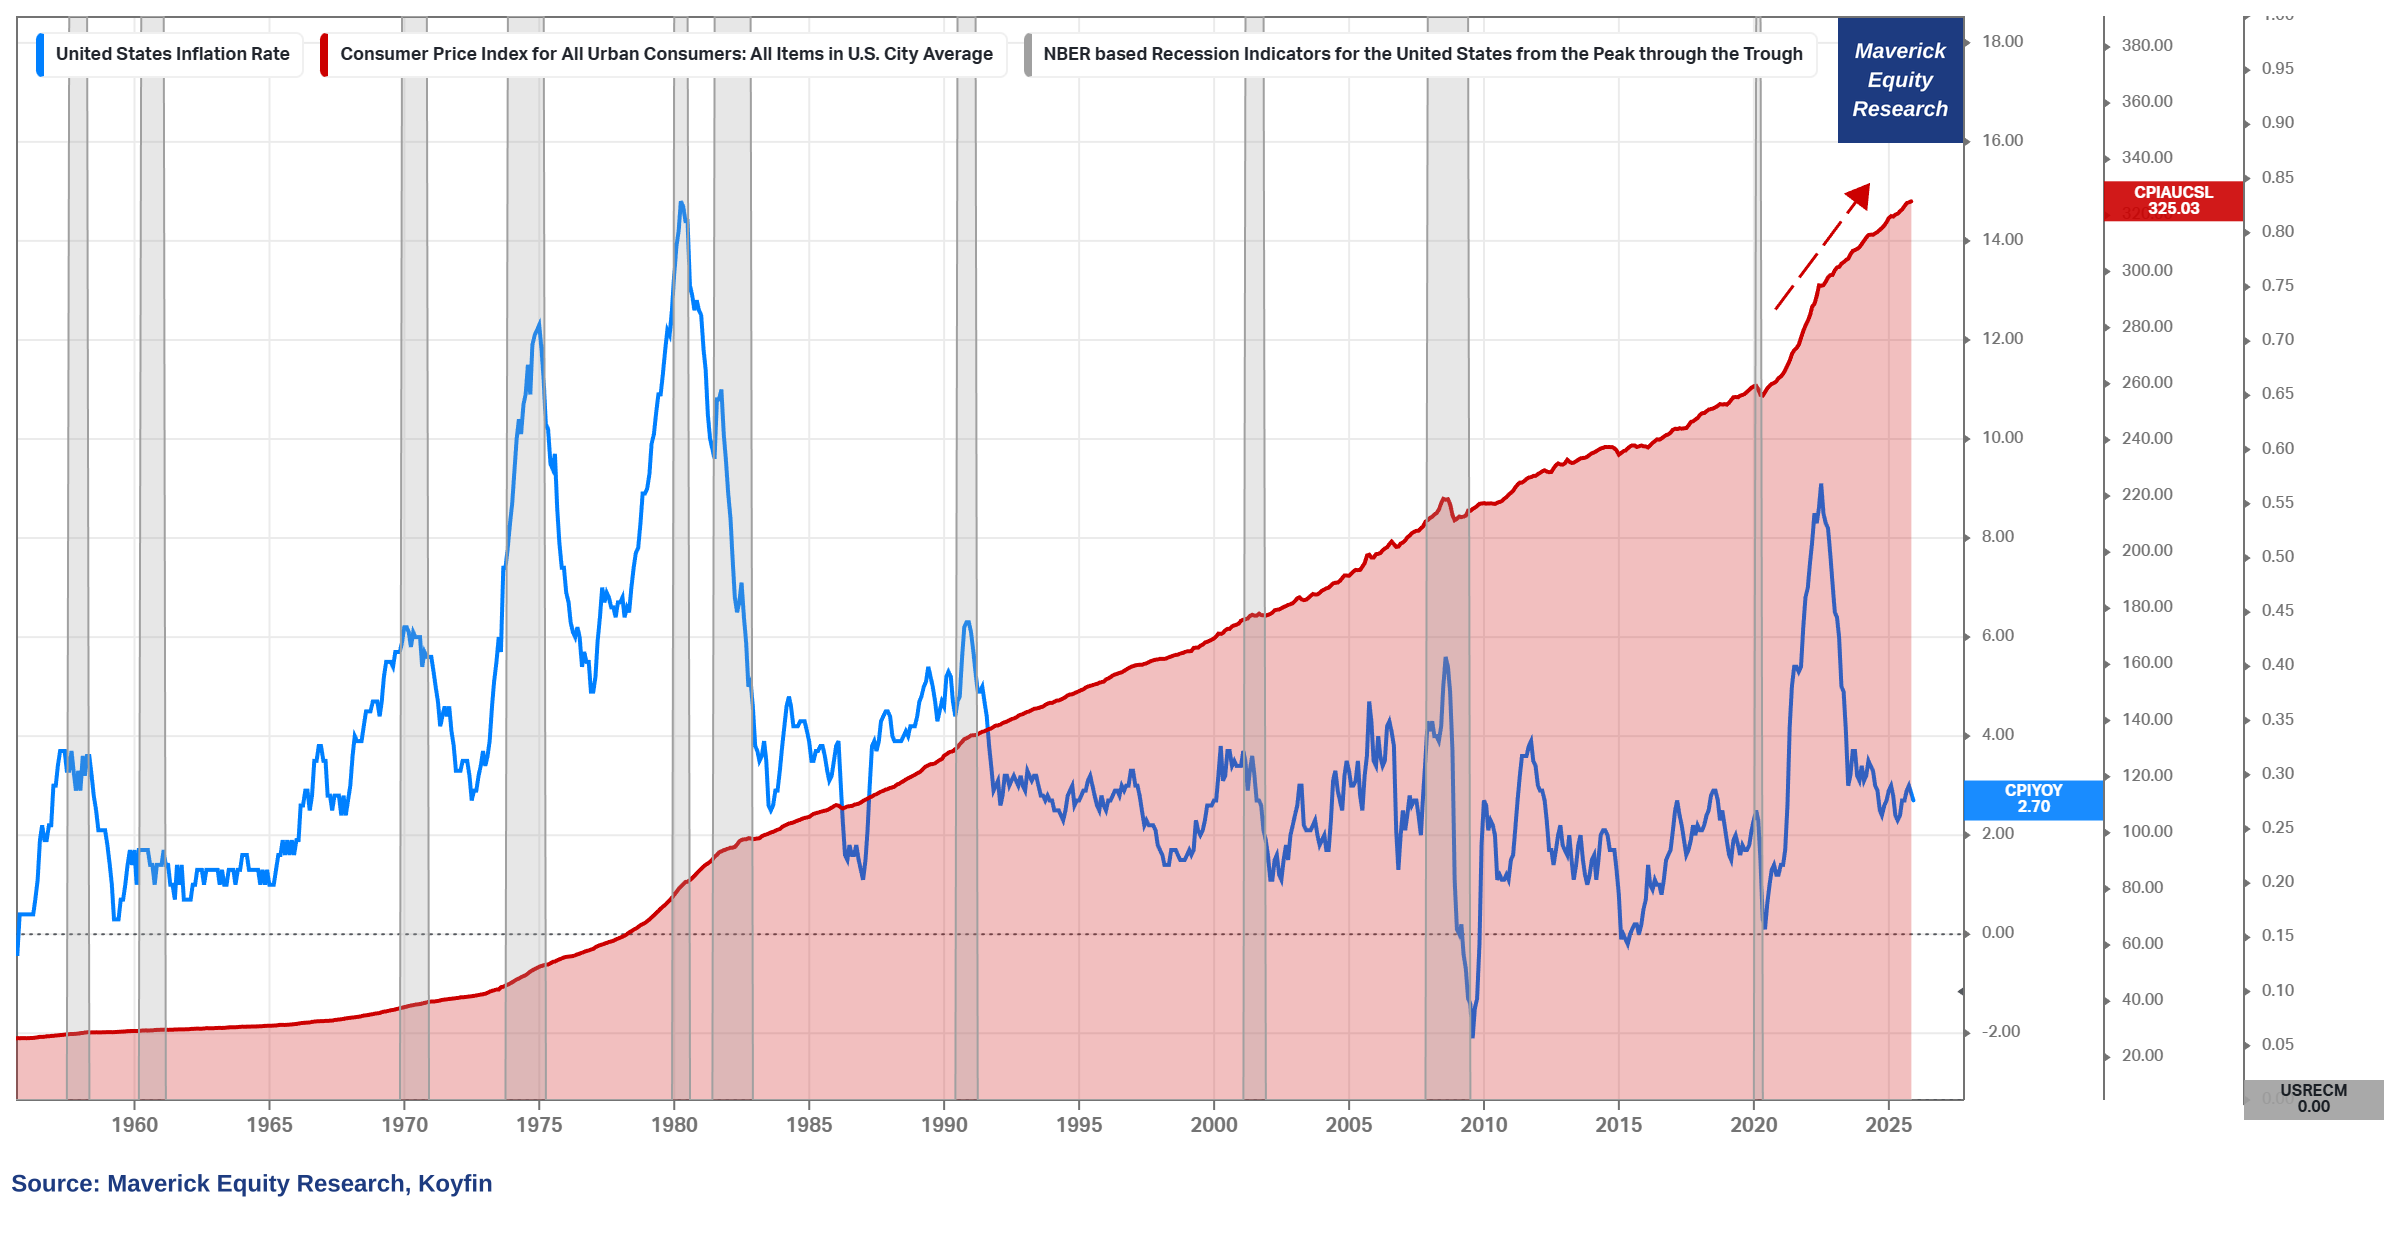
Inflation Growth vs Level = Wall-Street inflation vs Main-Street inflation visualised! CPI growth (YoY %, blue) and CPI Consumer Price Index level (red):
👉 for the Level of inflation to go Down, we would need a Negative Growth Rate, hence we would need to have deflation (trust me, that is something not too many people really want, or well, they should not want …)
👉 once we get inflation spikes and we are at new higher levels, hence even when the inflation growth rate finally slows down and stabilises, the level/base is and feels to be way higher — it is not ‘linear’ and ‘smooth’ as before the high inflation period!
👉 one cay say, the Level/Base = how most People see and feel inflation, while the Growth rate = how Economists see inflation
Inflation is a very complex phenomenon, hence besides the current growth rate and level with a historical perspective, what about the ins & outs, and most importantly, what about pricing + forward looking metrics and indicators?
All that requires naturally a deeper dive, and most of all, practical implications: myths about inflation, which measures to track, which ones are the best and most reliable, and an outlook for the short term, and as well for the medium-long term.
Hence, I will do a 2-part Maverick Special Report (Macro-Equities lens) covering:
✍️ Inflation - Nuts & Bolts, Ins & Outs!
+ by far the most favorite & requested:
✍️ Inflation: Pricing, Expectations & Leading Indicators!
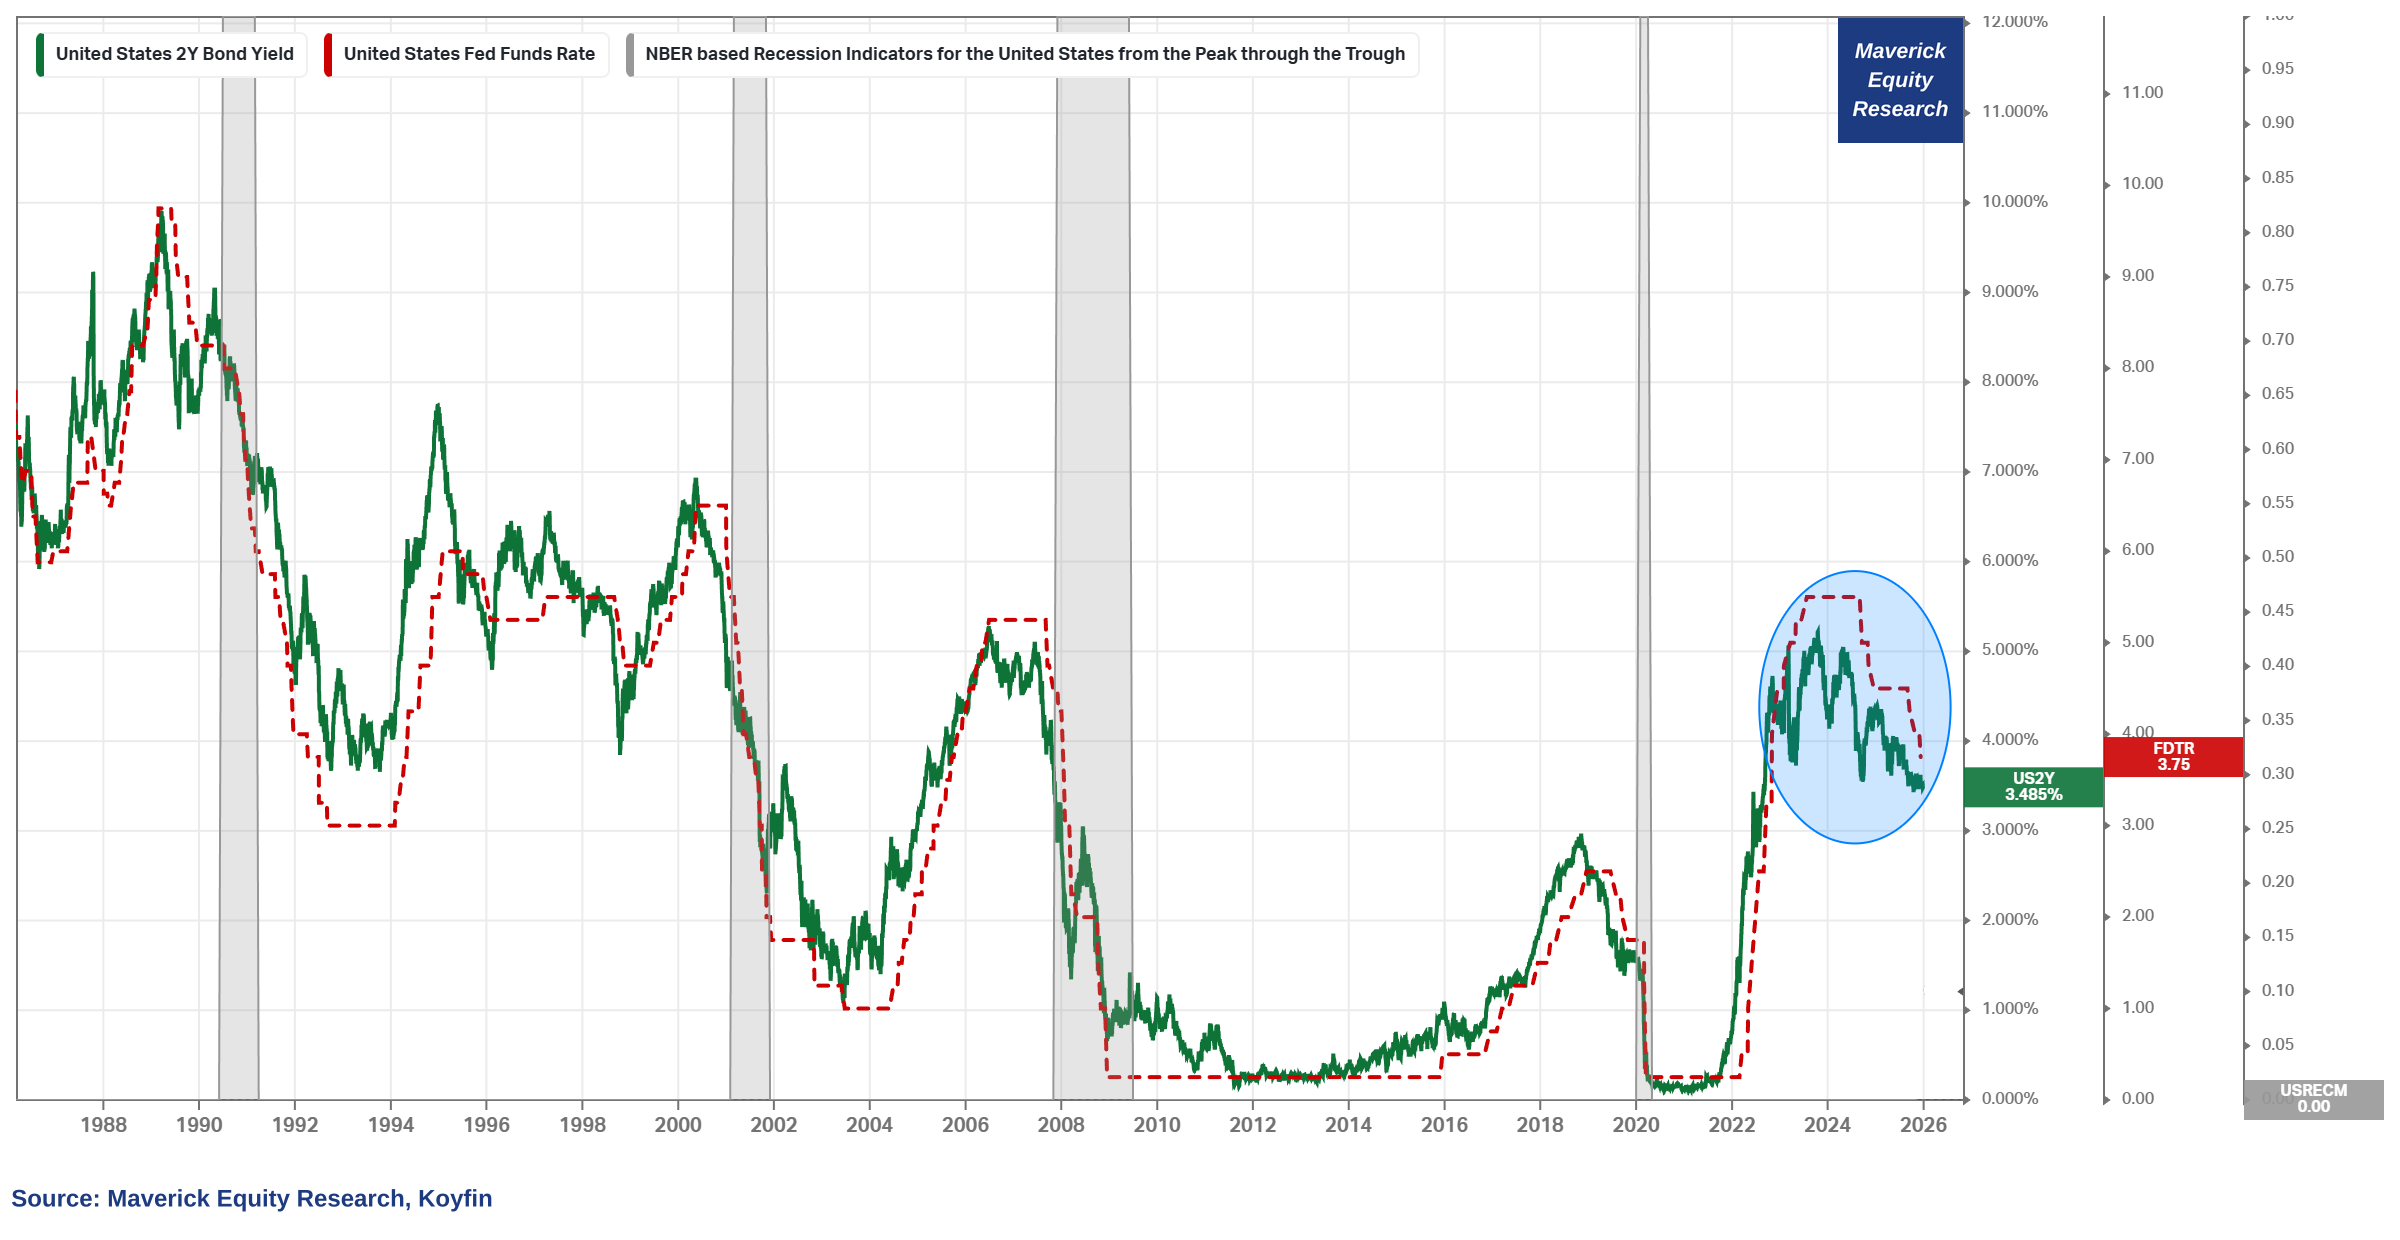
Interest Rates — Fed Funds Rate & 2-year Treasury Yield:
👉 FED lowered rates 3 times in 2025, and is now in the range of 3.50% to 3.75%
👉 FED signaled a more cautious approach to further easing in 2026, yet the direction and current pricing is for LOWER rates
👉 therefore, with that expect lower Fed Funds Rate and 2-year treasury yields also!
👉 while AI was the big headliner for the big stock market rally, not many told you that a material factor are the falling interest rates = lower discount rates/cost of capital
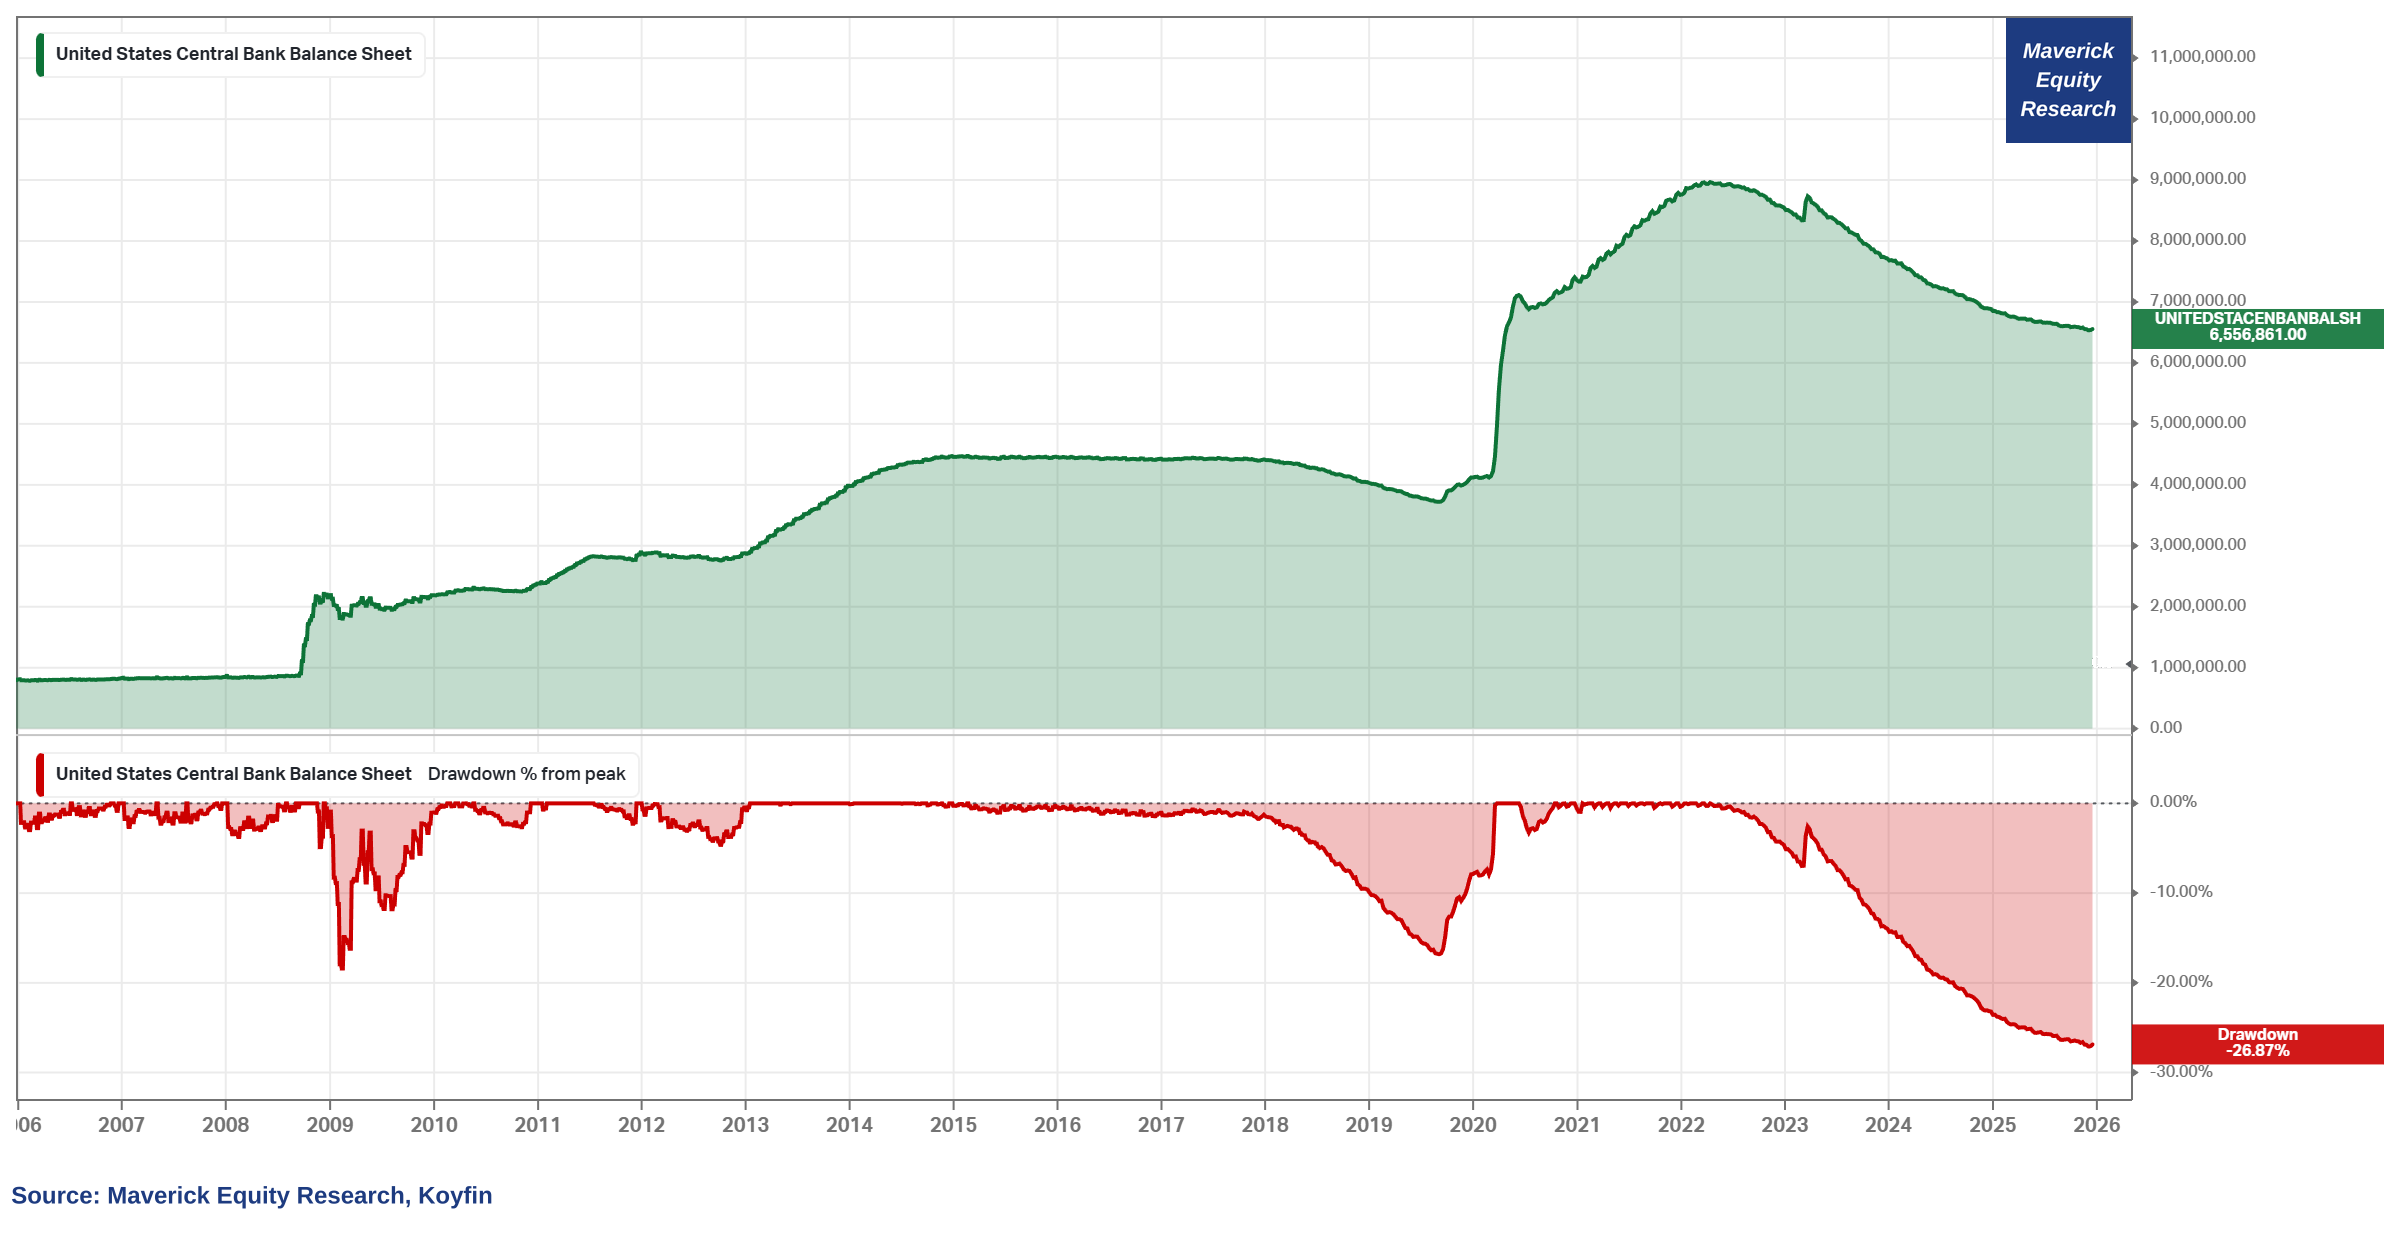
FED Balance Sheet:
👉 a big 26.87% balance sheet reduction since 2022 all-time high, yet note the very small yet important uptick in December — what happened?
👉 on December 10th, the FED stated they “will initiate purchases of shorter-term Treasury securities as needed to maintain an ample supply of reserves” — remarking that “reserve balances have declined to ample levels”
👉 hence, the balance sheet has expanded in the last 2 successive readings
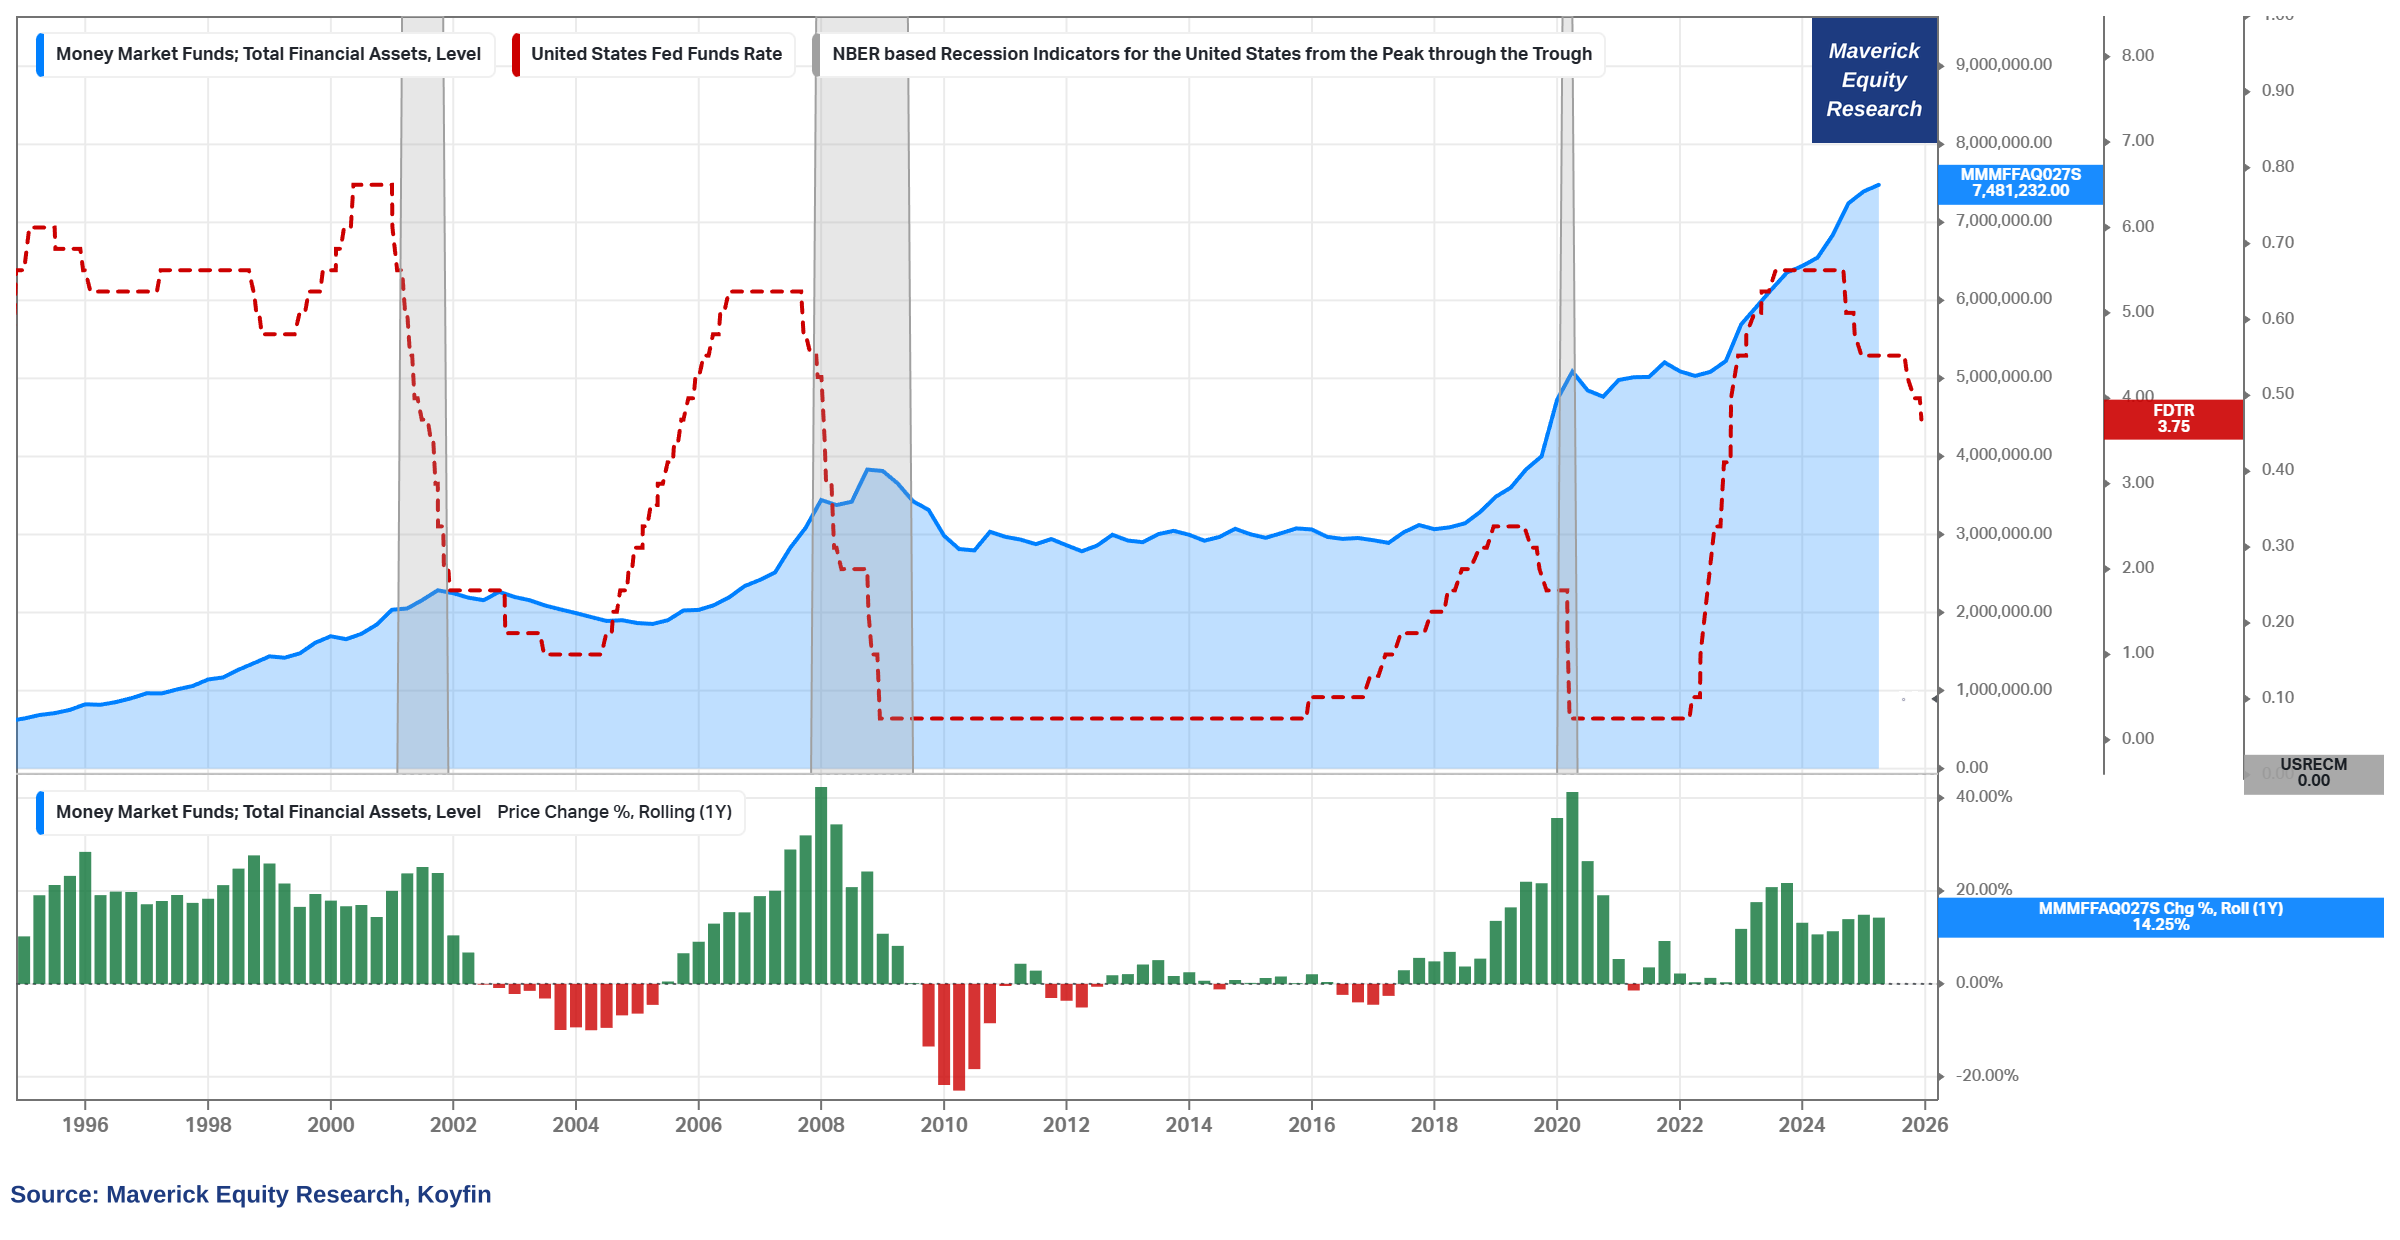
Money Market Funds (MMFs) time!
$7.48 trillion Total Assets (blue) = a record = a very solid potential dry powder
Wordplay: “A Trillion Here, a Trillion There, and Pretty Soon You’re Talking Real Monay!“
👉 with interest rates dropping (red), that super liquid cash equivalent has to go somewhere — some say it is not dry powder for stocks, but if one sells a MMF unit and buys with it stocks, what is it then? Via JPM: “...there is more than $7T in MMFs, suggesting plenty of dry powder to buy stocks especially if we do see the Fed cut rates, dropping the return on MMF assets.”
👉 until then, with high(er) interest rates (red), it is normal for MMFs to increase as the Risk Free rate pays a decent level of interest for the 1st time since 2007, namely pre-GFC/Lehman Brothers (2018 & 2019 was also a brief period with some yield)
👉 note also the price change % rolling 1-year: a very high growth with 14.25% now
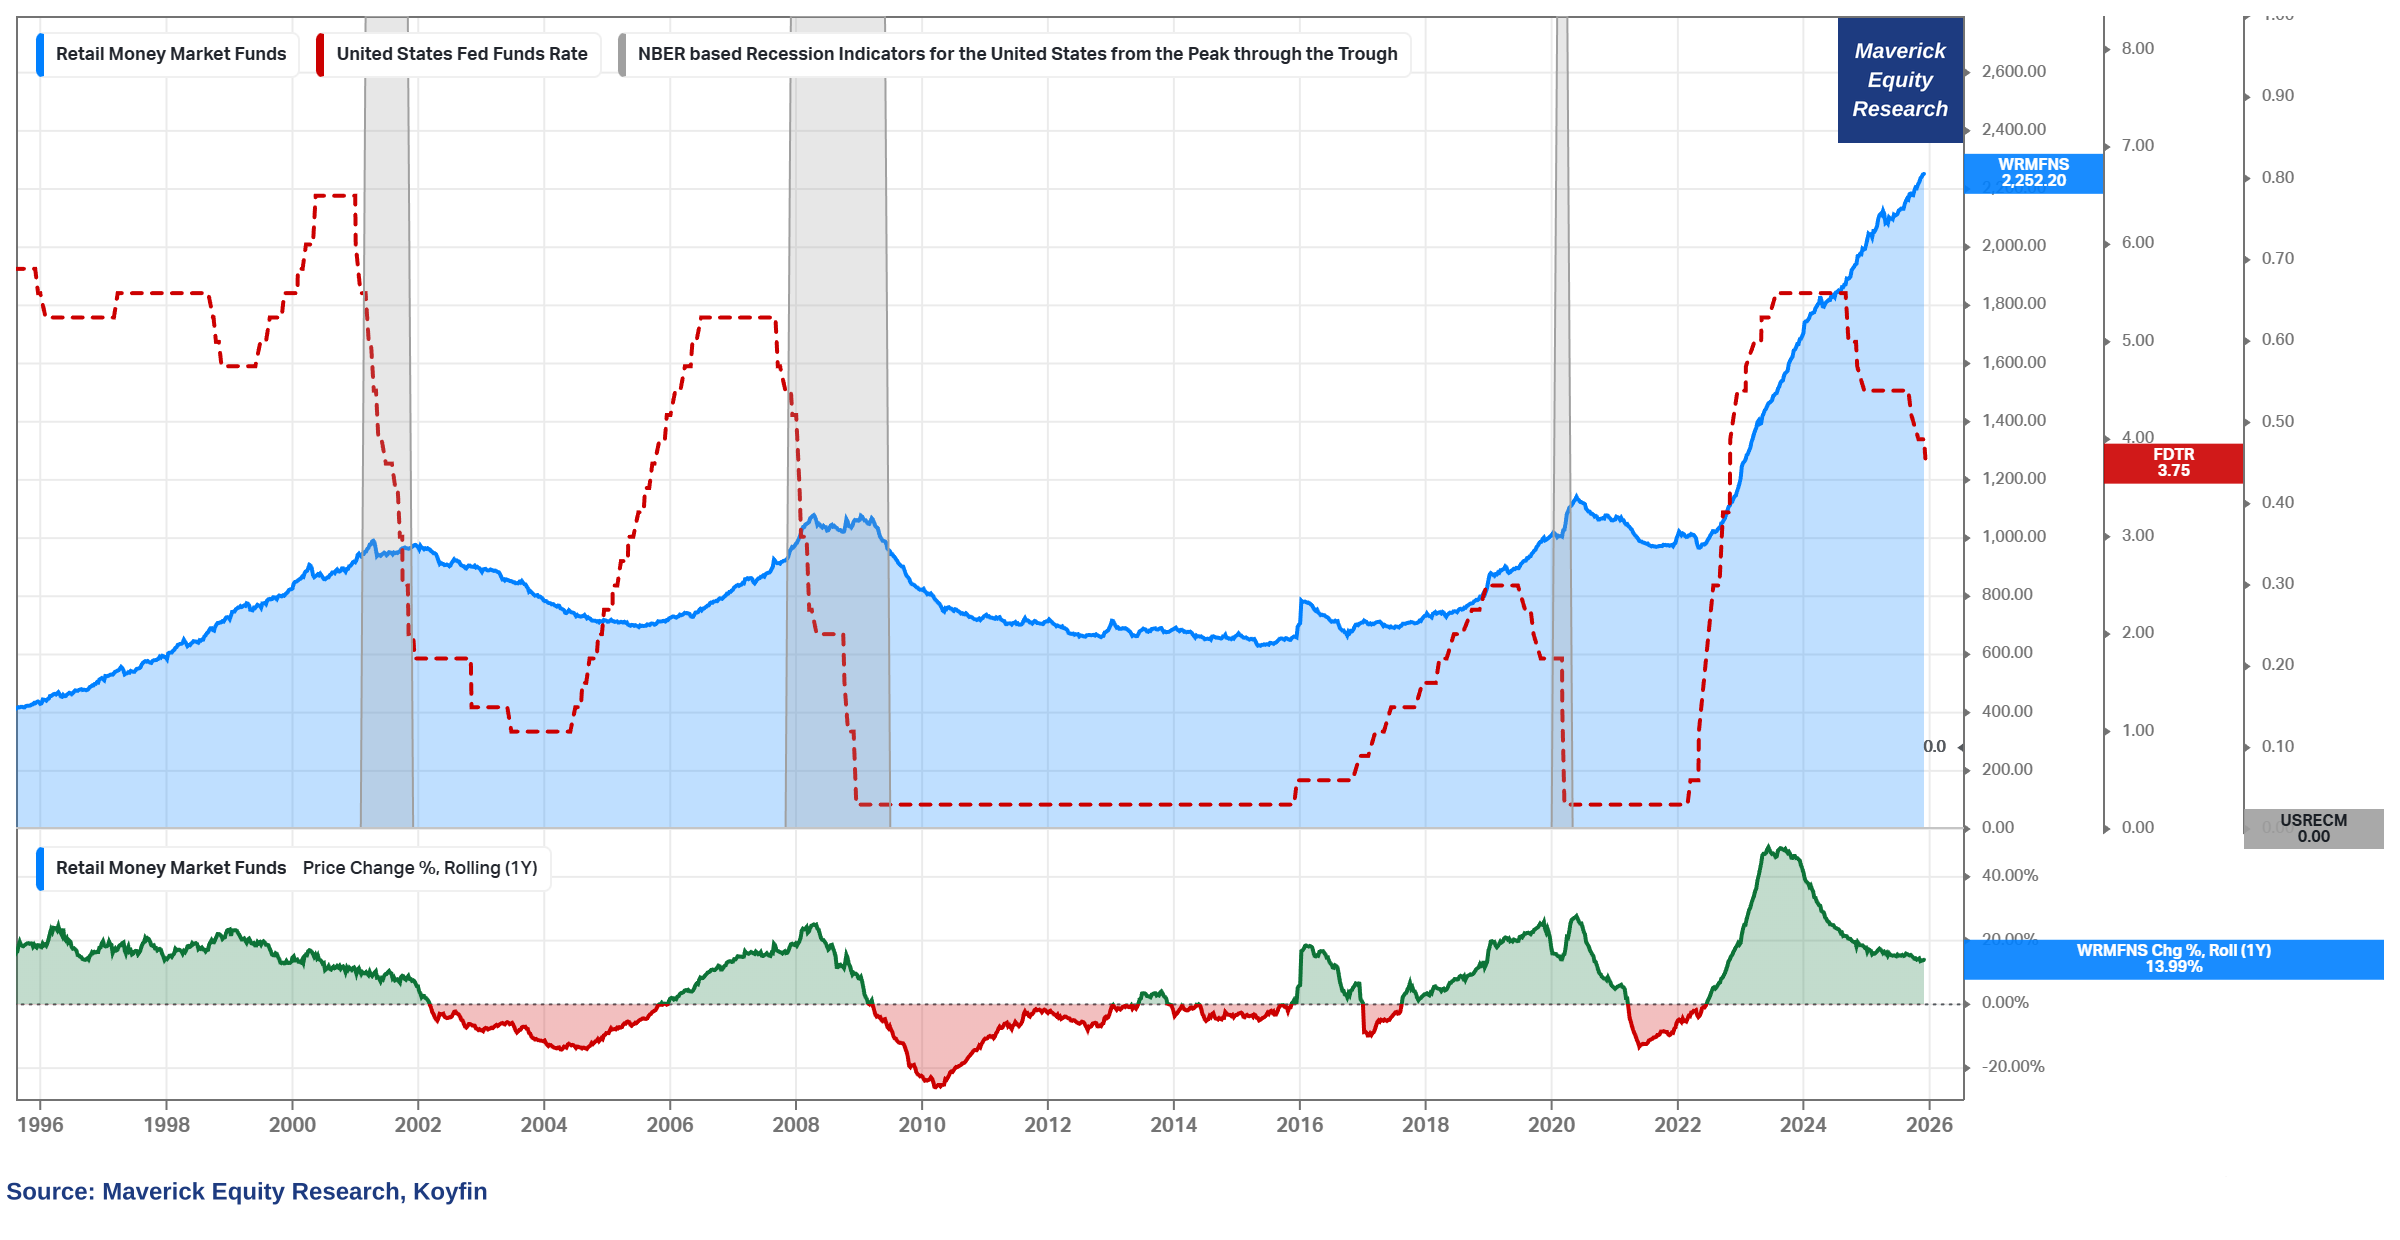
$2.25 trillion Retail Assets (blue) = also a record from Retail
👉 MMFs pay way better pay/yield than bank deposits (CDs)
👉 note also the price change % rolling 1-year: a very high growth with 13.99% now
📊 Currencies & Commodities
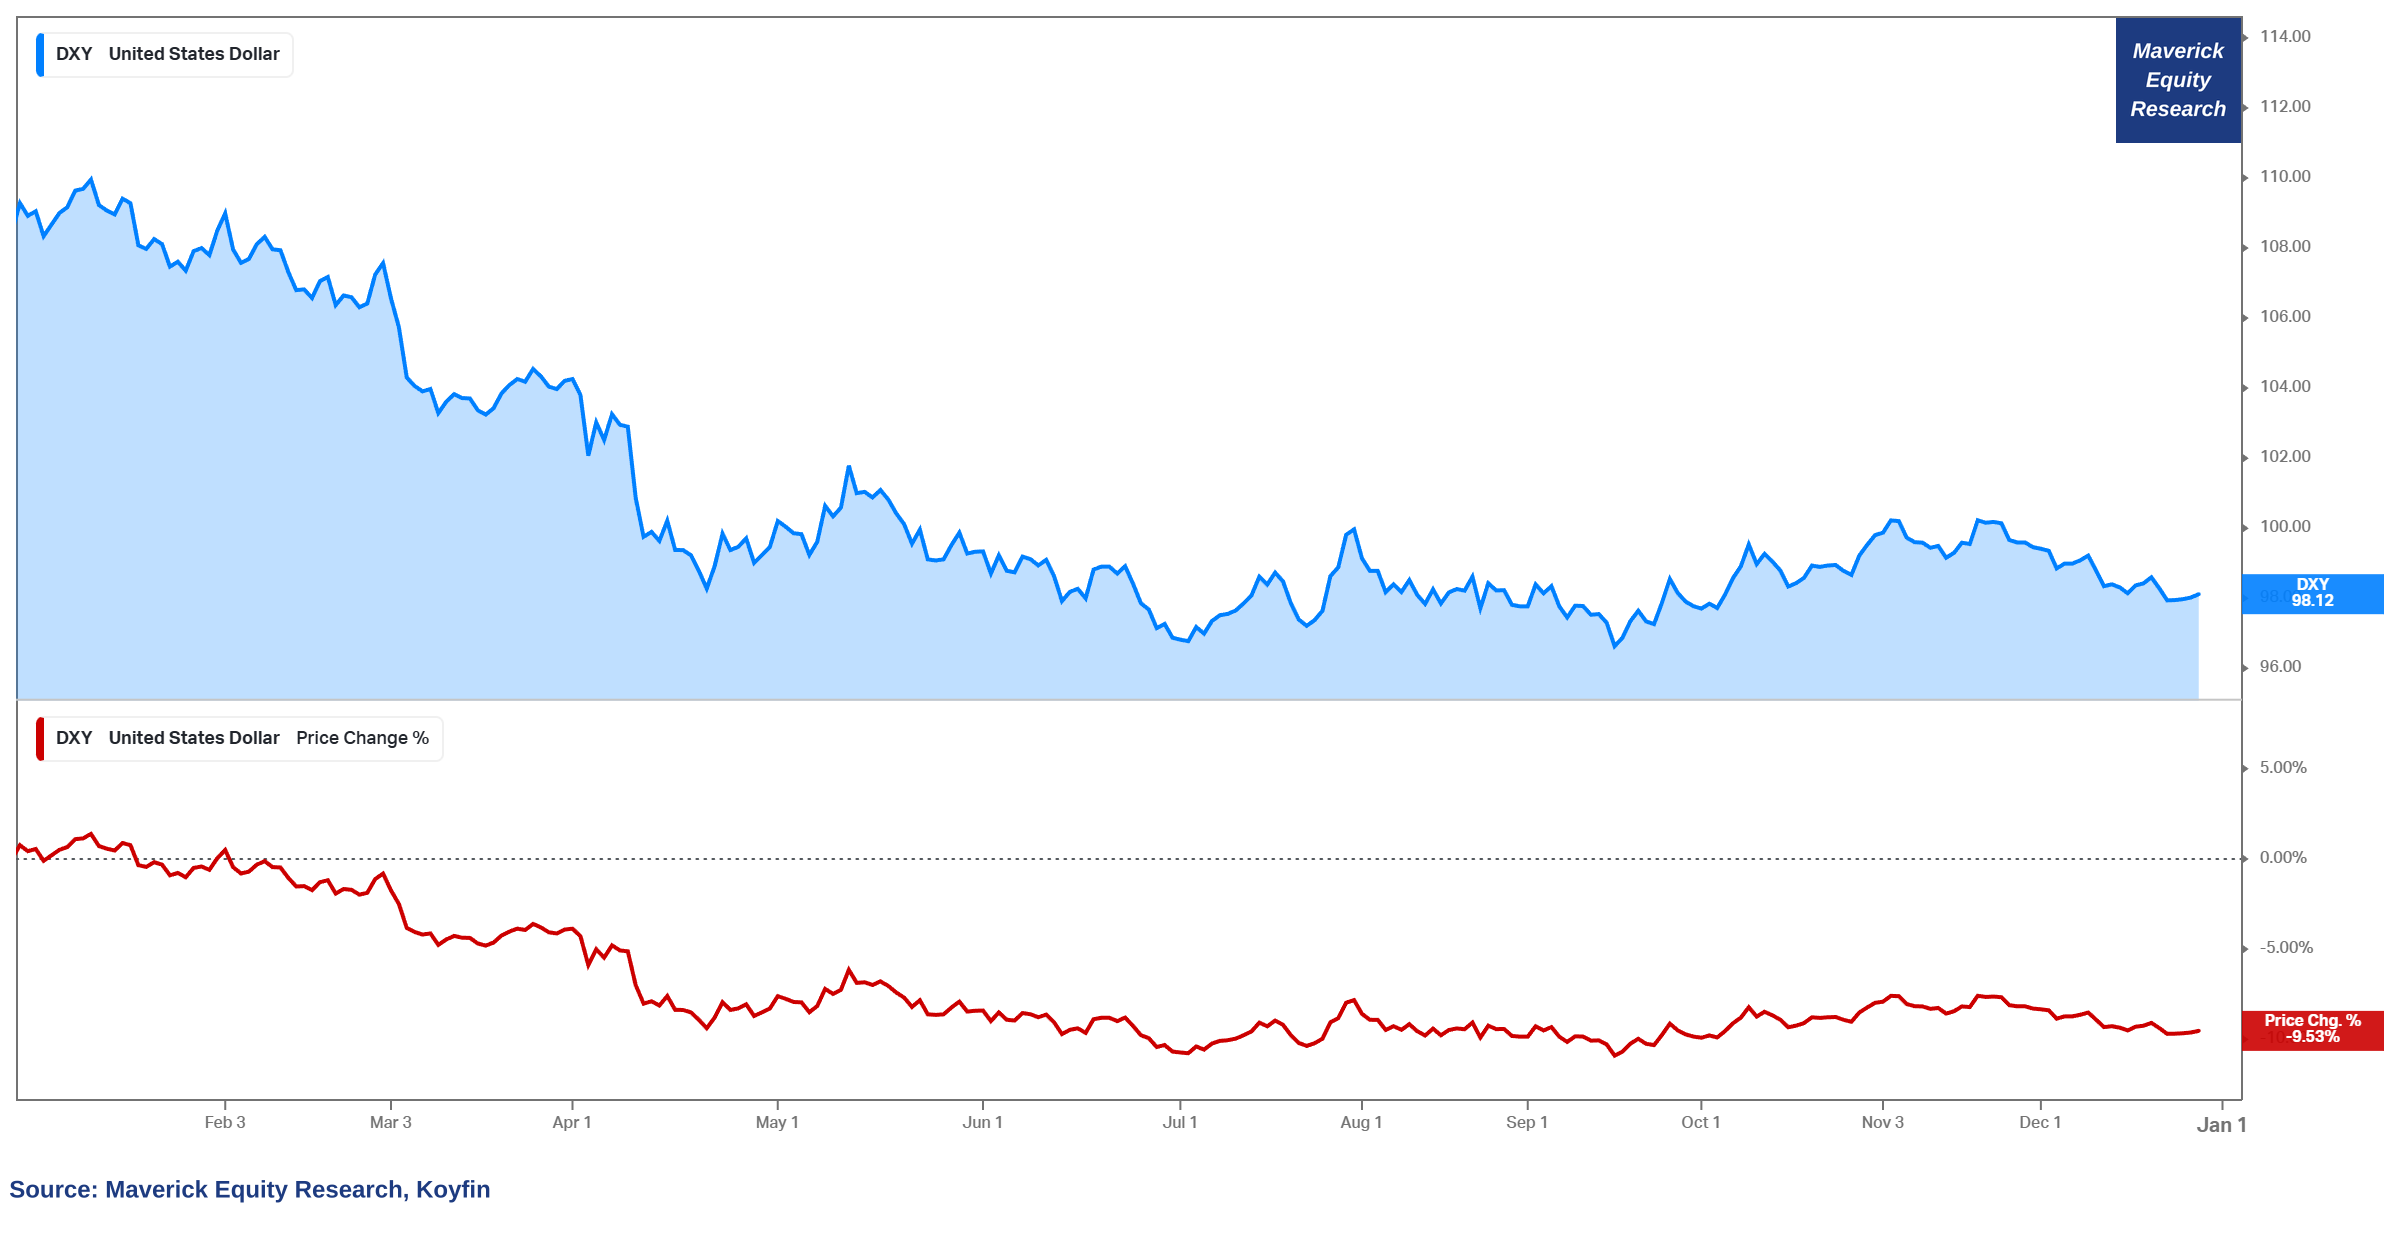
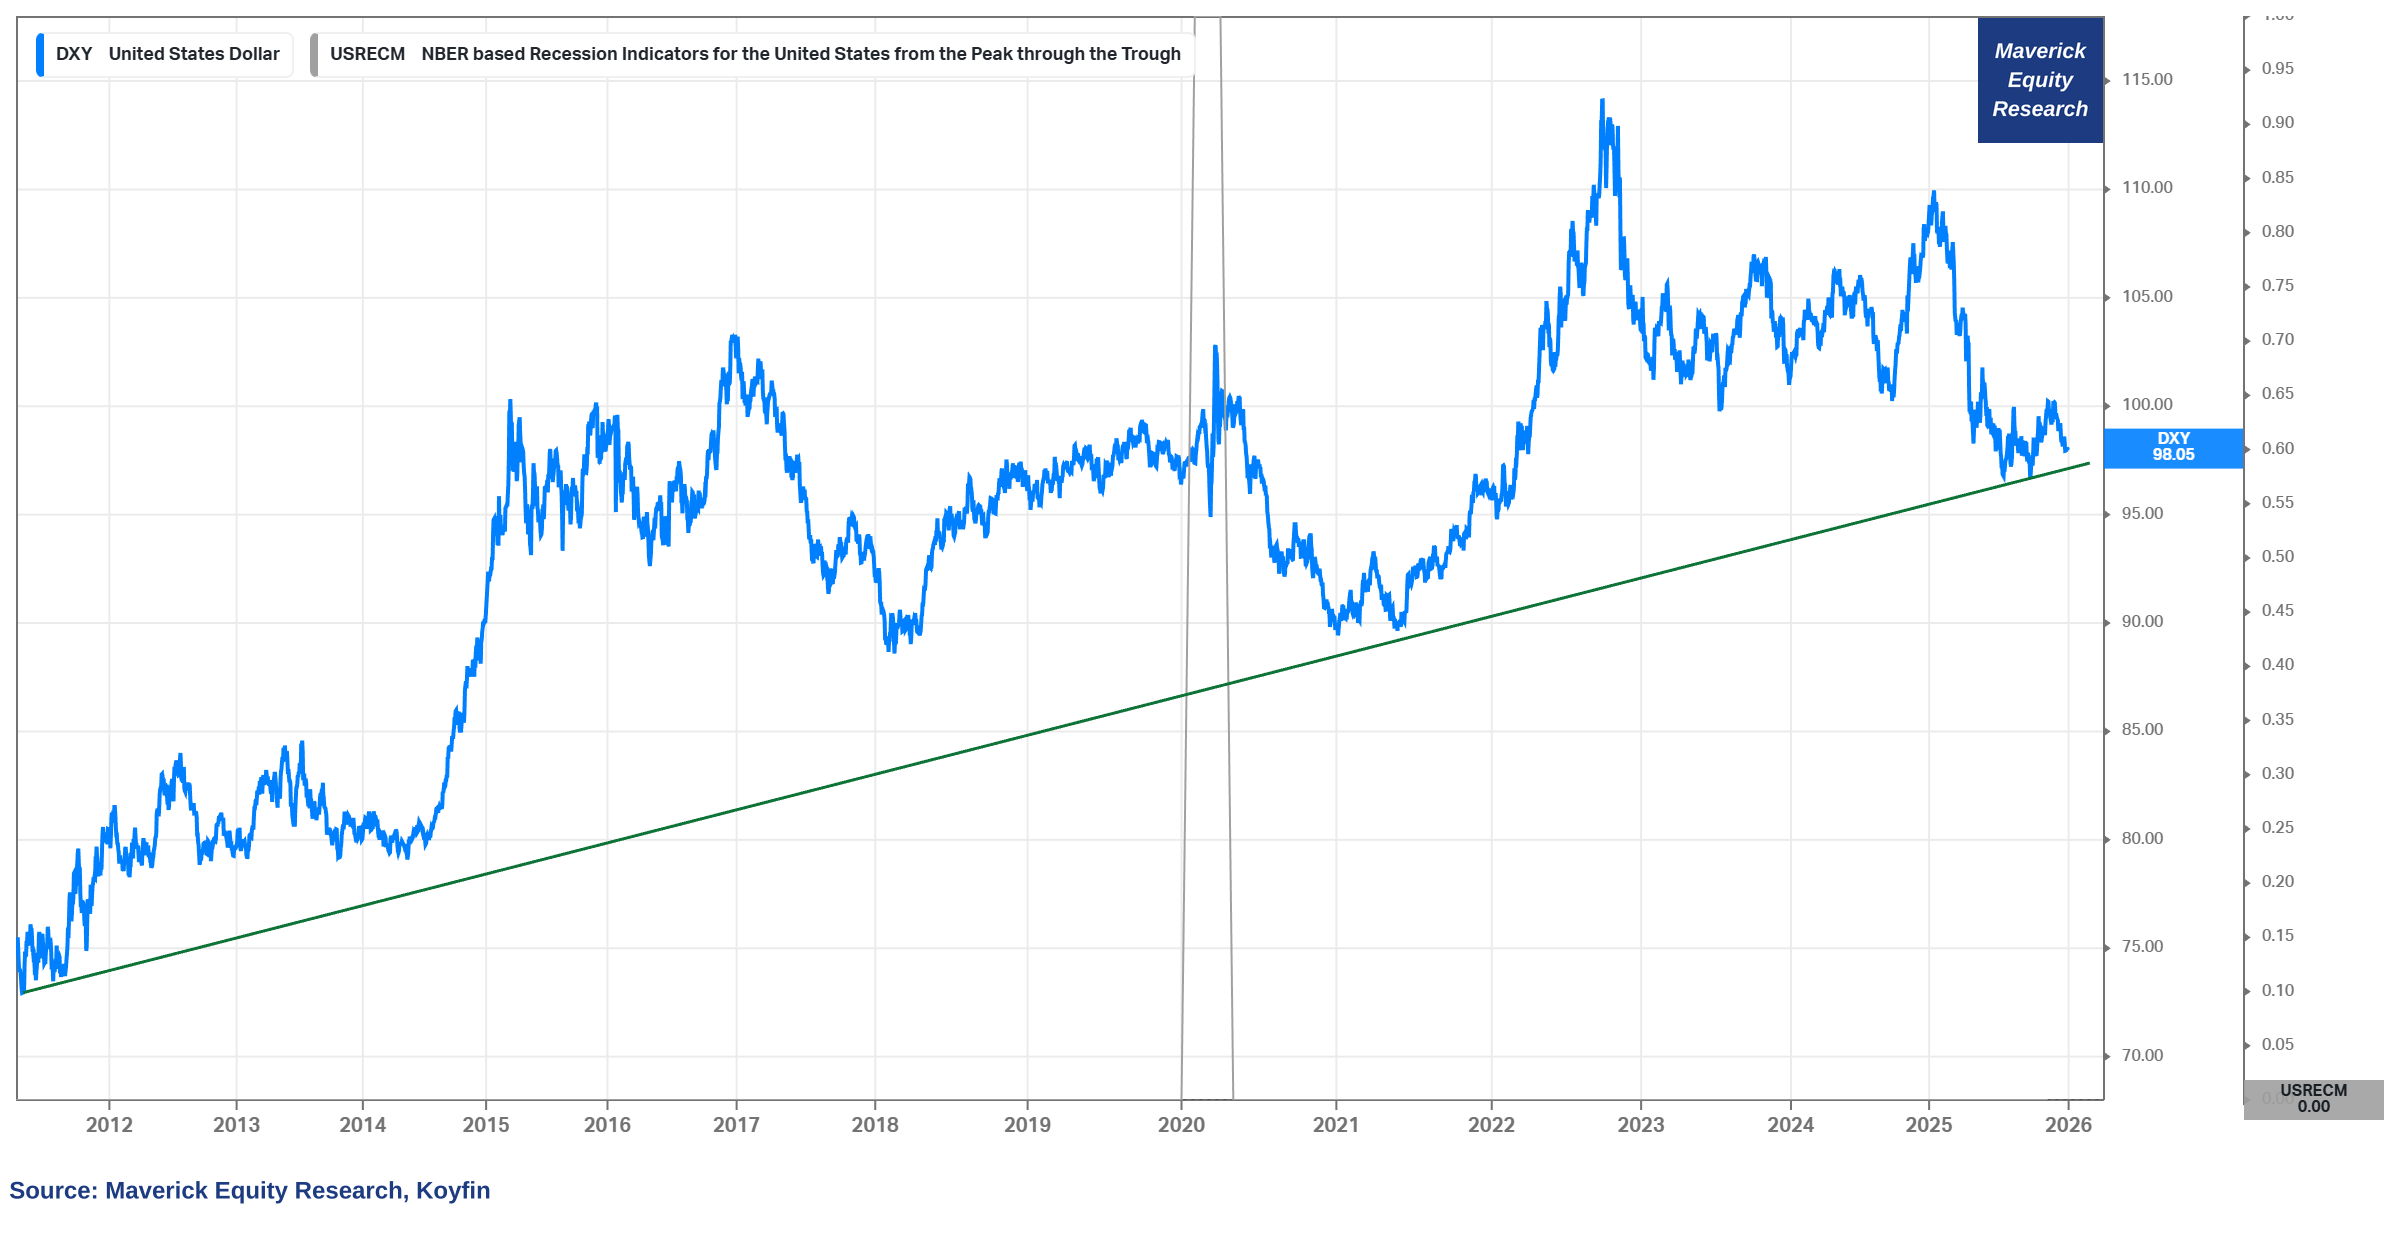
U.S. Dollar, the mighty USD with quite a bad year:
👉 USD down 9.53% versus the DXY (fixed basket of six major foreign currencies)
👉 USD is basically having one of the worst years in decades among major currencies
For a medium-long term investor though, obsessing about the Dollar is not good!
👉 mighty USD has gone nowhere in the last 50 years! At its average these days!
👉 if one is worried about the Dollar, one has 4 options (one of them or a mix):
own the Swiss Franc (CHF)
own Swiss bonds and Equities for implied ‘natural’ diversification and hedge!
own Gold
hedge it!
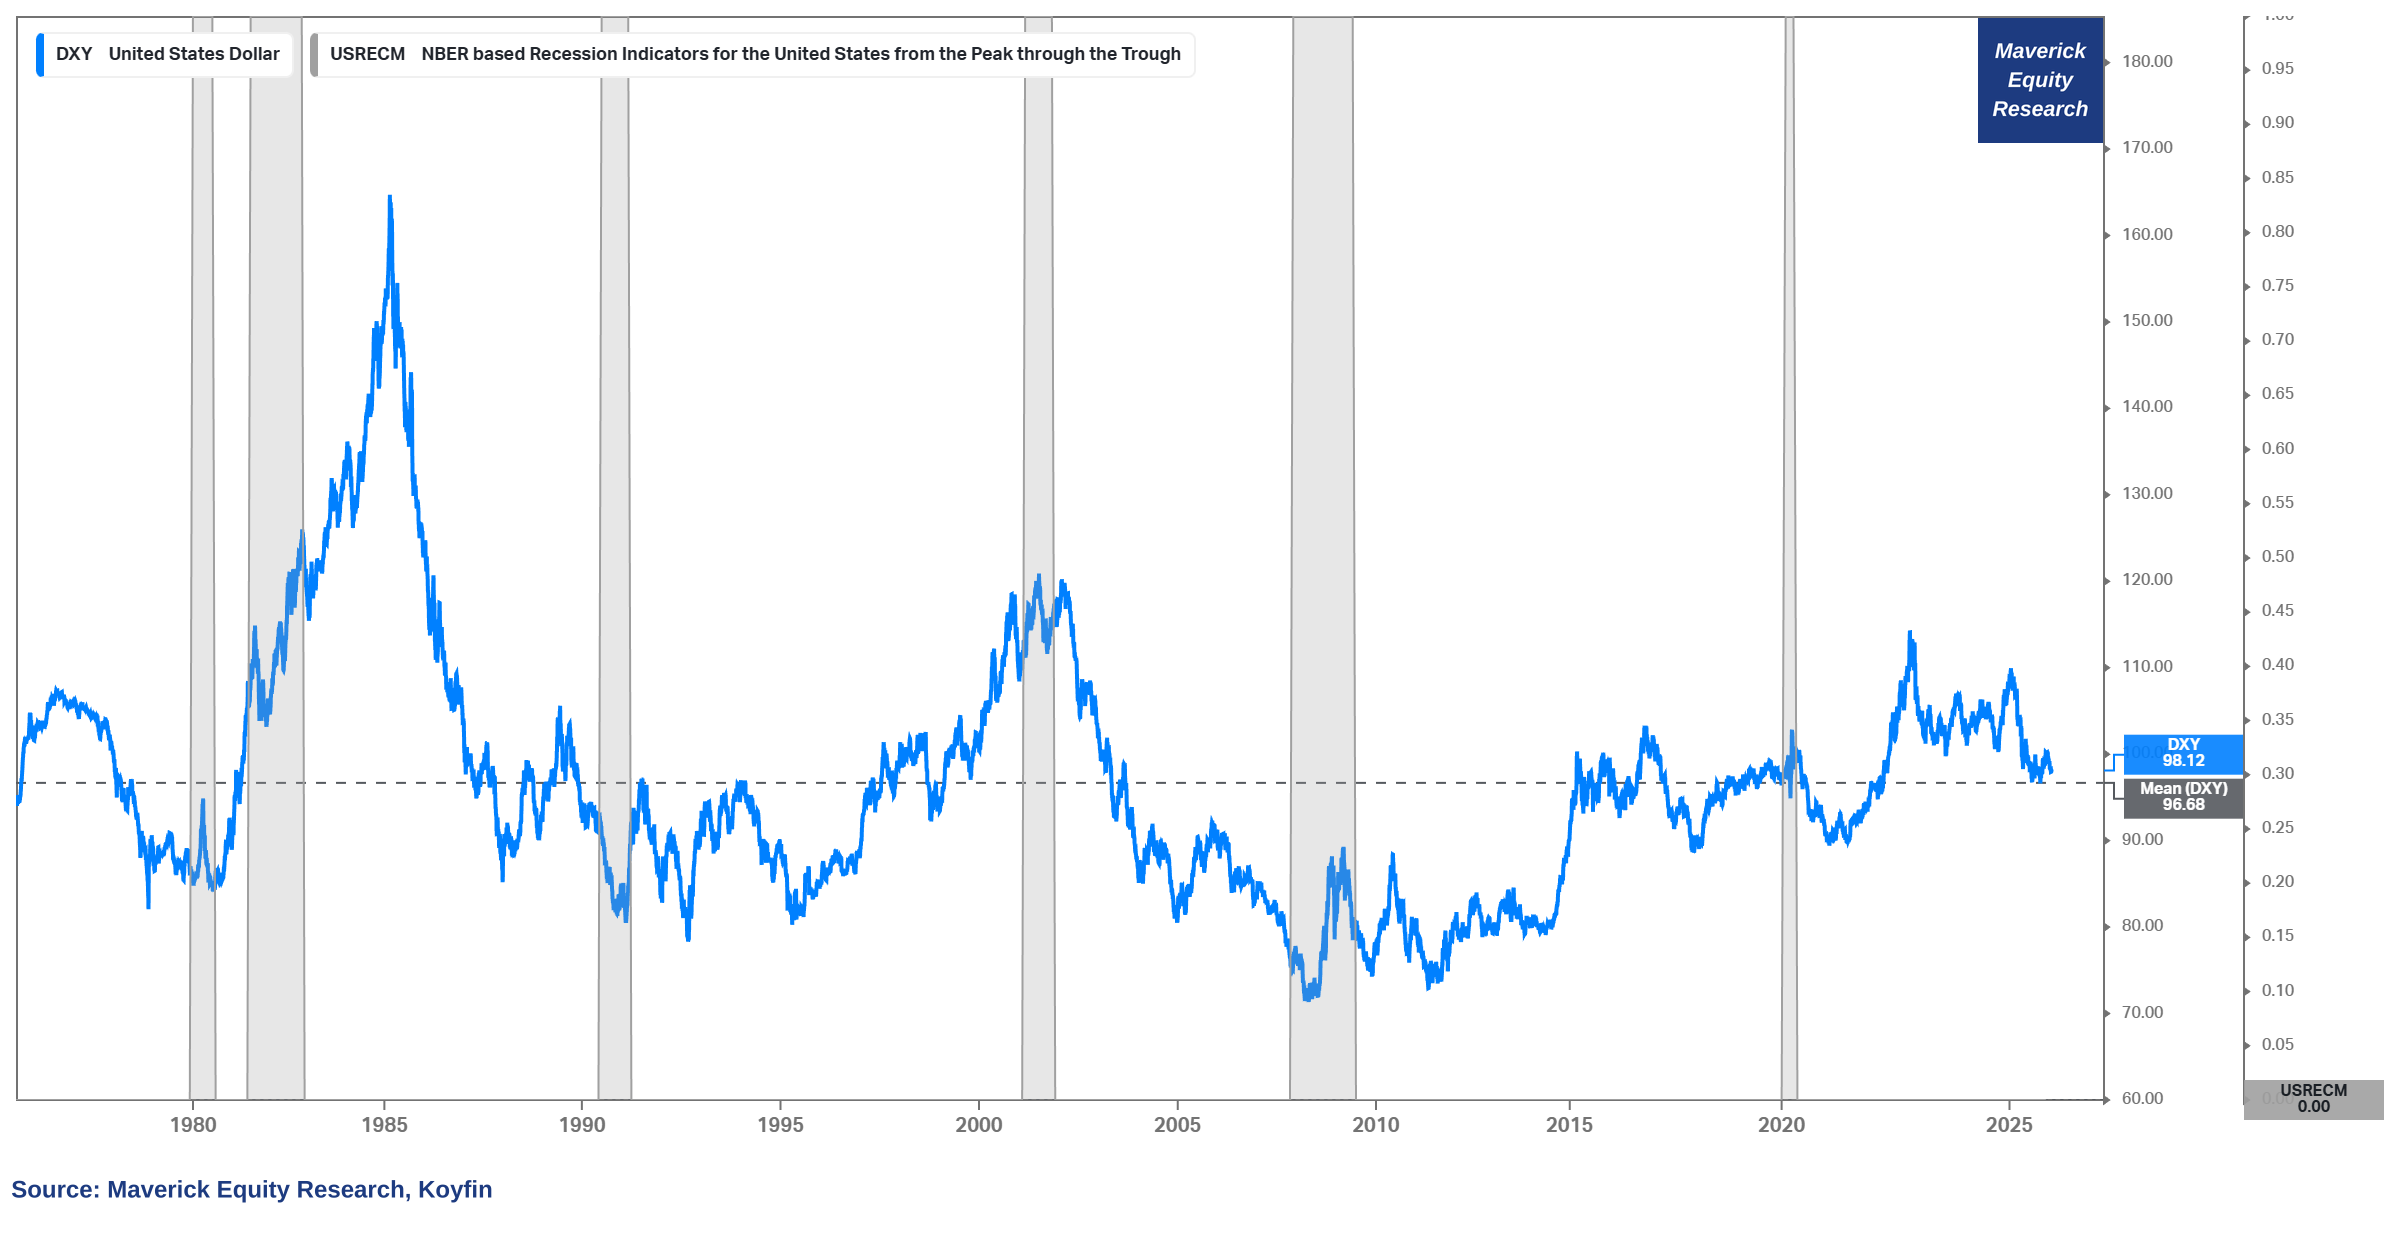
For a more short-term tactical trader, check the post-GFC bull uptrend:
👉 despite several tests, it continues to hold — rather a rebound from here
Given the Dollar obsession and many calling the end of the Dollar since ages, one day I will do a Maverick Special report on it where I cover many angles & the many myths!
✍️ The Mighty Dollar and its Mighty Myths!
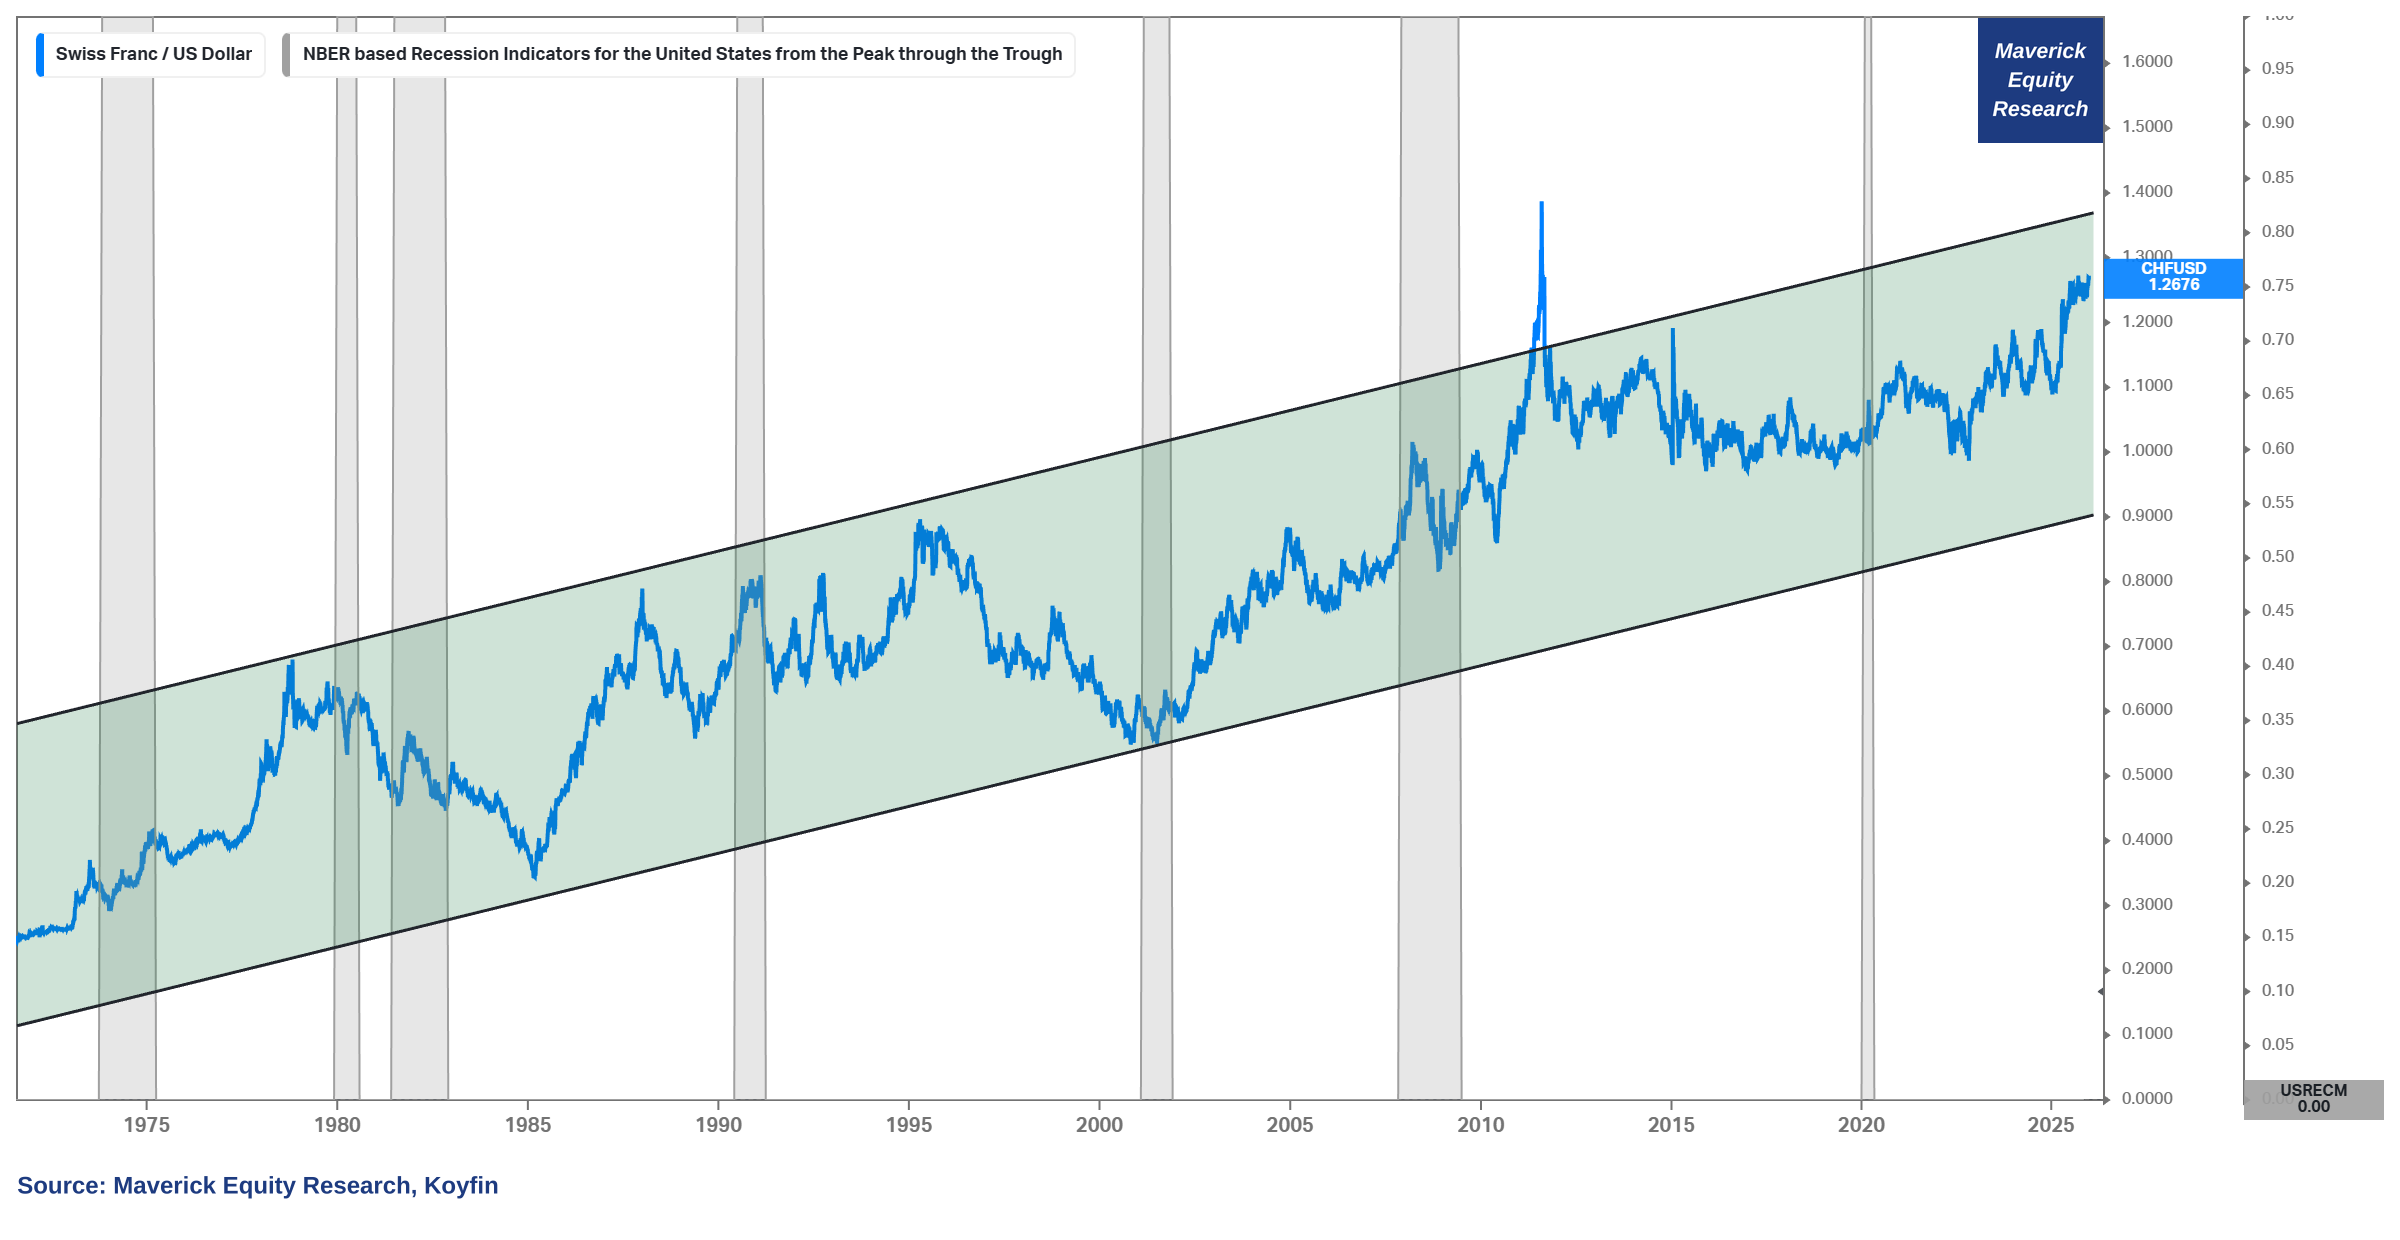
The Mighty Swissie Swiss Franc (CHF) on the other side = currency of the year!
👉 CHF/USD: Swiss Franc keeps doin what it does best - going higher!
👉 +14.9% appreciation for the Swiss Franc versus the Dollar
👉 at 1.2676 trending higher in the multi-decade channel
Investing insights and food for thought:
👉 why aren’t more investors looking into Swiss stocks? Ok, only around +200 listed, but still ... well, no worries, I will cover quite some Swiss stock in the future ...
👉 why? natural FX and cash flow diversifier + neutrality + fiscal discipline + innovation + SNB balance sheet + federalism & more ... ahh + chocolate 🍫
👉 performance wise and also returns expectations, many investors forget to adjust for currency differences — for example:
the Swiss Market Index (SMI) is +14% in 2025
the CHF gained 14.9% versus the Dollar in 2025
for an US investor, once returns are translated into USD terms, returns are way way higher given the USD … simple, but many times forgotten!
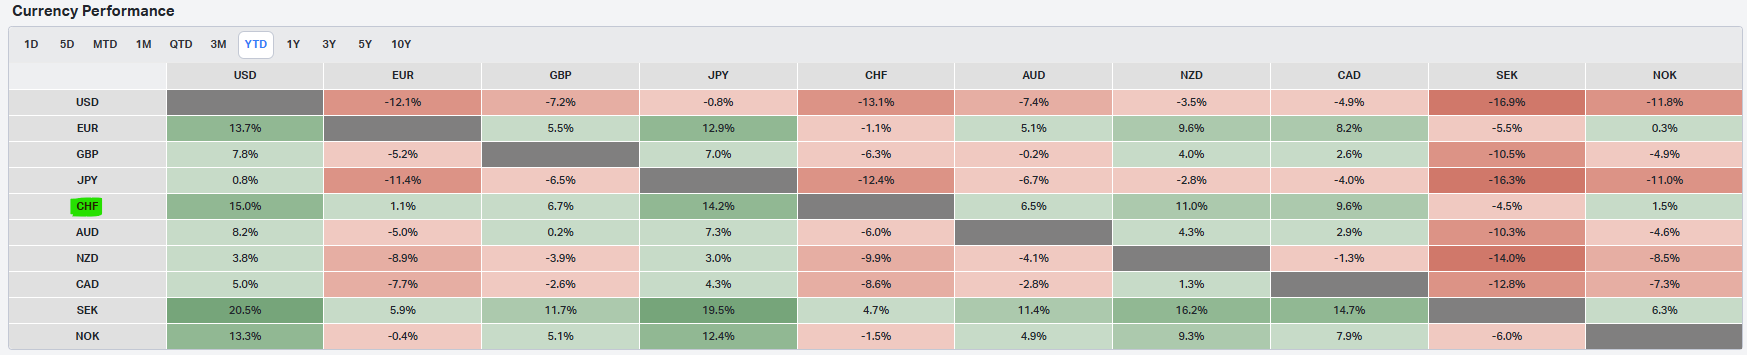
Not just against the dollar, but the CHF appreciated against most currency majors!
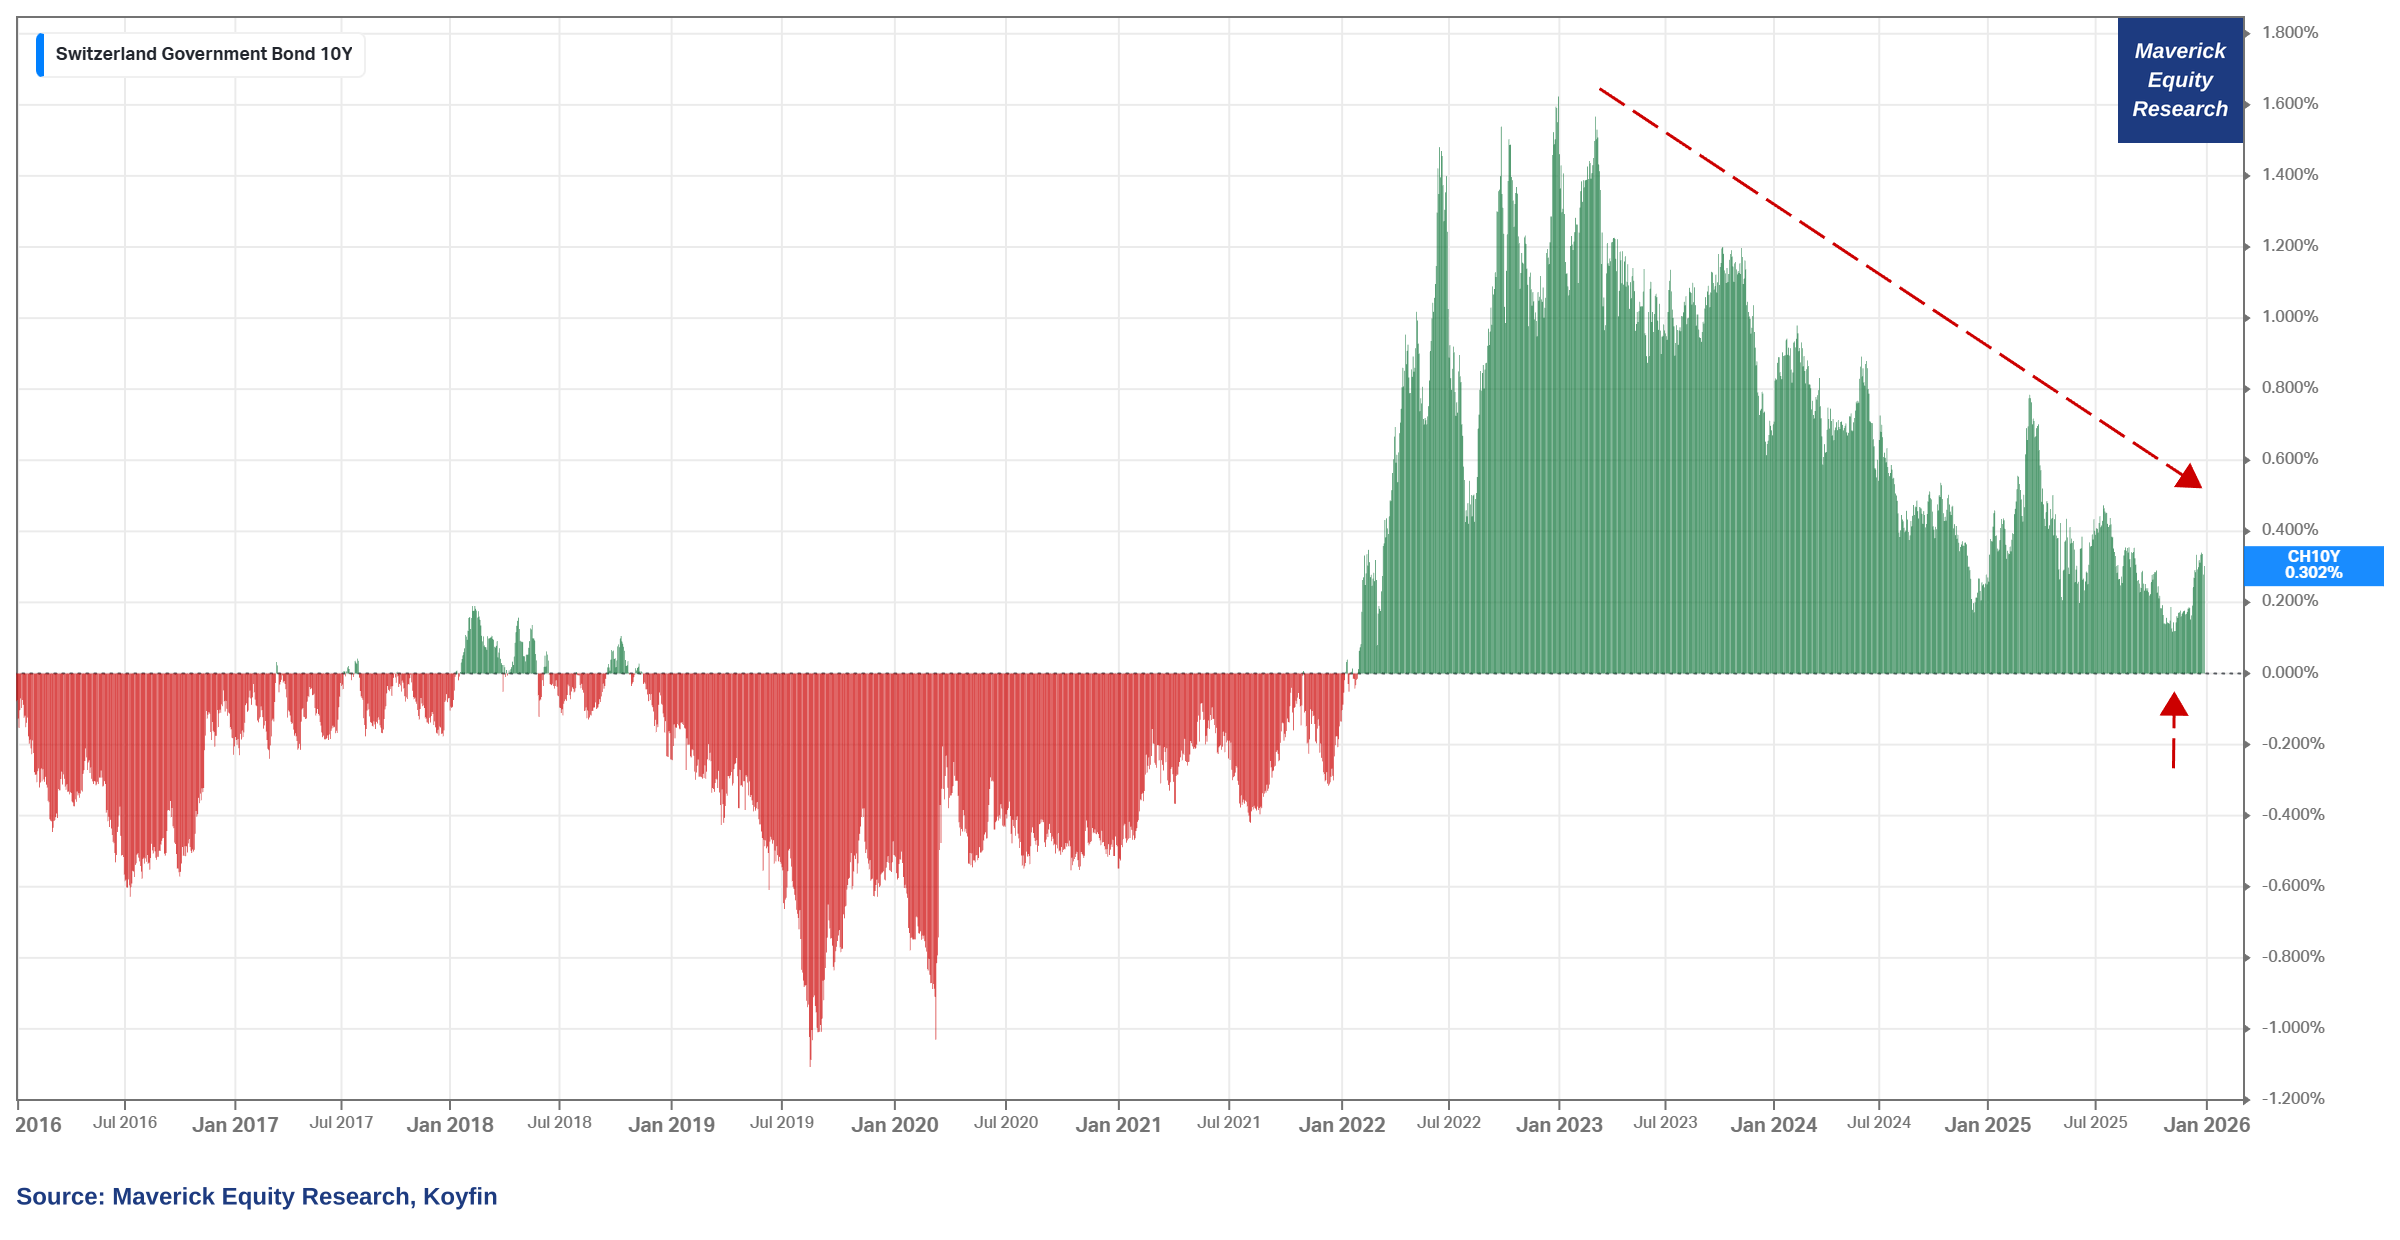
Swiss government bonds:
👉 the 2-year did go negative once again
👉 the 10-year yield kept trending lower and was not far from going negative again
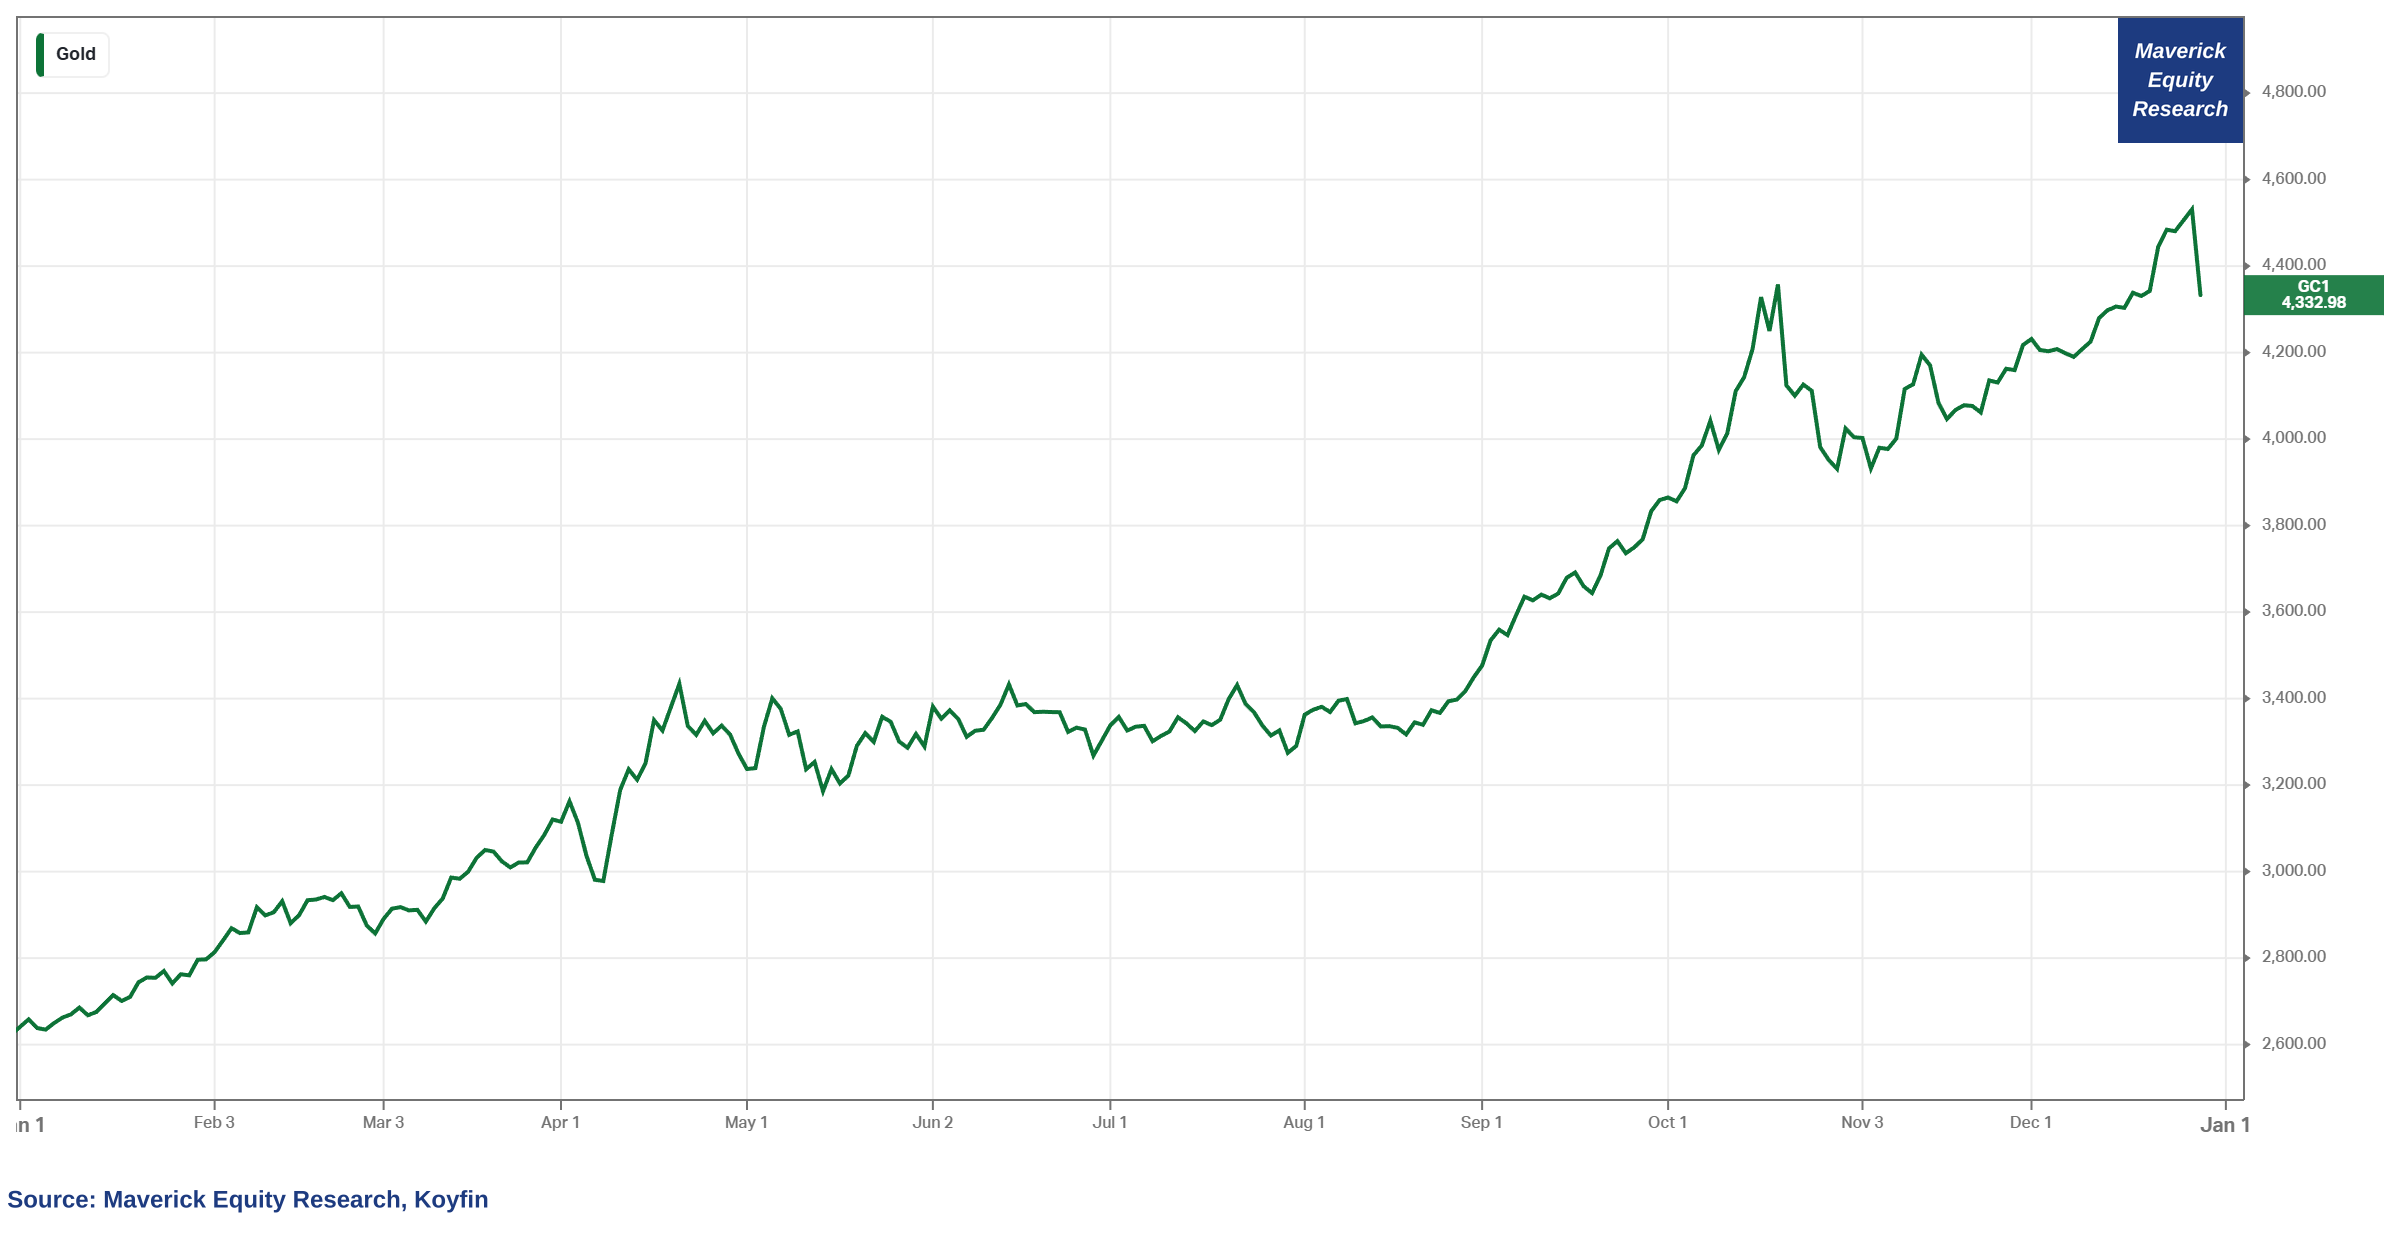
Gold, goldie gold, the oldest asset of them all, you shiny yellow metal!
👉 with a +78% in 2025, = the best year since 1979! Note also that it is very rare for both Gold and the S&P 500 to have great runs together!
👉 lately, it seems everybody is digging gold and/or becoming a gold digger? Just pun intended! 😉
👉 joke aside: geopolitics, geopolitical risk premium, fiscal dominance, currency debasement, fiat currency worries, central banks huge buyers, there is a lot going on!
Hence, 2 Maverick Special reports will cover in depth the mighty gold!
✍️ Gold, A Strategic Asset In A Multi-Asset Portfolio
✍️ Bitcoin & Gold, not Bitcoin VS Gold
Until then, you can check the Maverick Special Situation report from March 2025:
✍️ Maverick Special Situation #6: 🪙 Gold Special Seasonality Pattern
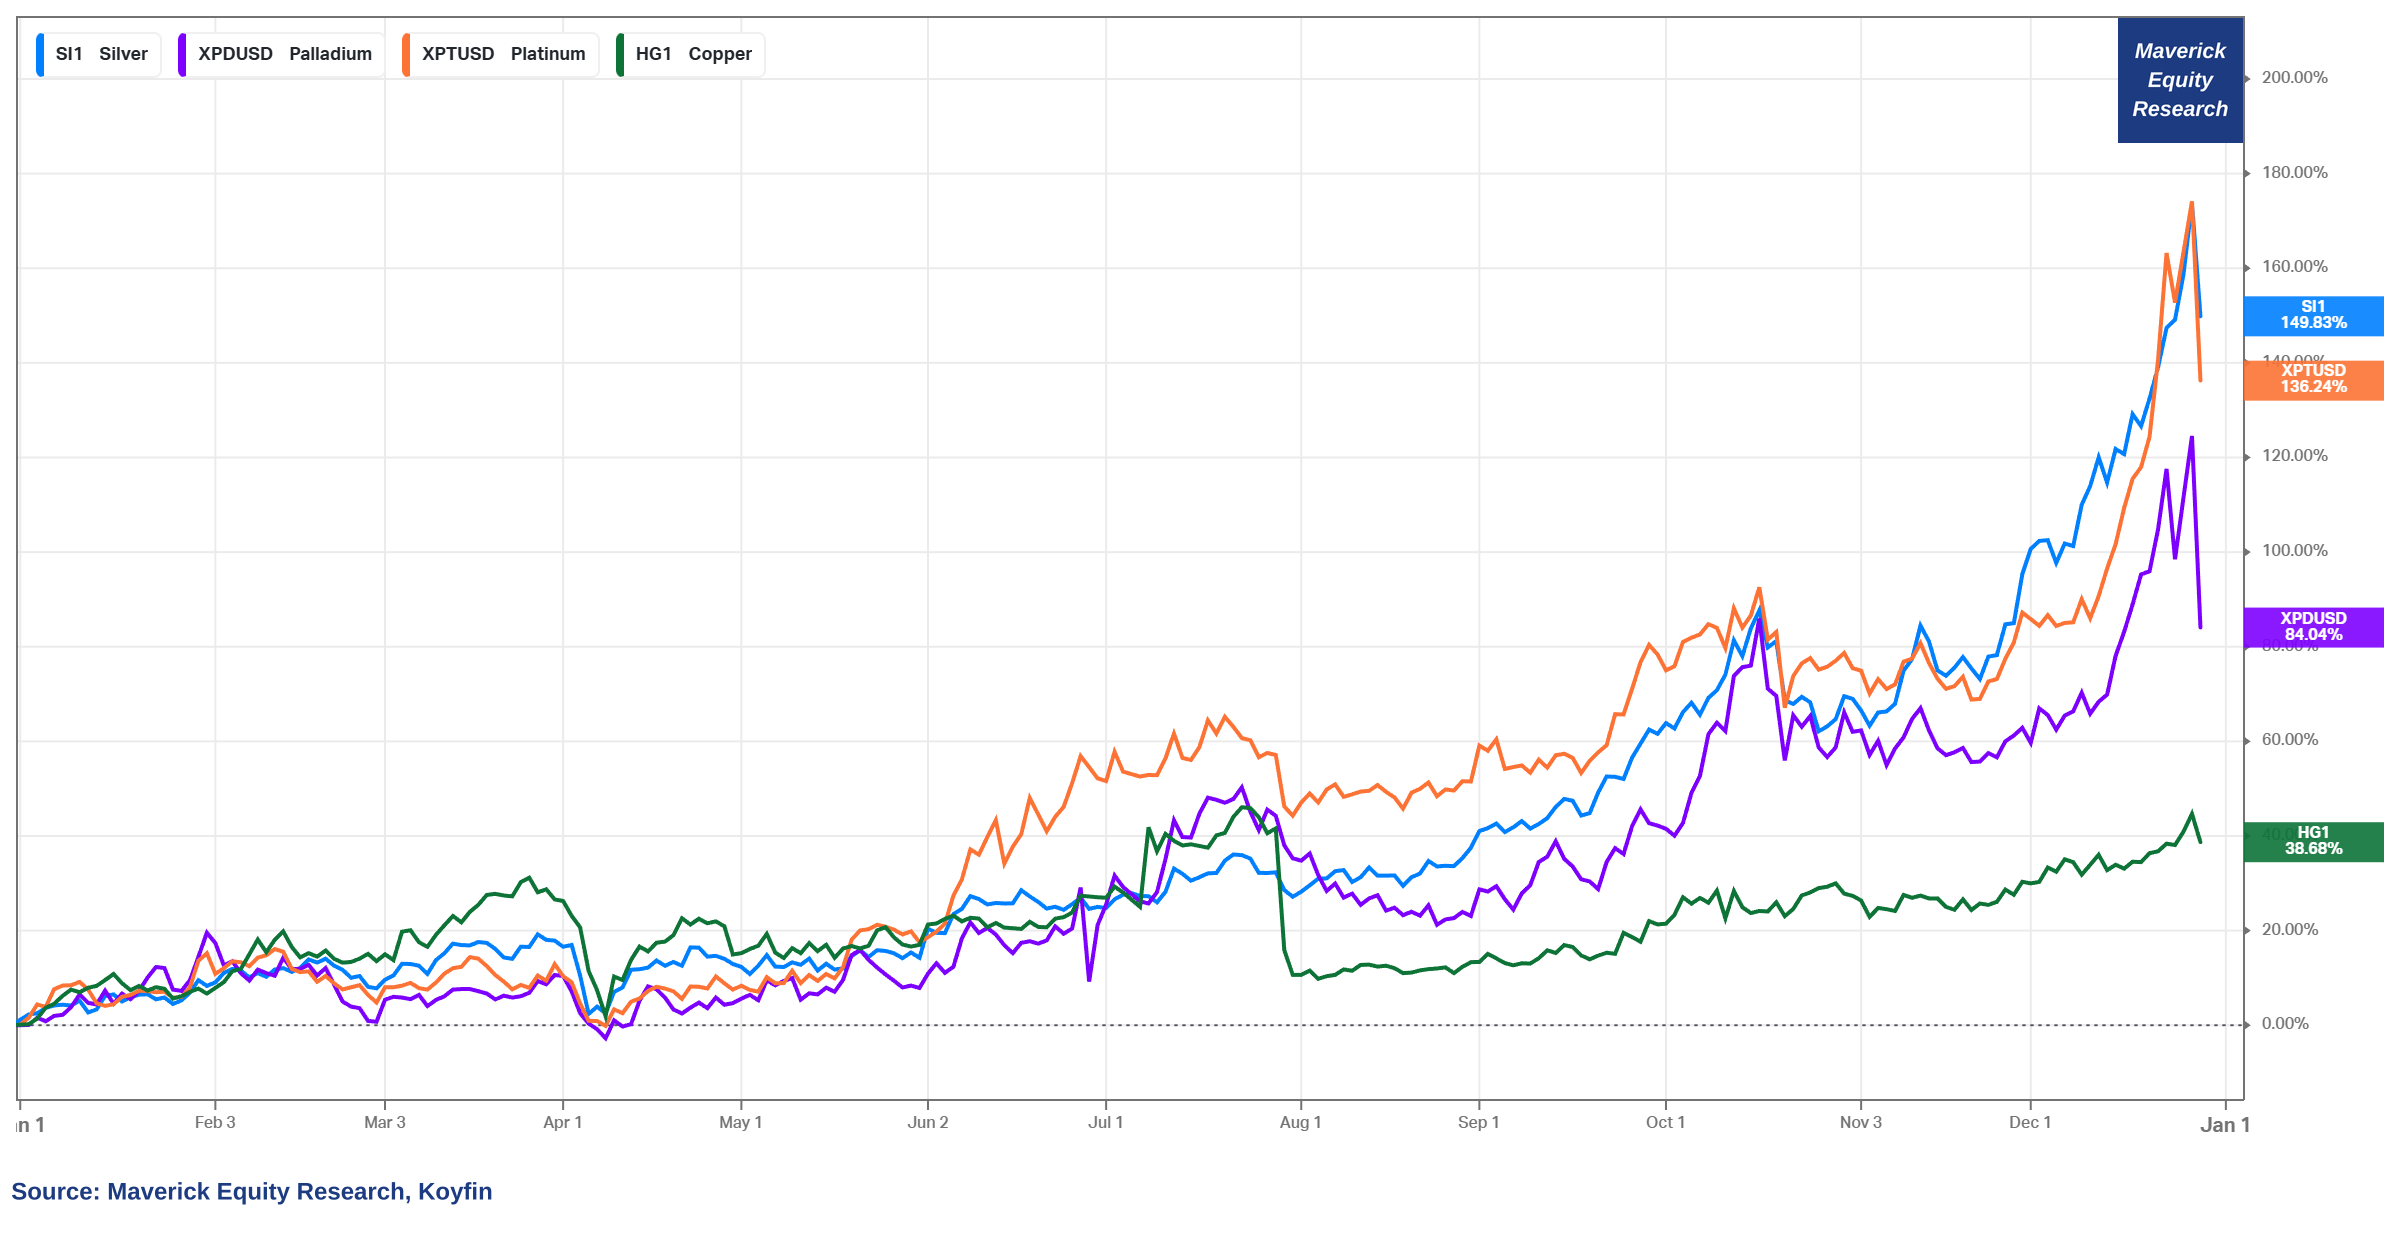
It’s not just Gold, but other commodities also having a crazy good year:
👉 Silver +149.83% also the best year since 1979 when it ripped 5x in famous fashion
Silver is needed in many industrial processes, semiconductors etc, hence not good
an ounce (31 grams) of silver is worth twice as much as a barrel (159 liters) of Russian crude oil (has only happened once before in 1980) — let that one sink in!
👉 Platinum +136.24%
👉 Palladium +84.04%
👉 Copper +38.68%
These are not good in order to tame inflation and have it anchored in terms of expectations, though I think they will run out of steam rather sooner than later.
When everybody suddenly becomes a precious metals expert, and that coupled with parabolic fast runs up, more likely pointing to a top and/or bubbly behaviours … .
More on that in the future Maverick reports!
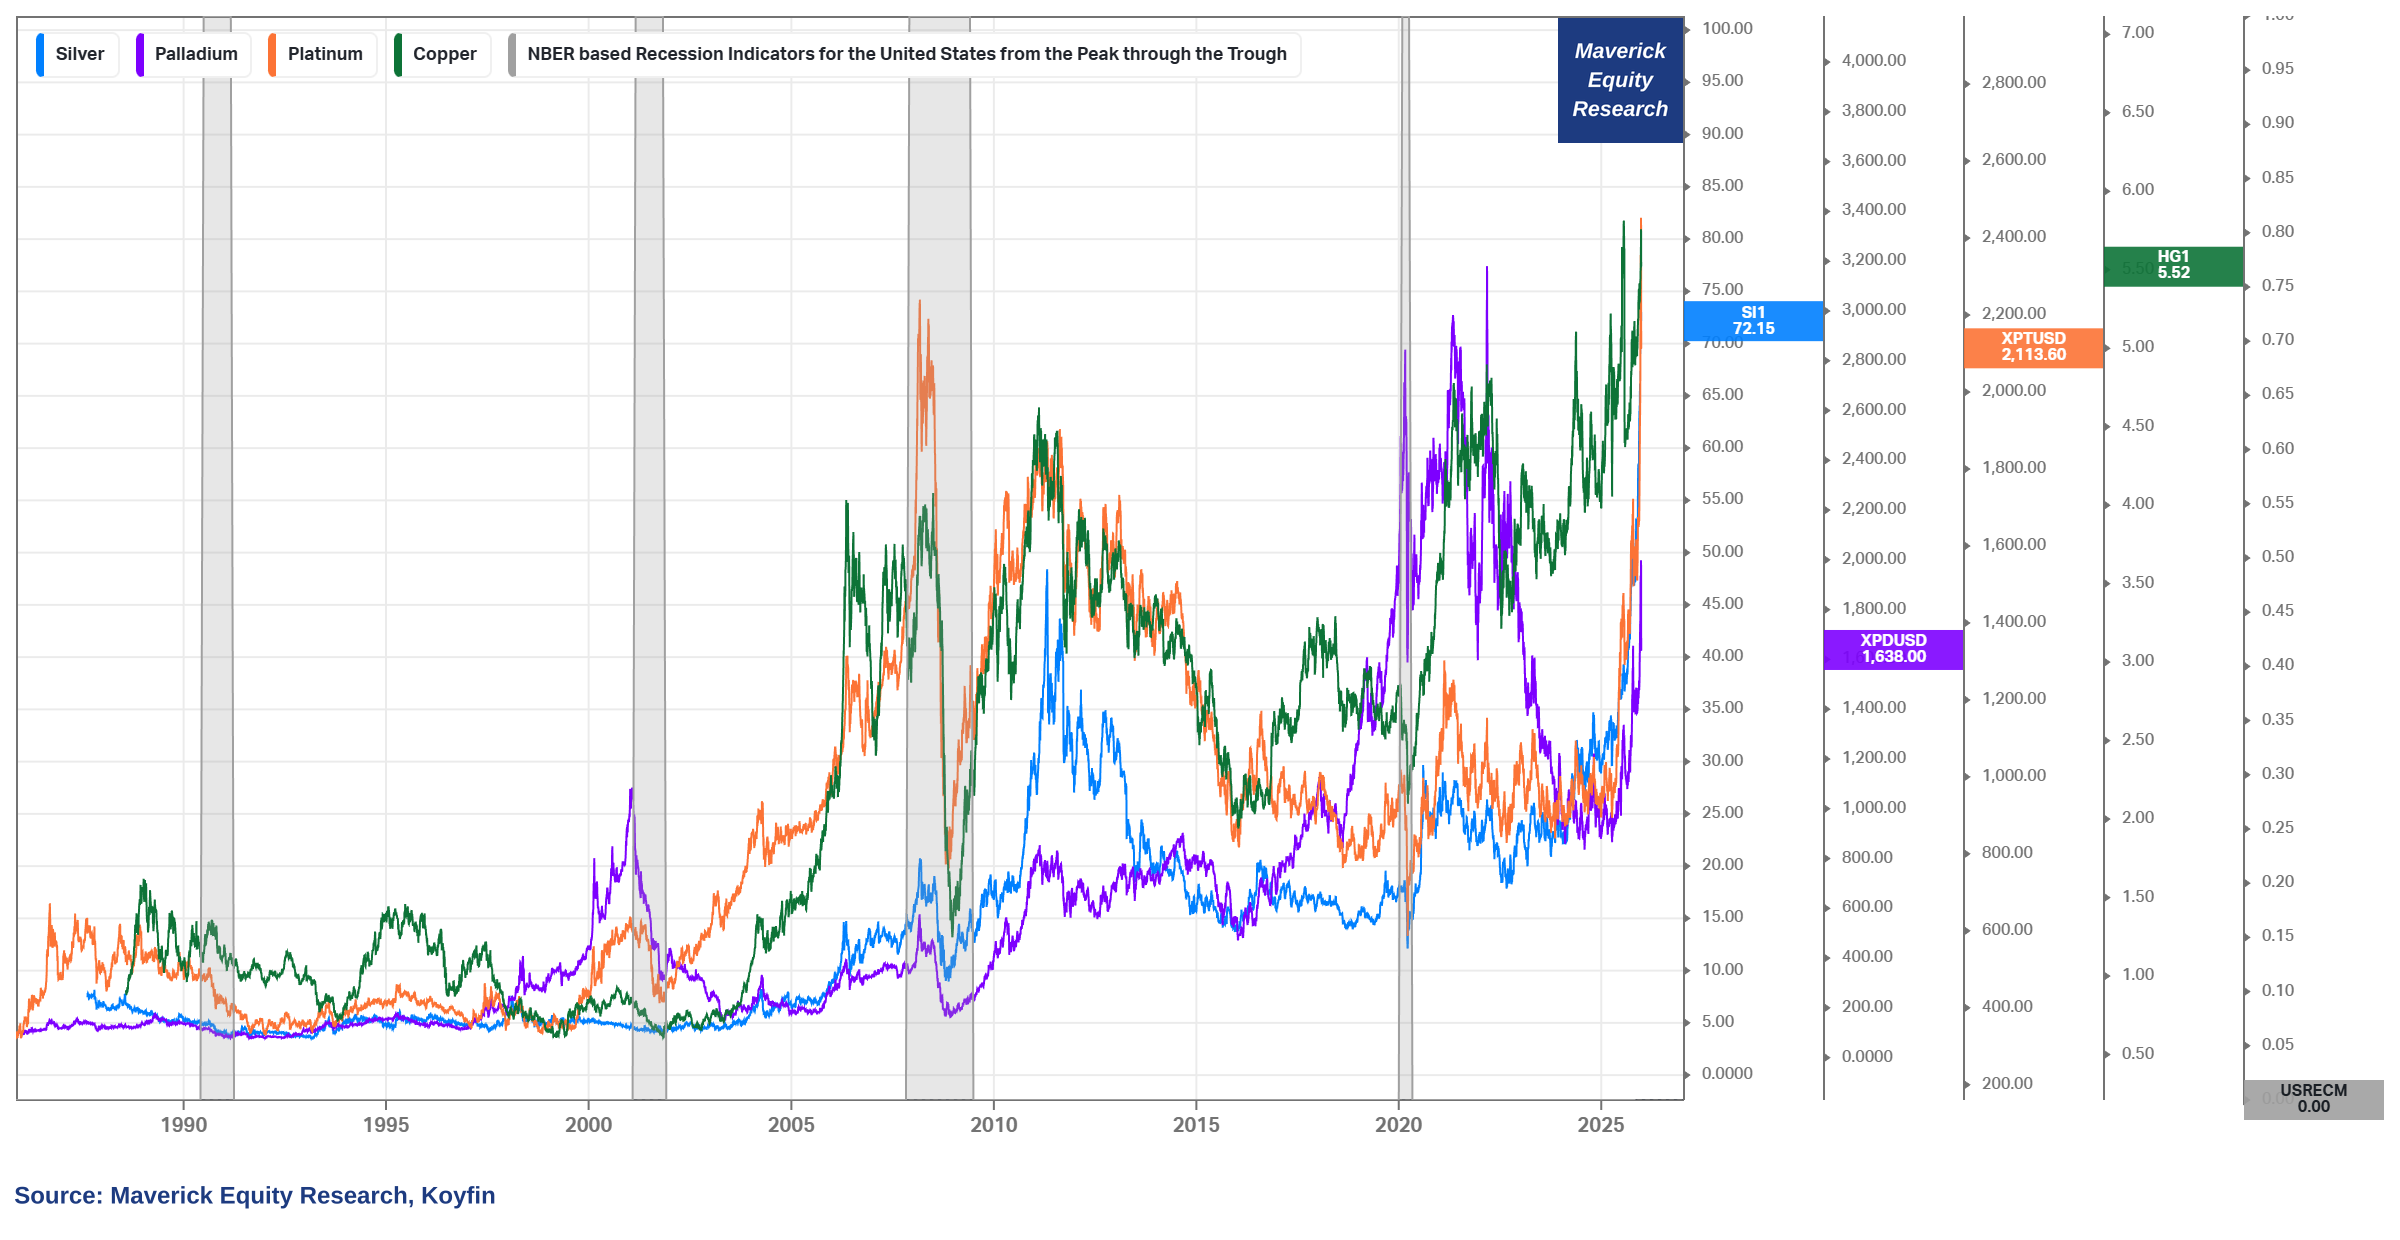
Zooming out for the last 40 years, they are quite cyclical, isn’t it? Food for thought!
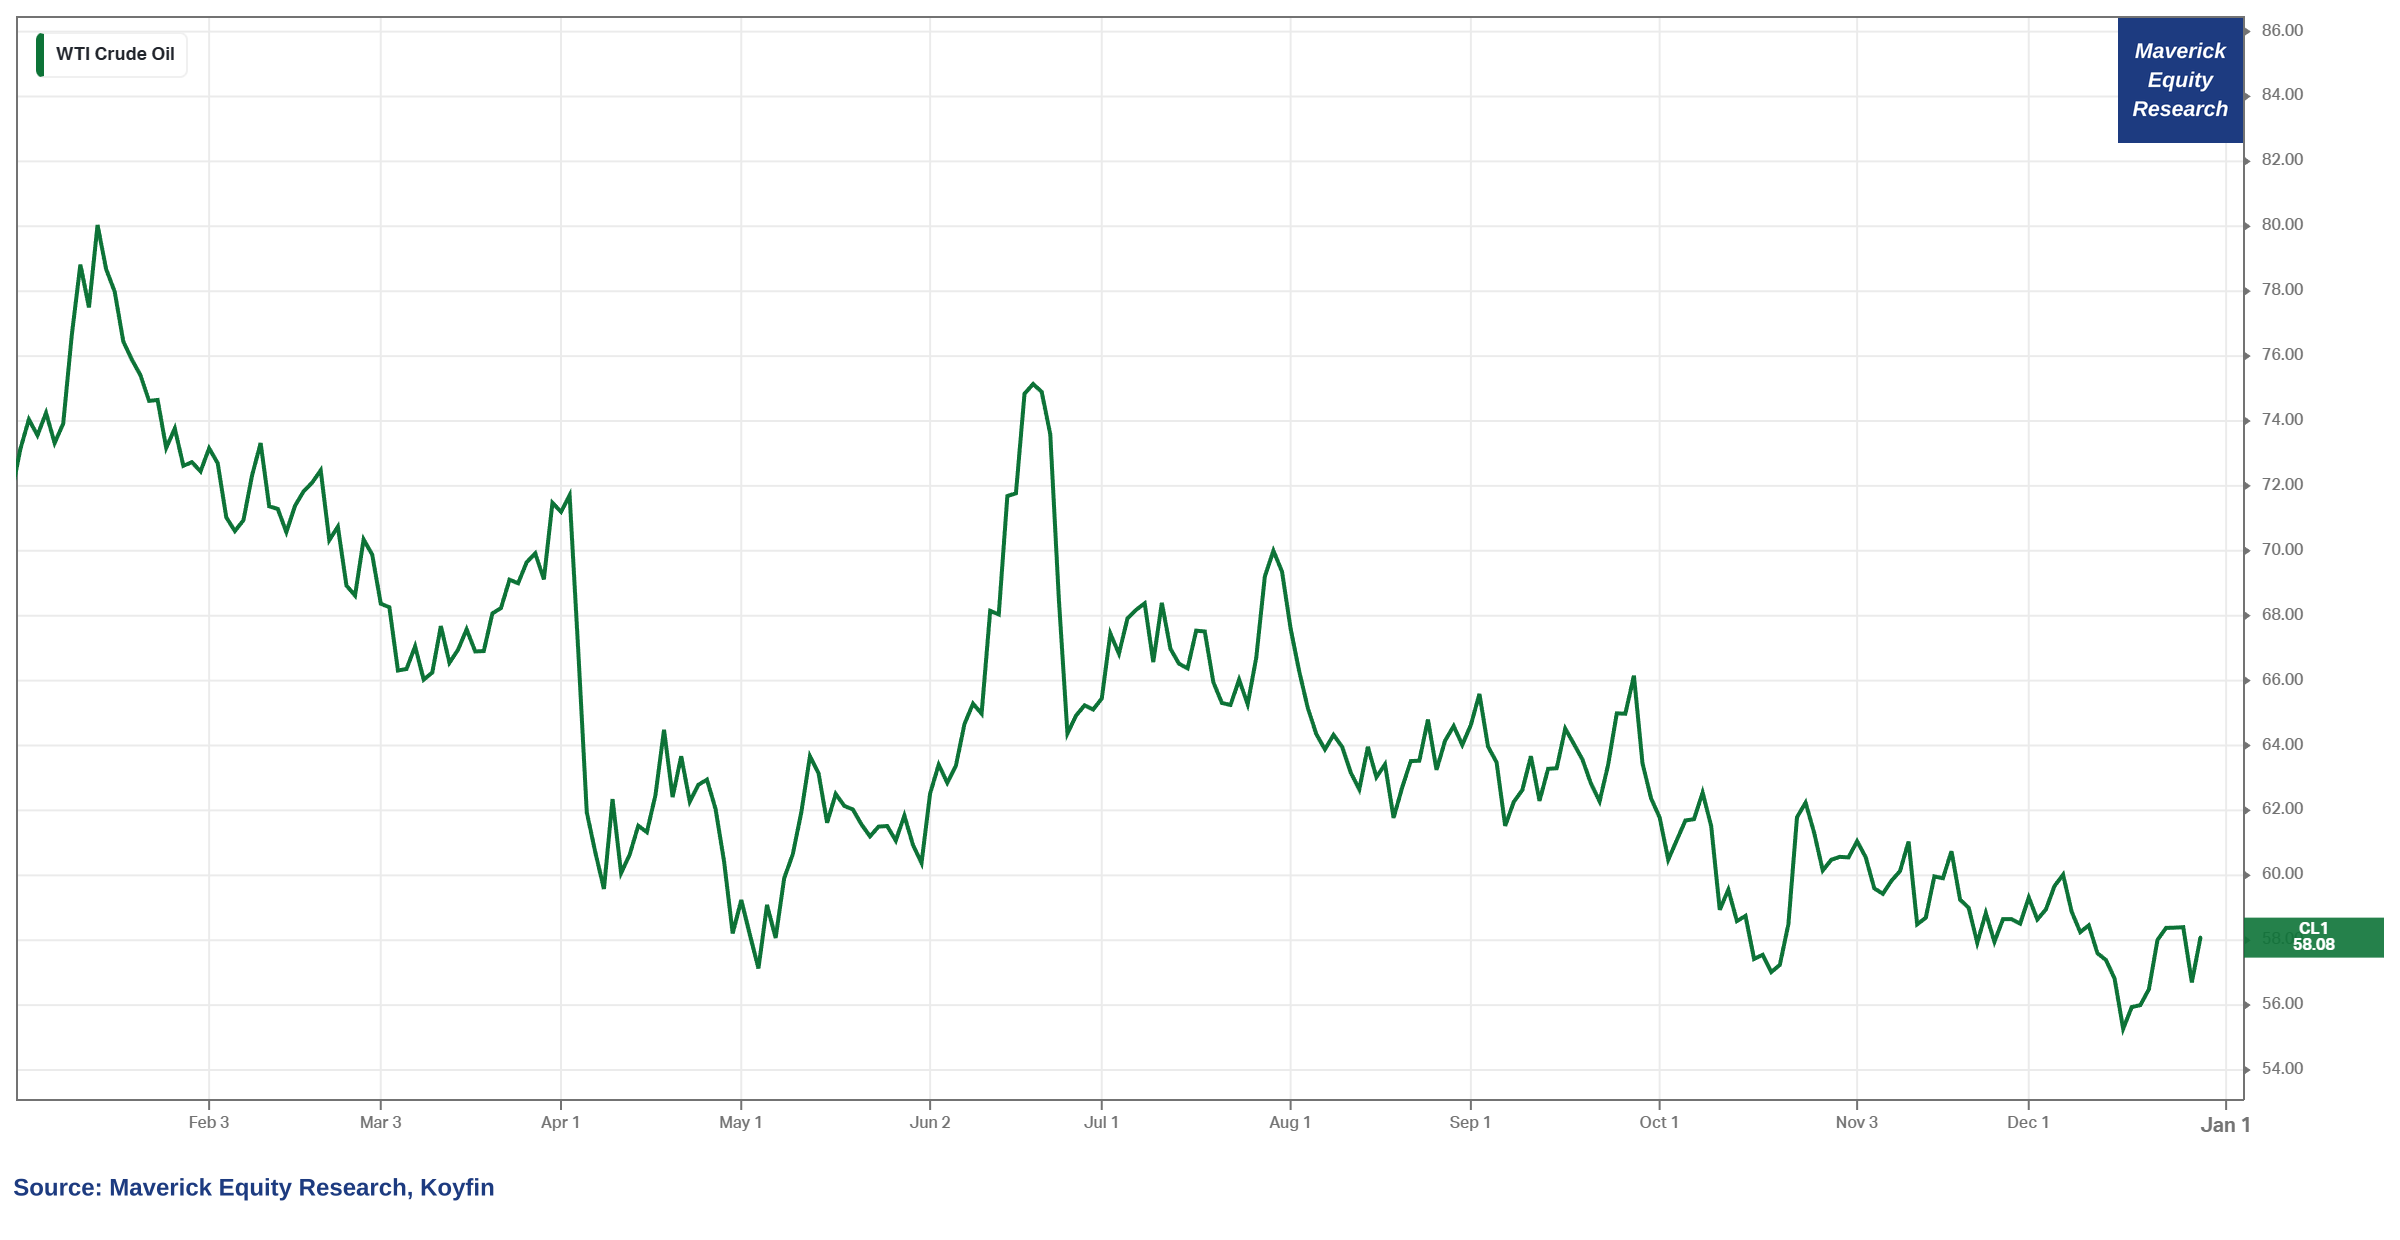
Oil, you ‘crude’ oil, the commodities underperformer of 2025!
👉 down -19.1% in 2025, quite surprising many …
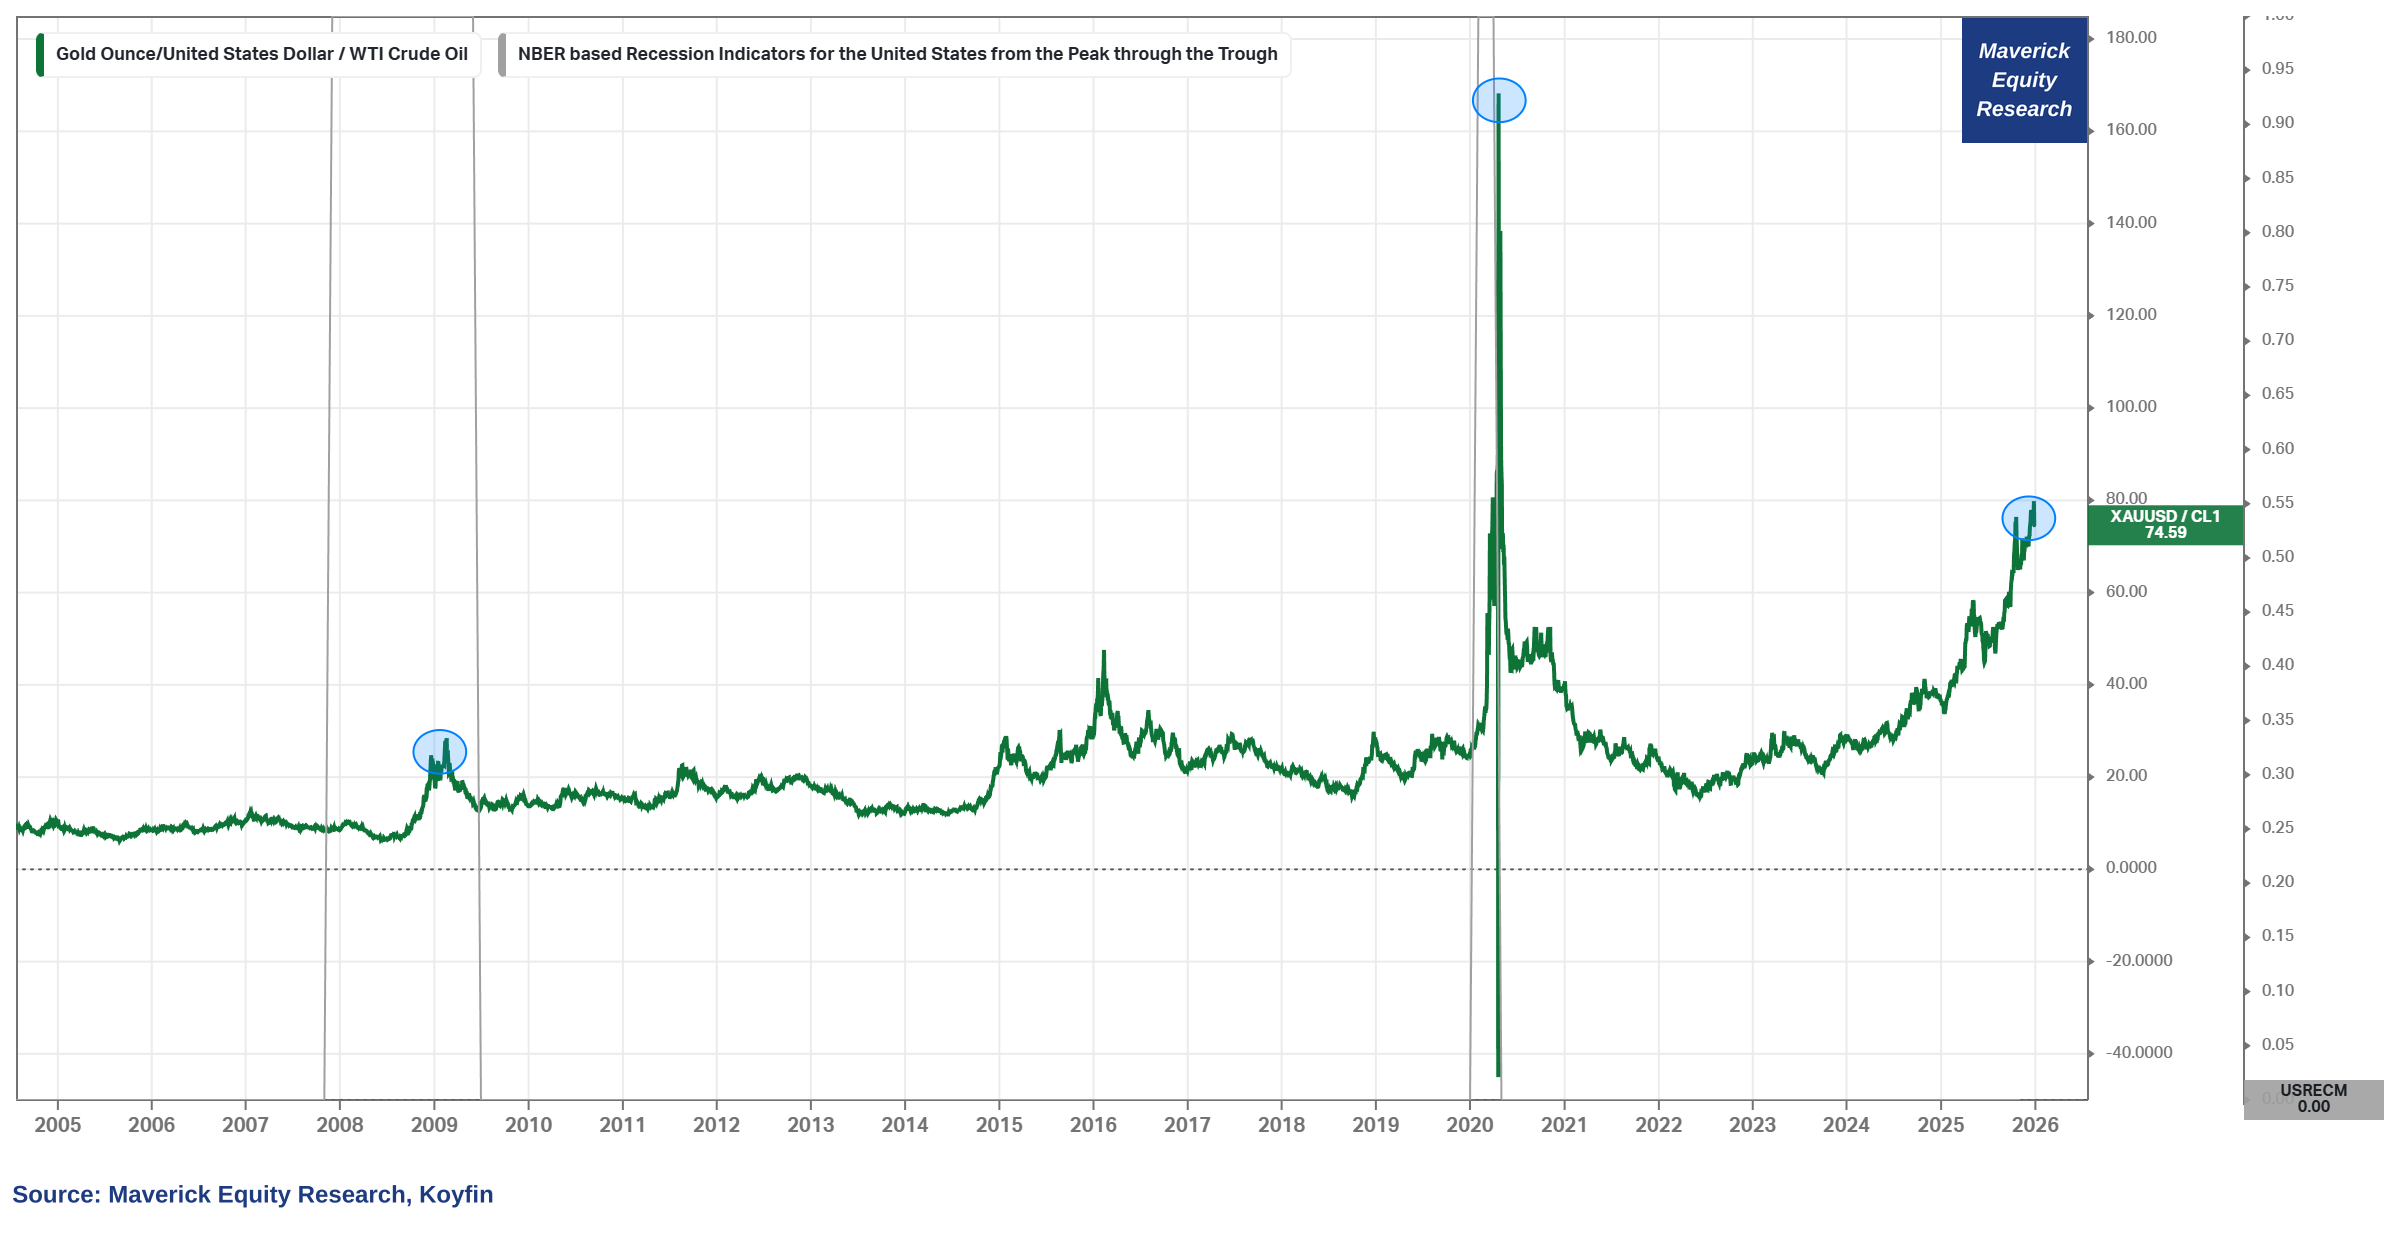
Gold to Oil ratio, quite a rare Maverick chart — every time there are big moves in Gold and/or in Oil, I like to make the ratio of the two and infer from there various insights and forward looking ideas:
👉 Gold-to-Oil ratio = 74.6, and the classical interpretation when the ratio surges is that of a rather warning signal (grey periods = recessions):
rising gold prices reflecting growing fear and risk aversion
while conversely a dropping price in Oil indicating weak demand, aka weak confidence in the global economy
👉 I actually think “It Is Different This Time” and the situation is not that bad: there are different variables at play this time around which will be covered in the future
📊 Crypto
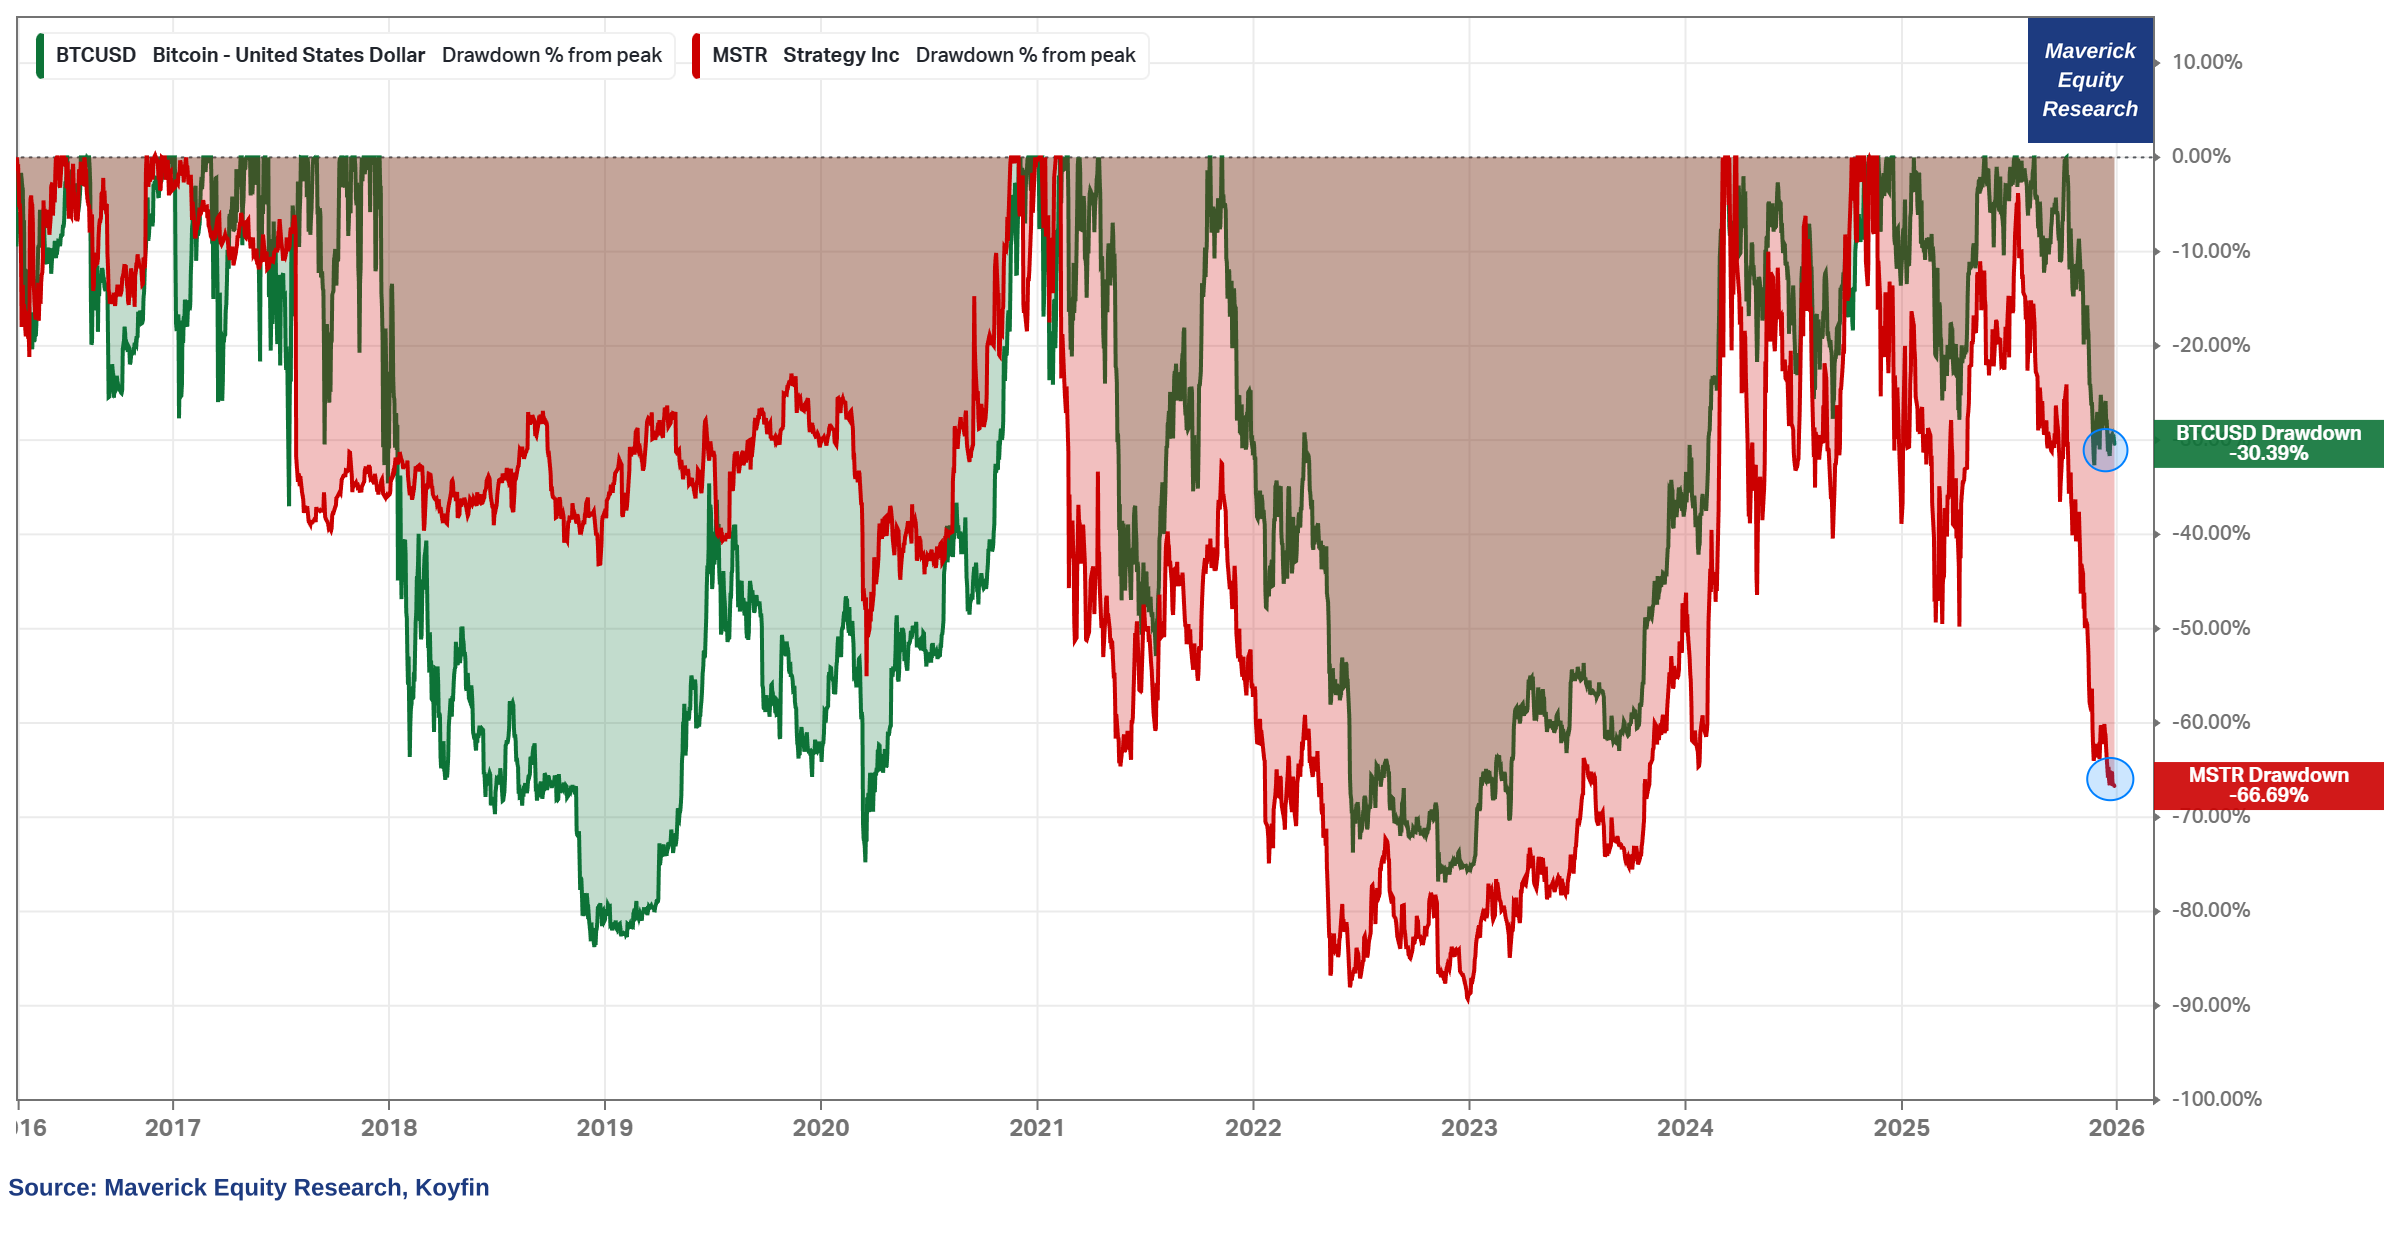
One of the biggest disappointments in 2025 is Bitcoin and its so called ‘treasury company’ MicroStrategy( MSTR). The “Bitcoin & MicroStrategy symbiosis“ chart:
👉 Bitcoin -30.39% drawdown
👉 MicroStrategy -66.69% drawdown
👉 complementary, since July: Bitcoin -27%, Strategy -65%
👉 MicroStrategy filed to change its name yet again, new name = Strategy. I wonder why? I mean when one has a great strategy, why change the name so often? 😉
All in all, 2 takeaways:
👉 how many times we heard in 2025 “Bitcoin to 200k? 500k 1 million?“. The easiest way to get attention is to make outlandish claims and targets. Similarly to people that shout about 100-baggers etc … most of them are grifters, the left tail of humanity!
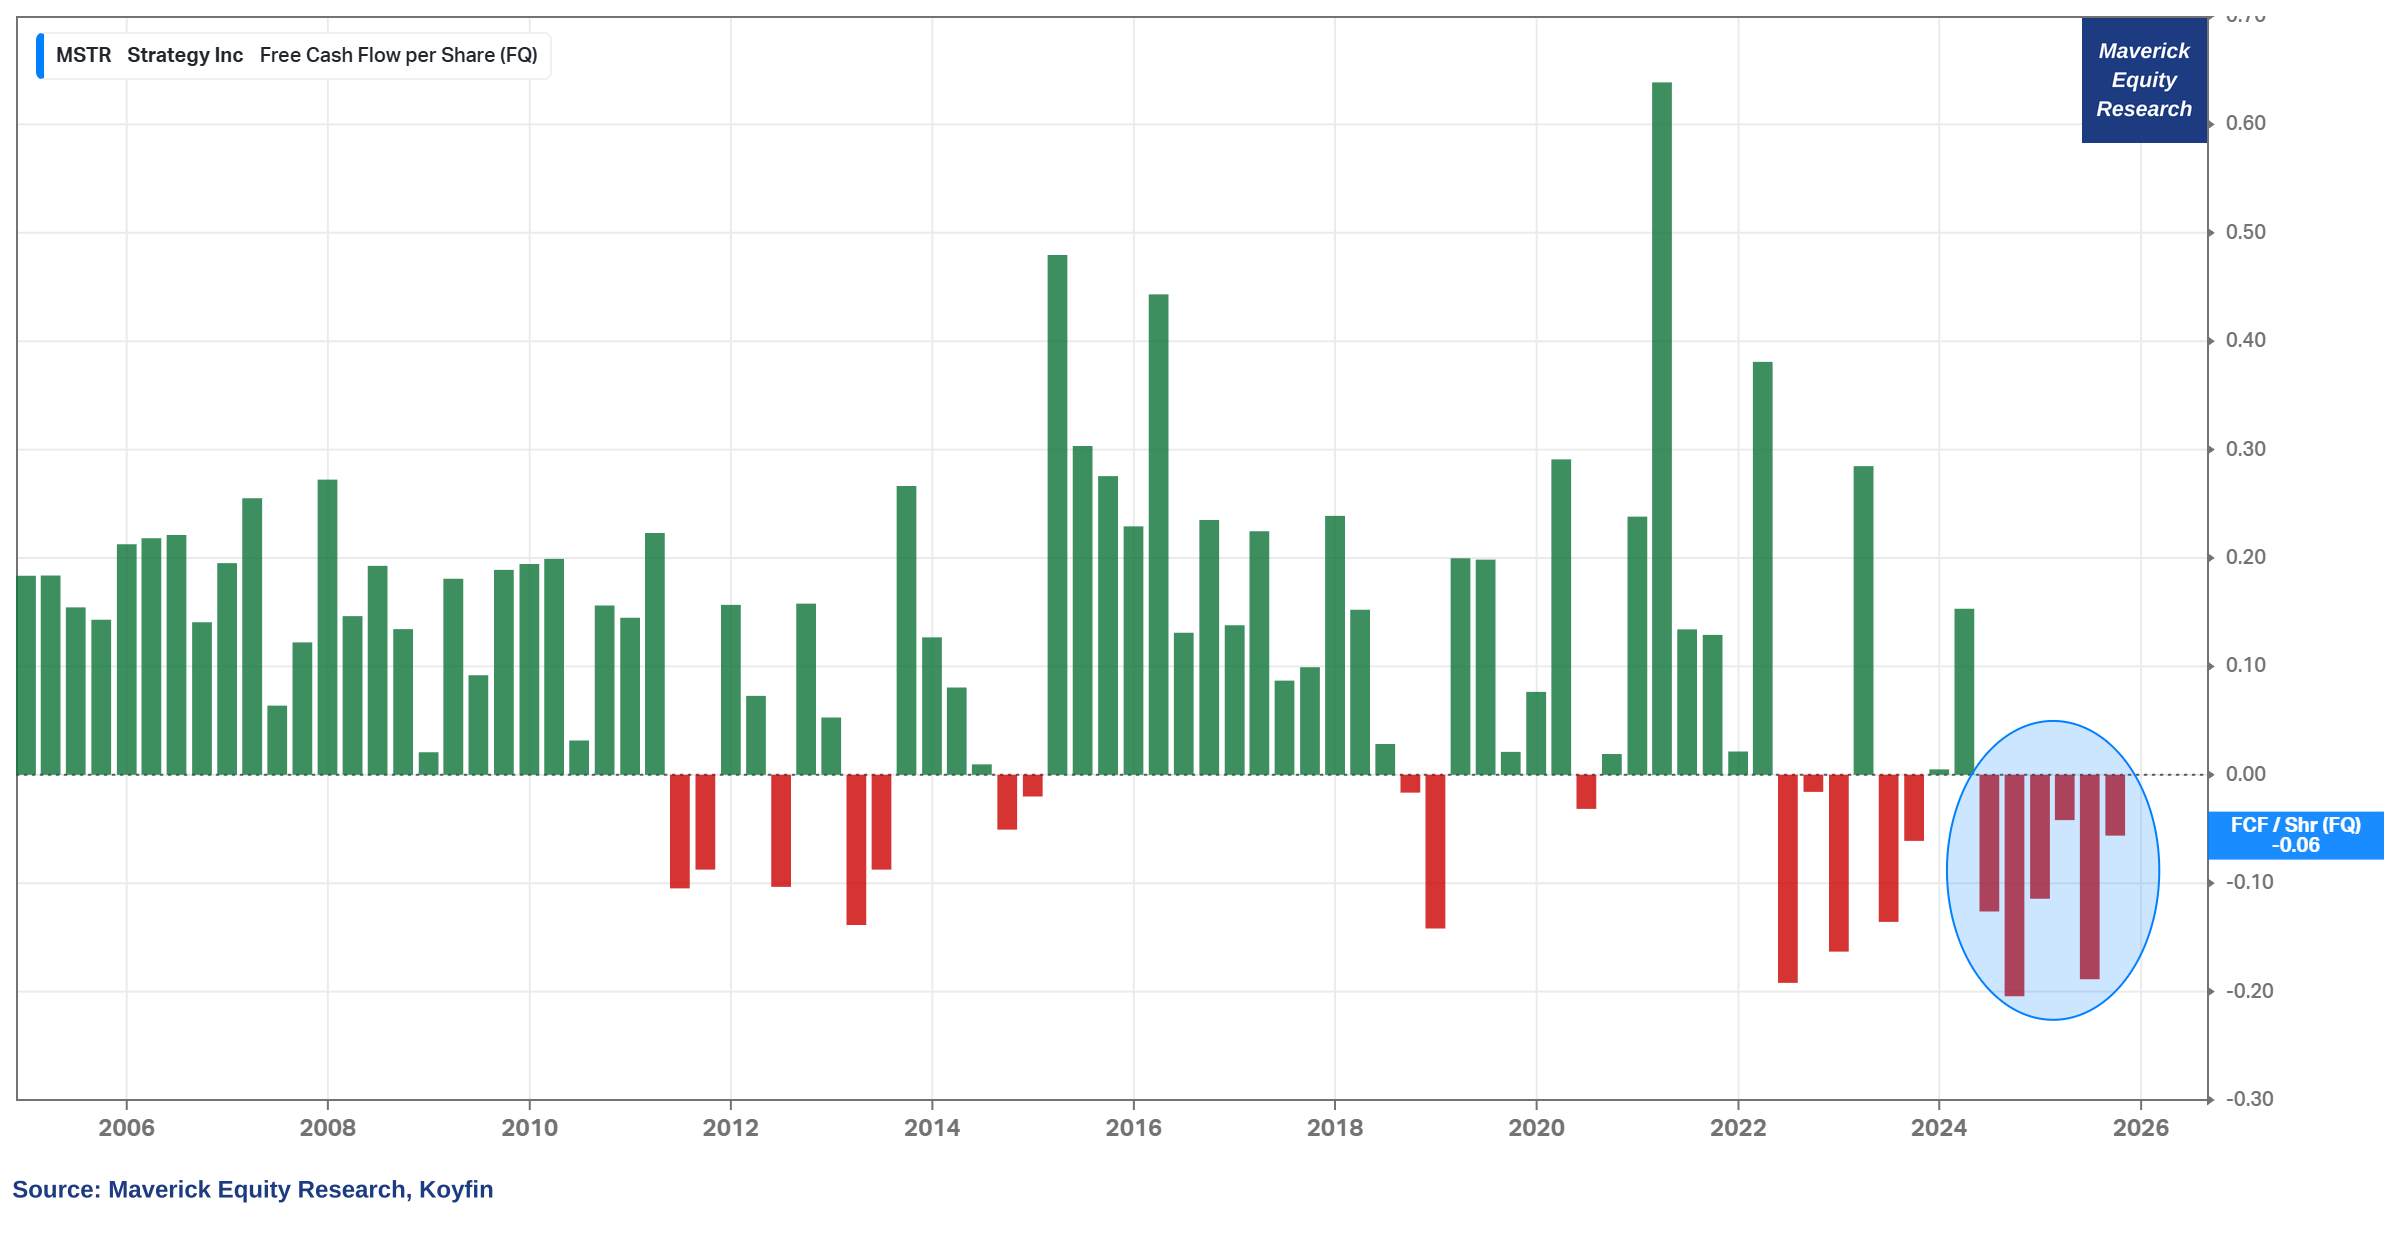
👉 if one really wants to own bitcoin, why would anyone get bitcoin exposure via MSRT? That is still beyond me — well, actually I know: it is mainly because of the ‘yield’ which lures investors … but I also know a thing or two about the yield and the following MEME says it all 😉

MicroStrategy-Bitcoin case will very likely get historical and a textbook use case. Hence, I might do a Maverick Special report on it! Stay tuned!
👉 until then, just check the Micro-Strategy Free Cash Flow / Share …
✍️ The Bitcoin & MicroStrategy Symbiosis
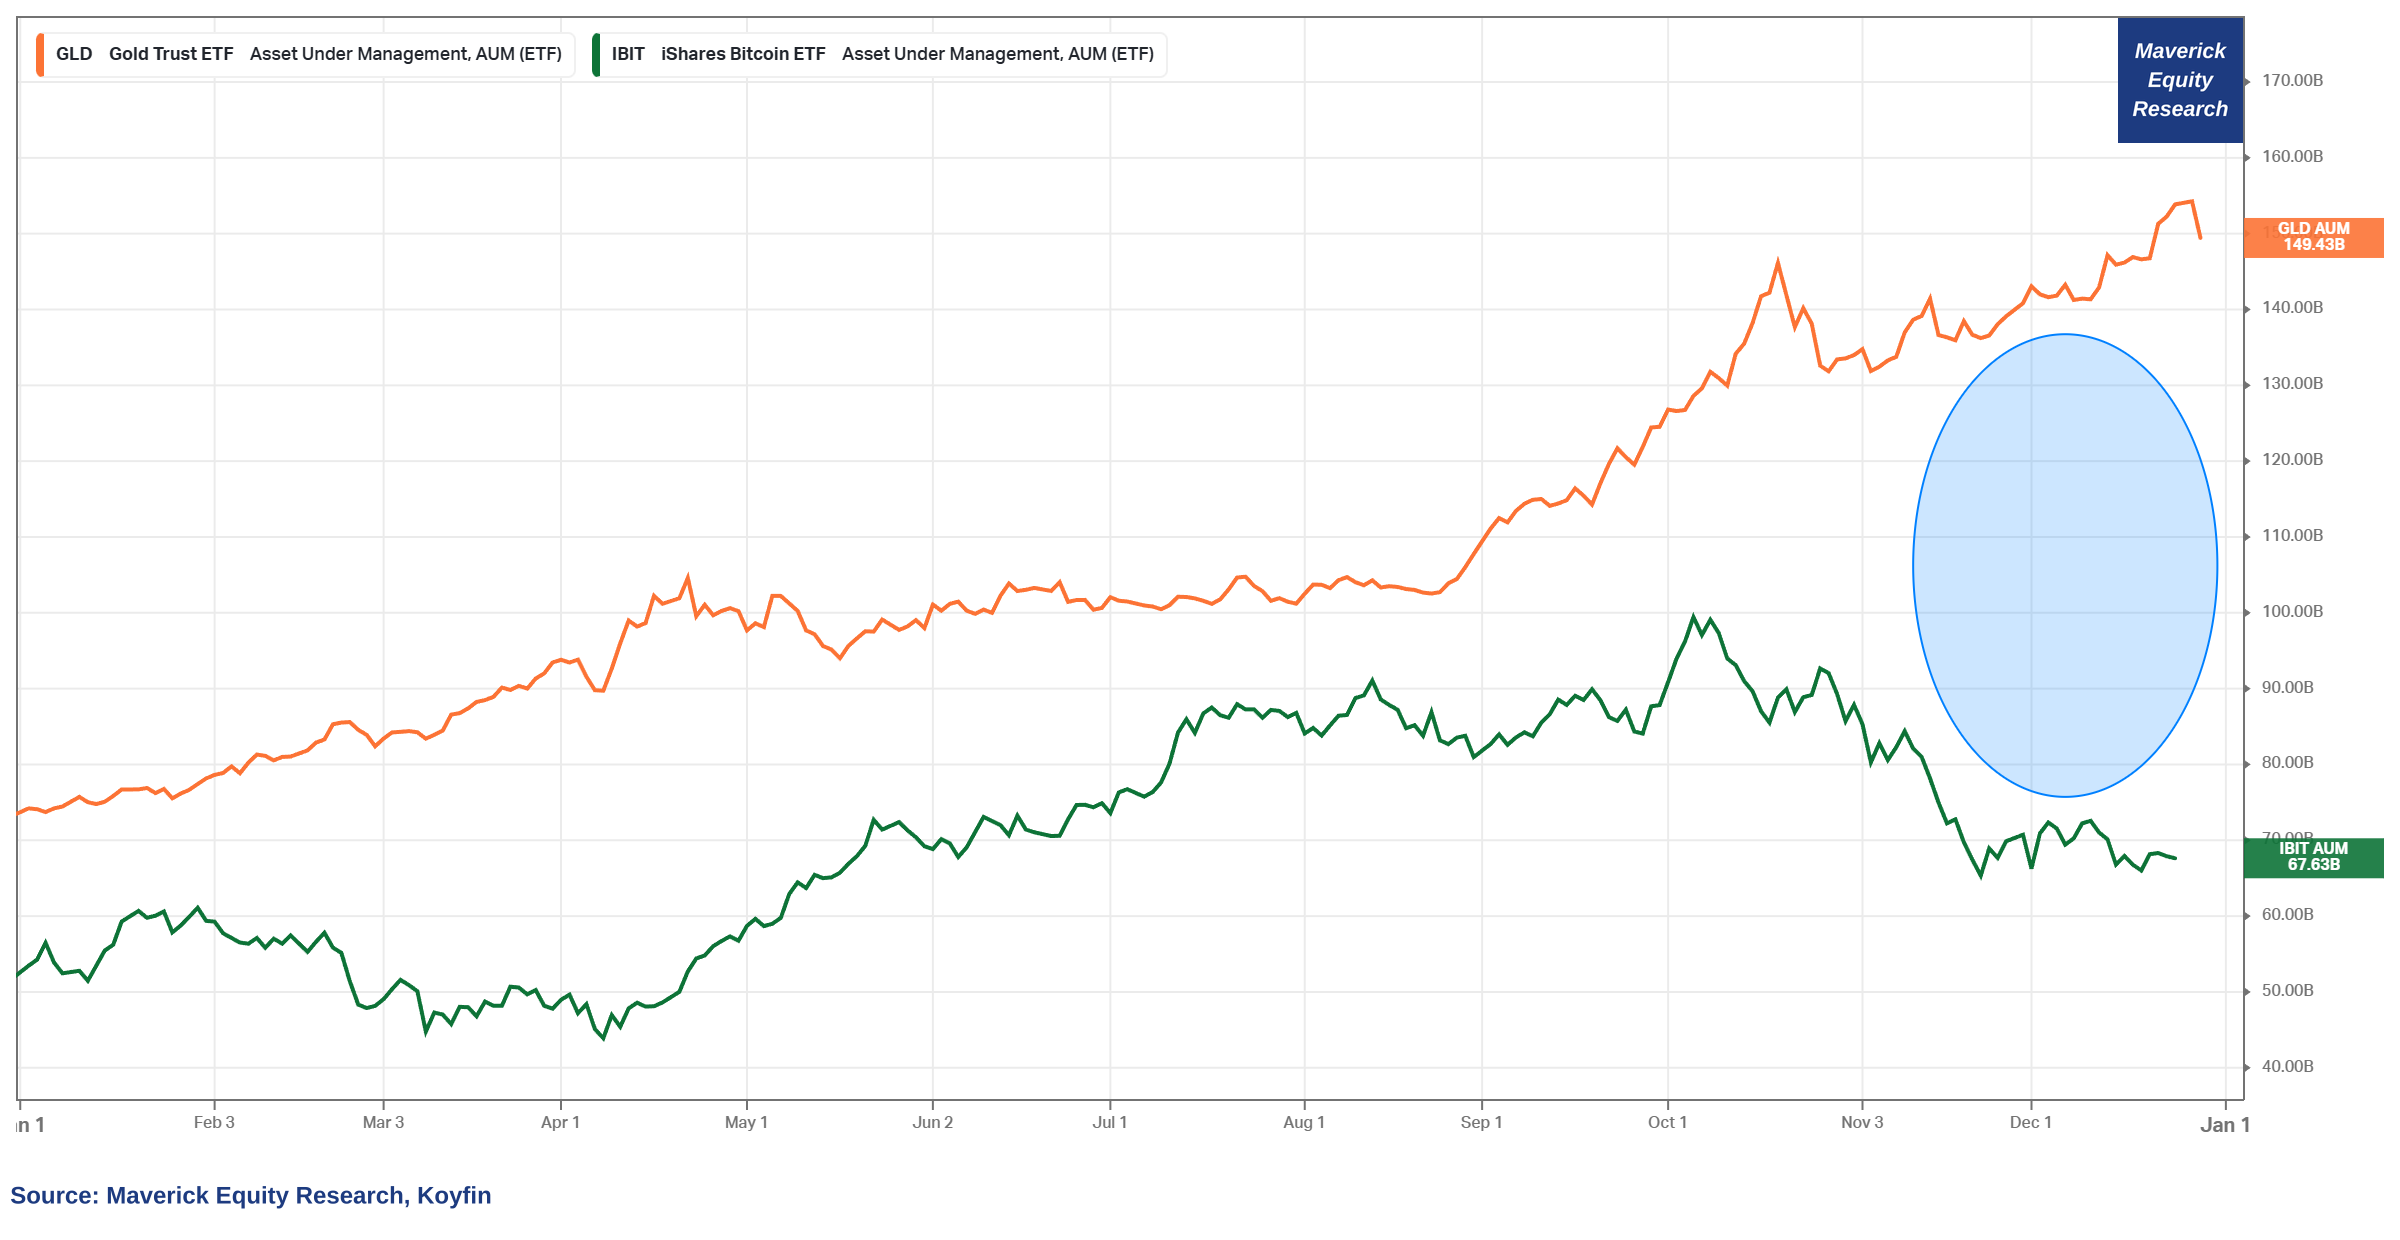
Last but not least, Bitcoin and Gold financial flows via their top dedicated ETFs:
👉 after a great start in 2024, Blackrock’s IBIT spot Bitcoin ETF is recording heavy outflows, whereas world’s largest Gold ETF GLD with massive inflows
👉 recall that neither Gold nor Bitcoin carry any yield and have no intrinsic value, they are mainly driven by narratives and flows
👍 Bonus: +200,000 views Maverick Tweet of the Year — Nasim Taleb retweet!
👉 +200,000 views for this Maverick tweet which was quoted/commented also by the legendary Nassim Taleb … so great from his side and I thank him a lot!
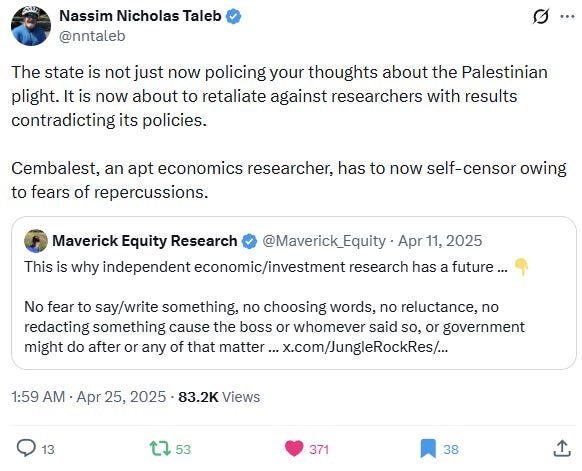
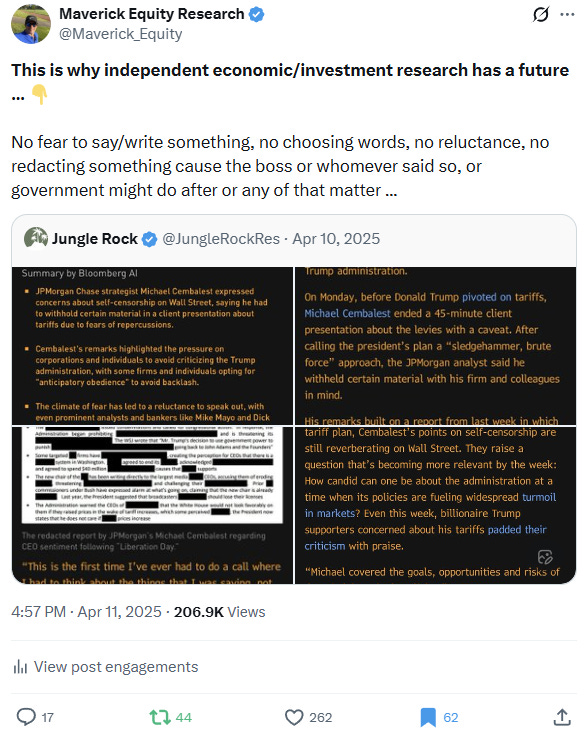
👉 common sense is not so common, conflicts of interest are too common, hence independent investment and economic research for the win!
👉 such an important topic that I did write an entire dedicated post about it:
✍️ Why Independent Investment and Economic Research = Paramount Nowadays!
‘If something is nonsense, you say it and say it loud. You will be harmed a little but will be antifragile — in the long run people who need to trust you will trust you.’
Nassim Nicholas Taleb: Commencement Address, American University in Beirut
Research is NOT behind a paywall and NO pesky ads here unlike most other places!
Did you enjoy this by finding it interesting, saving you time and getting valuable insights? What would be appreciated?
Just sharing this around with like-minded people, and hitting the 🔄 & ❤️ buttons!
That’ll definitely support bringing in more & more independent investment research: from a single individual … not a corporate, bank, fund, click-baity media or so … !
Like this, the big positive externalities become the name of the game! Thank you!
Have a great day! And never forget, keep compounding: family, friends, hobbies, community, work, independence, capital, knowledge, research and mindset!
Have a great 2026!
With respect,
Your Maverick 👋 🤝

best writing respects the reader’s time,and readers's feedback reward writer's time! HAPPY NEW YEAR
Amazing work as usual