
✍️ Amazon vs Walmart, Retail Sales & Banks + Investment Themes by Decades = Maverick Equities Charts of the Week #56
5 + 1 Maverick Charts that say 10,000 words

Dear all,
5 + 1 cherry picked Maverick Charts of the week say 10,000 words or more = the ‘How’!
Table of contents = the ‘What’! Executed in a succinct manner with the aim of a high density of ideas, because the best writing respects the reader’s time:
📊 Maverick Charts: Amazon VS Walmart, Retail Sales & Banks
📊 Bonus: Investment Themes by Decades
Objective: both data-driven insights + valuable food for thought = the ‘Why’!
📊 Maverick Charts: Amazon VS Walmart, Retail Sales & Banks
Valuation in Retail Sales diverging — Walmart (WMT) bricks & mortar with 82% in-store sales & 18% online VS Amazon (AMZN) with 95% online & 5% in-store):
👉 Walmart with a bonkers 45.8x forward P/E as it hit $1 trillion market capitalisation — also now trading at 3x its average (pre-2024) EV/EBIT multiple and 65x P/FCF for a business that grew revenues less than 4% CAGR for the last decade
👉 Amazon with a colling 27.4x forward P/E
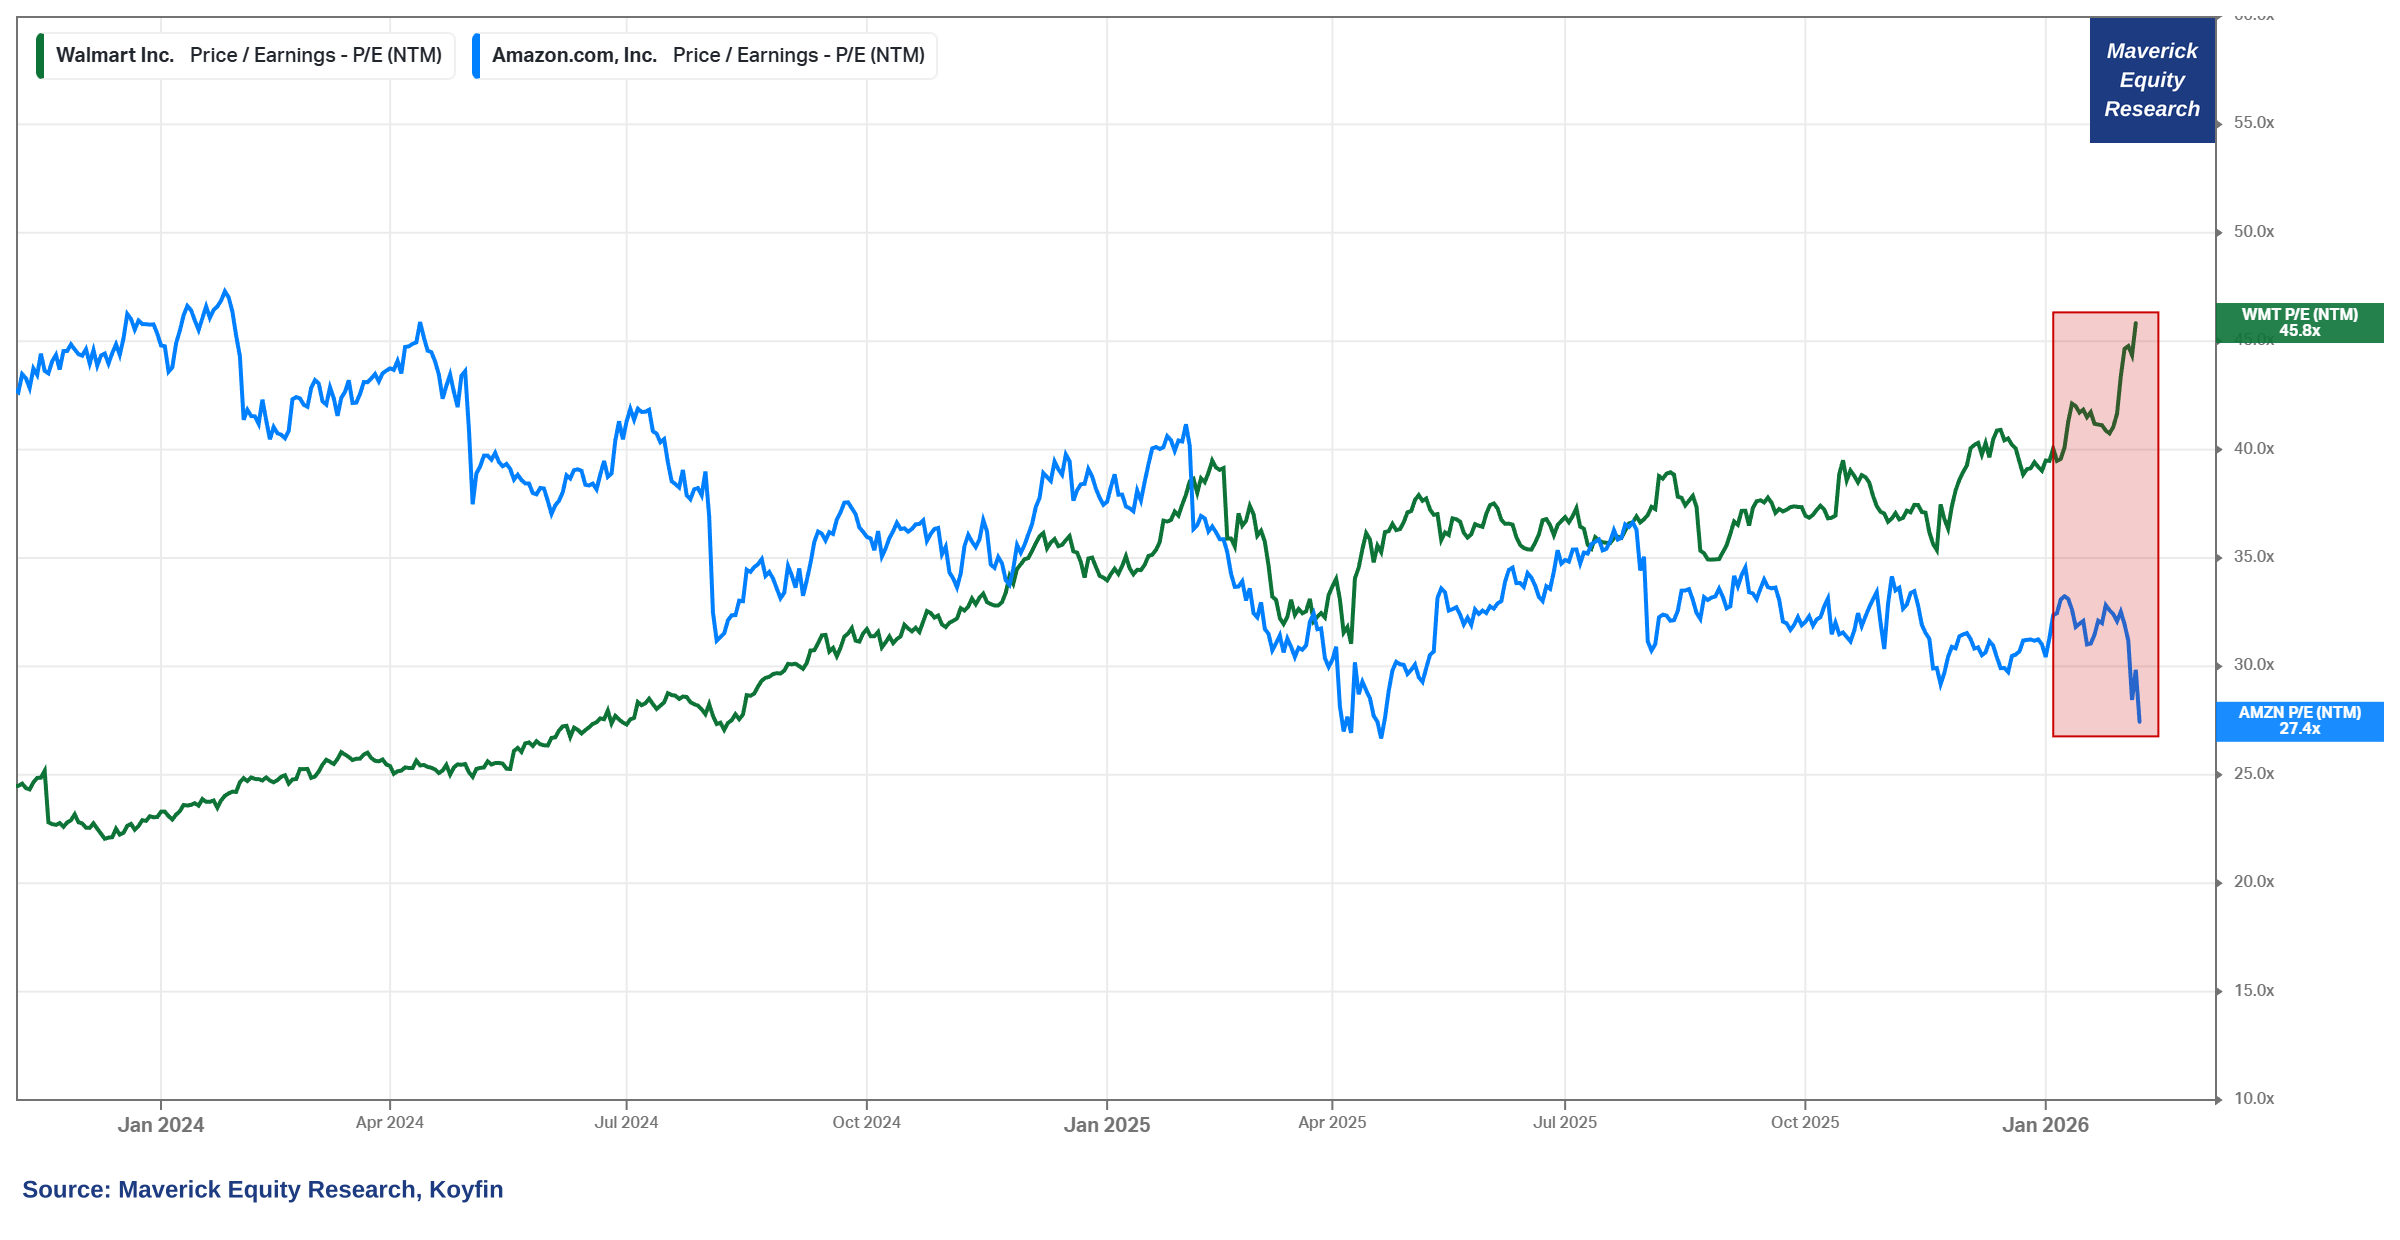
Quite a divergence, isn’t it? The big question: will these lines cross again? Yes …
Let’s check Revenues, quarterly since 1996 for a 30-years span :
👉 25 years ago: Walmart revenue 47x larger than Amazon
👉 20 years ago: Walmart revenue 25x larger than Amazon
👉 15 years ago: Walmart revenue 8x larger than Amazon
👉 10 years ago: Walmart revenue 3x larger than Amazon
These days, specifically since Q3 2025: Amazon revenue > Walmart revenue, Amazon with materially bigger revenues: $213 vs $179 billion!
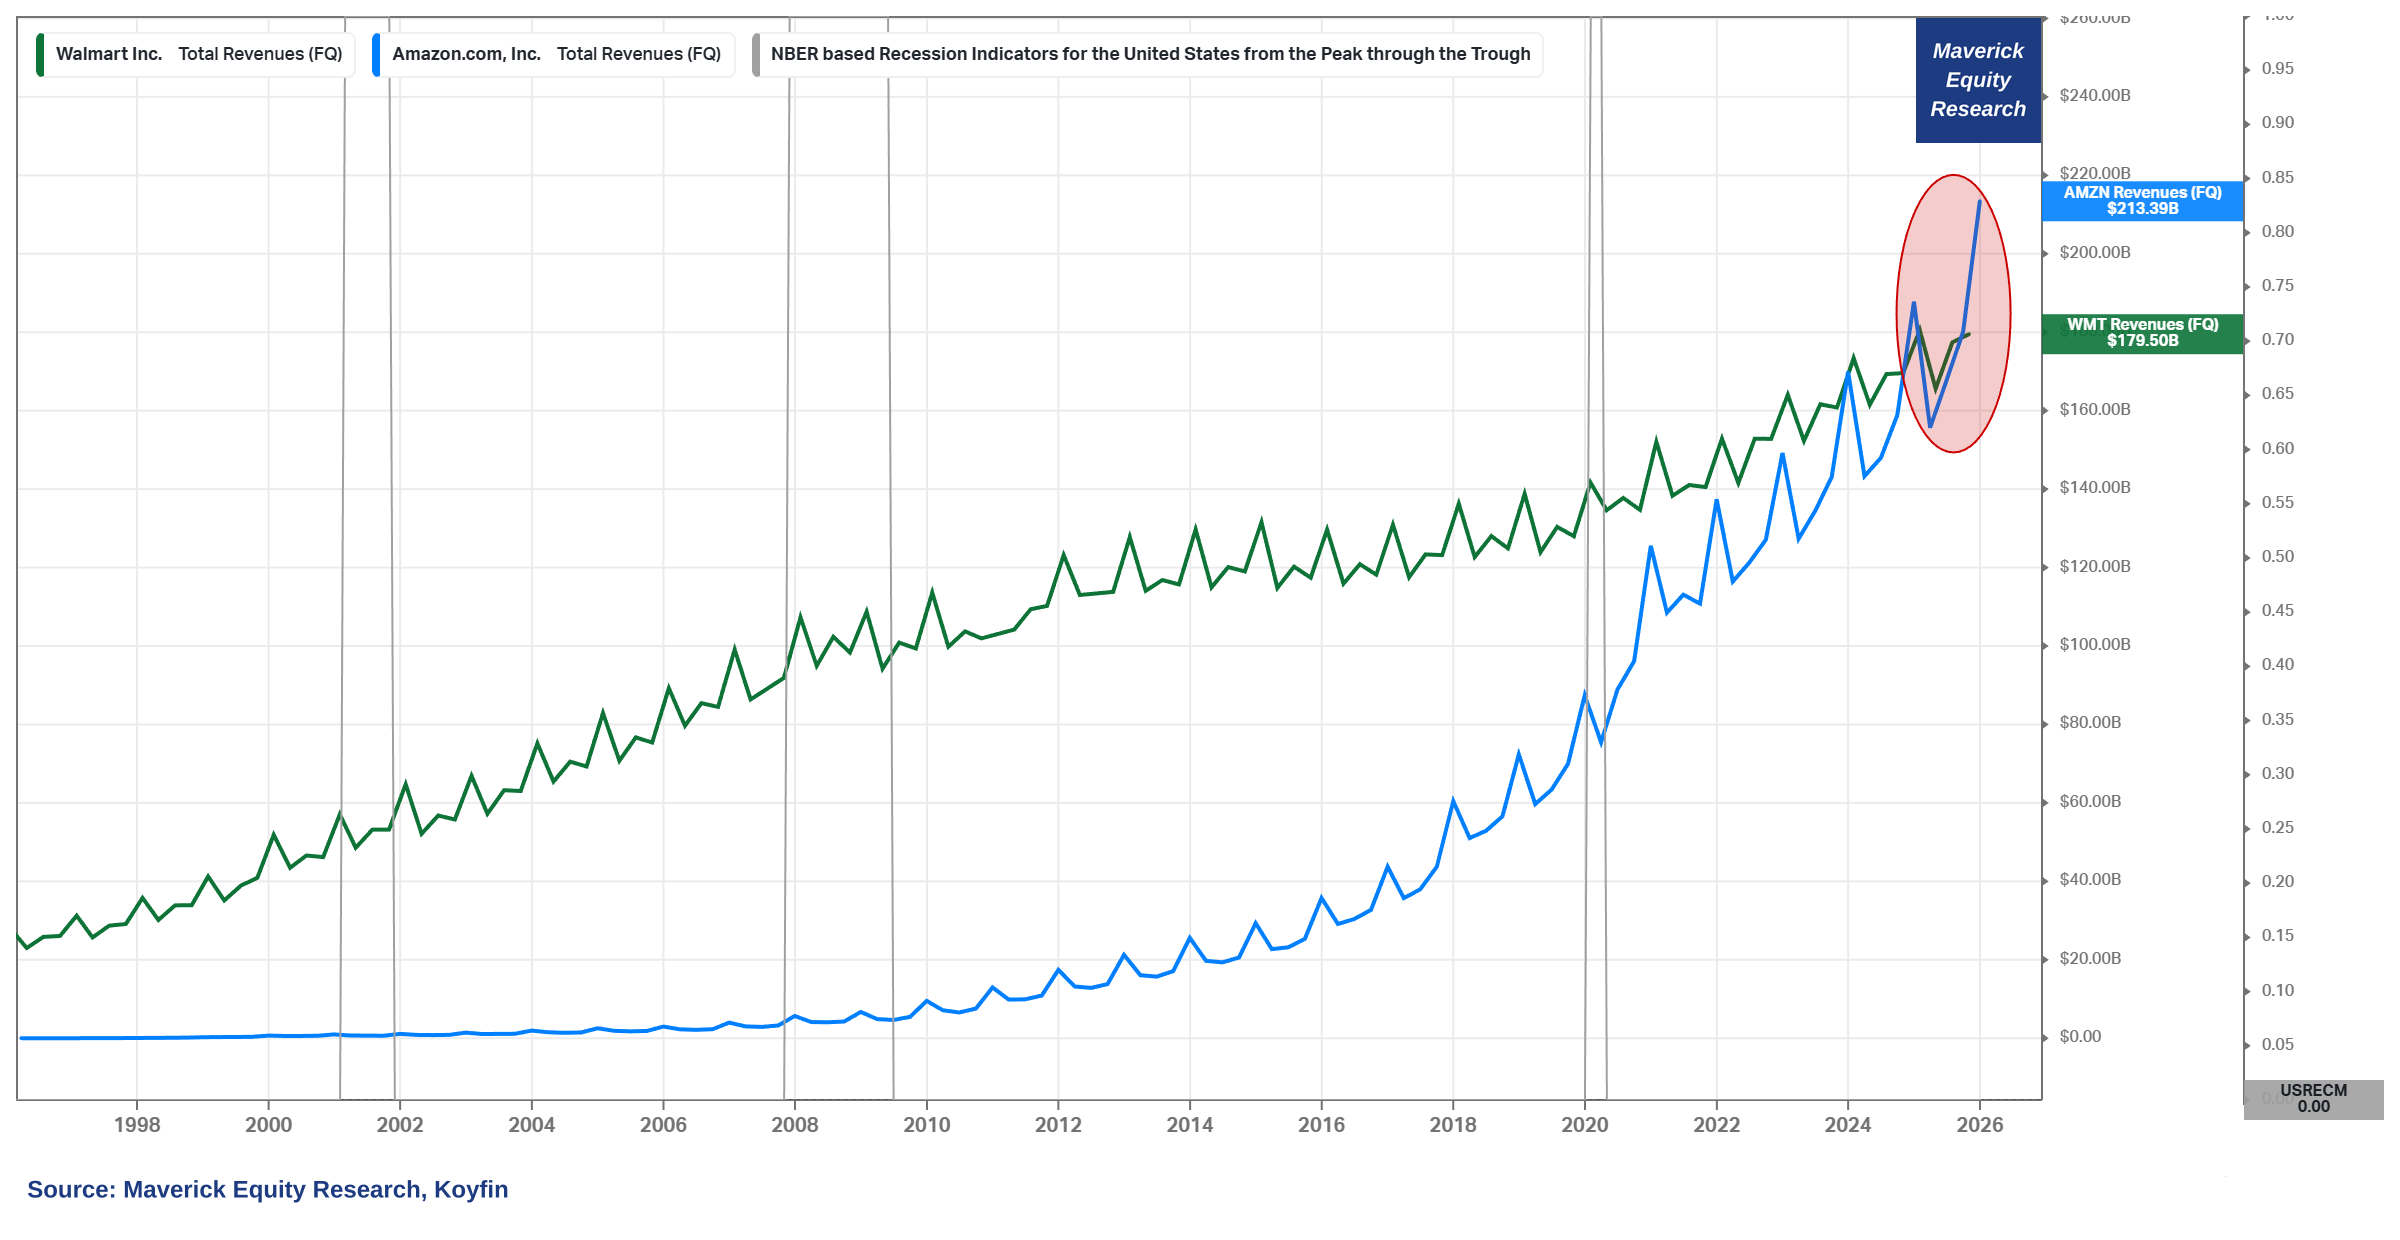
Amazon was and is not just scaling, but mostly building optionality, and that compounds beautifully across time, hence nowadays more Revenue sources!
👉 Amazon Web Services (AWS) is a monster way beyond their retail sales: around 69% of profits coming from it
👉 $129 billion revenue over the last 12 months was higher than the revenue of 469 companies in the S&P 500 … let that one sink in!
👉 simply put, AWS went from side project to the core profit engine
👉 then there is advertising, subscriptions, 3P Seller Services, all high margin!
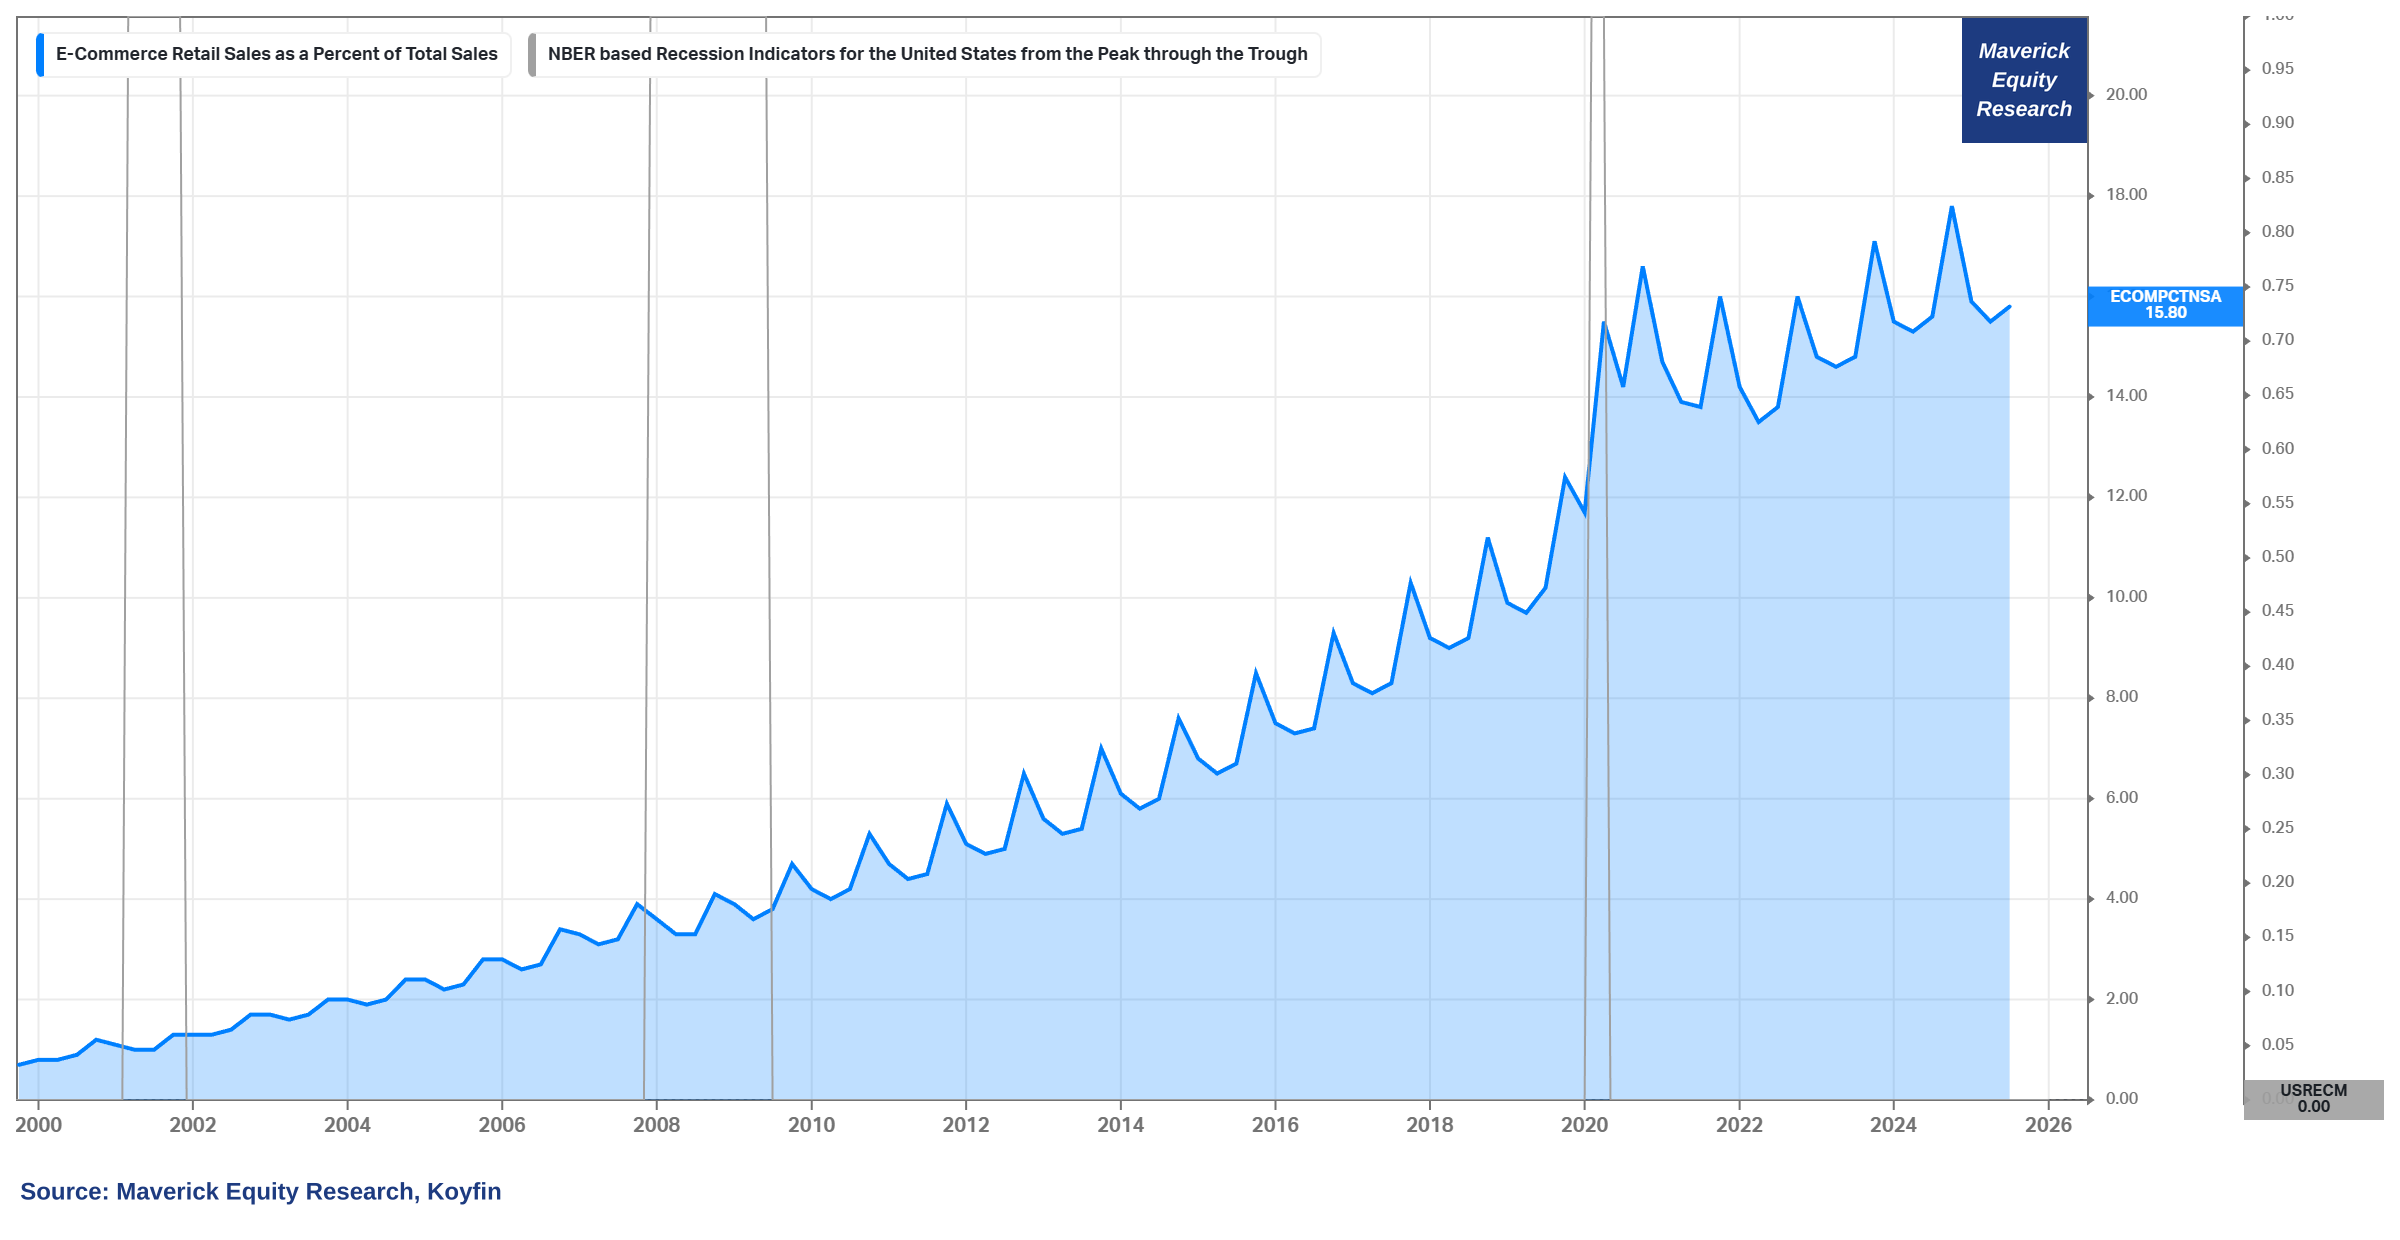
Retail Sales — Online vs In-Store sales as overall sector dynamics:
👉 E-Commerce Retail Sales as a % of Total Sales is quite on a trend since 1999
👉 currently at just 15.8%, way more room to capture more sales via the online selling
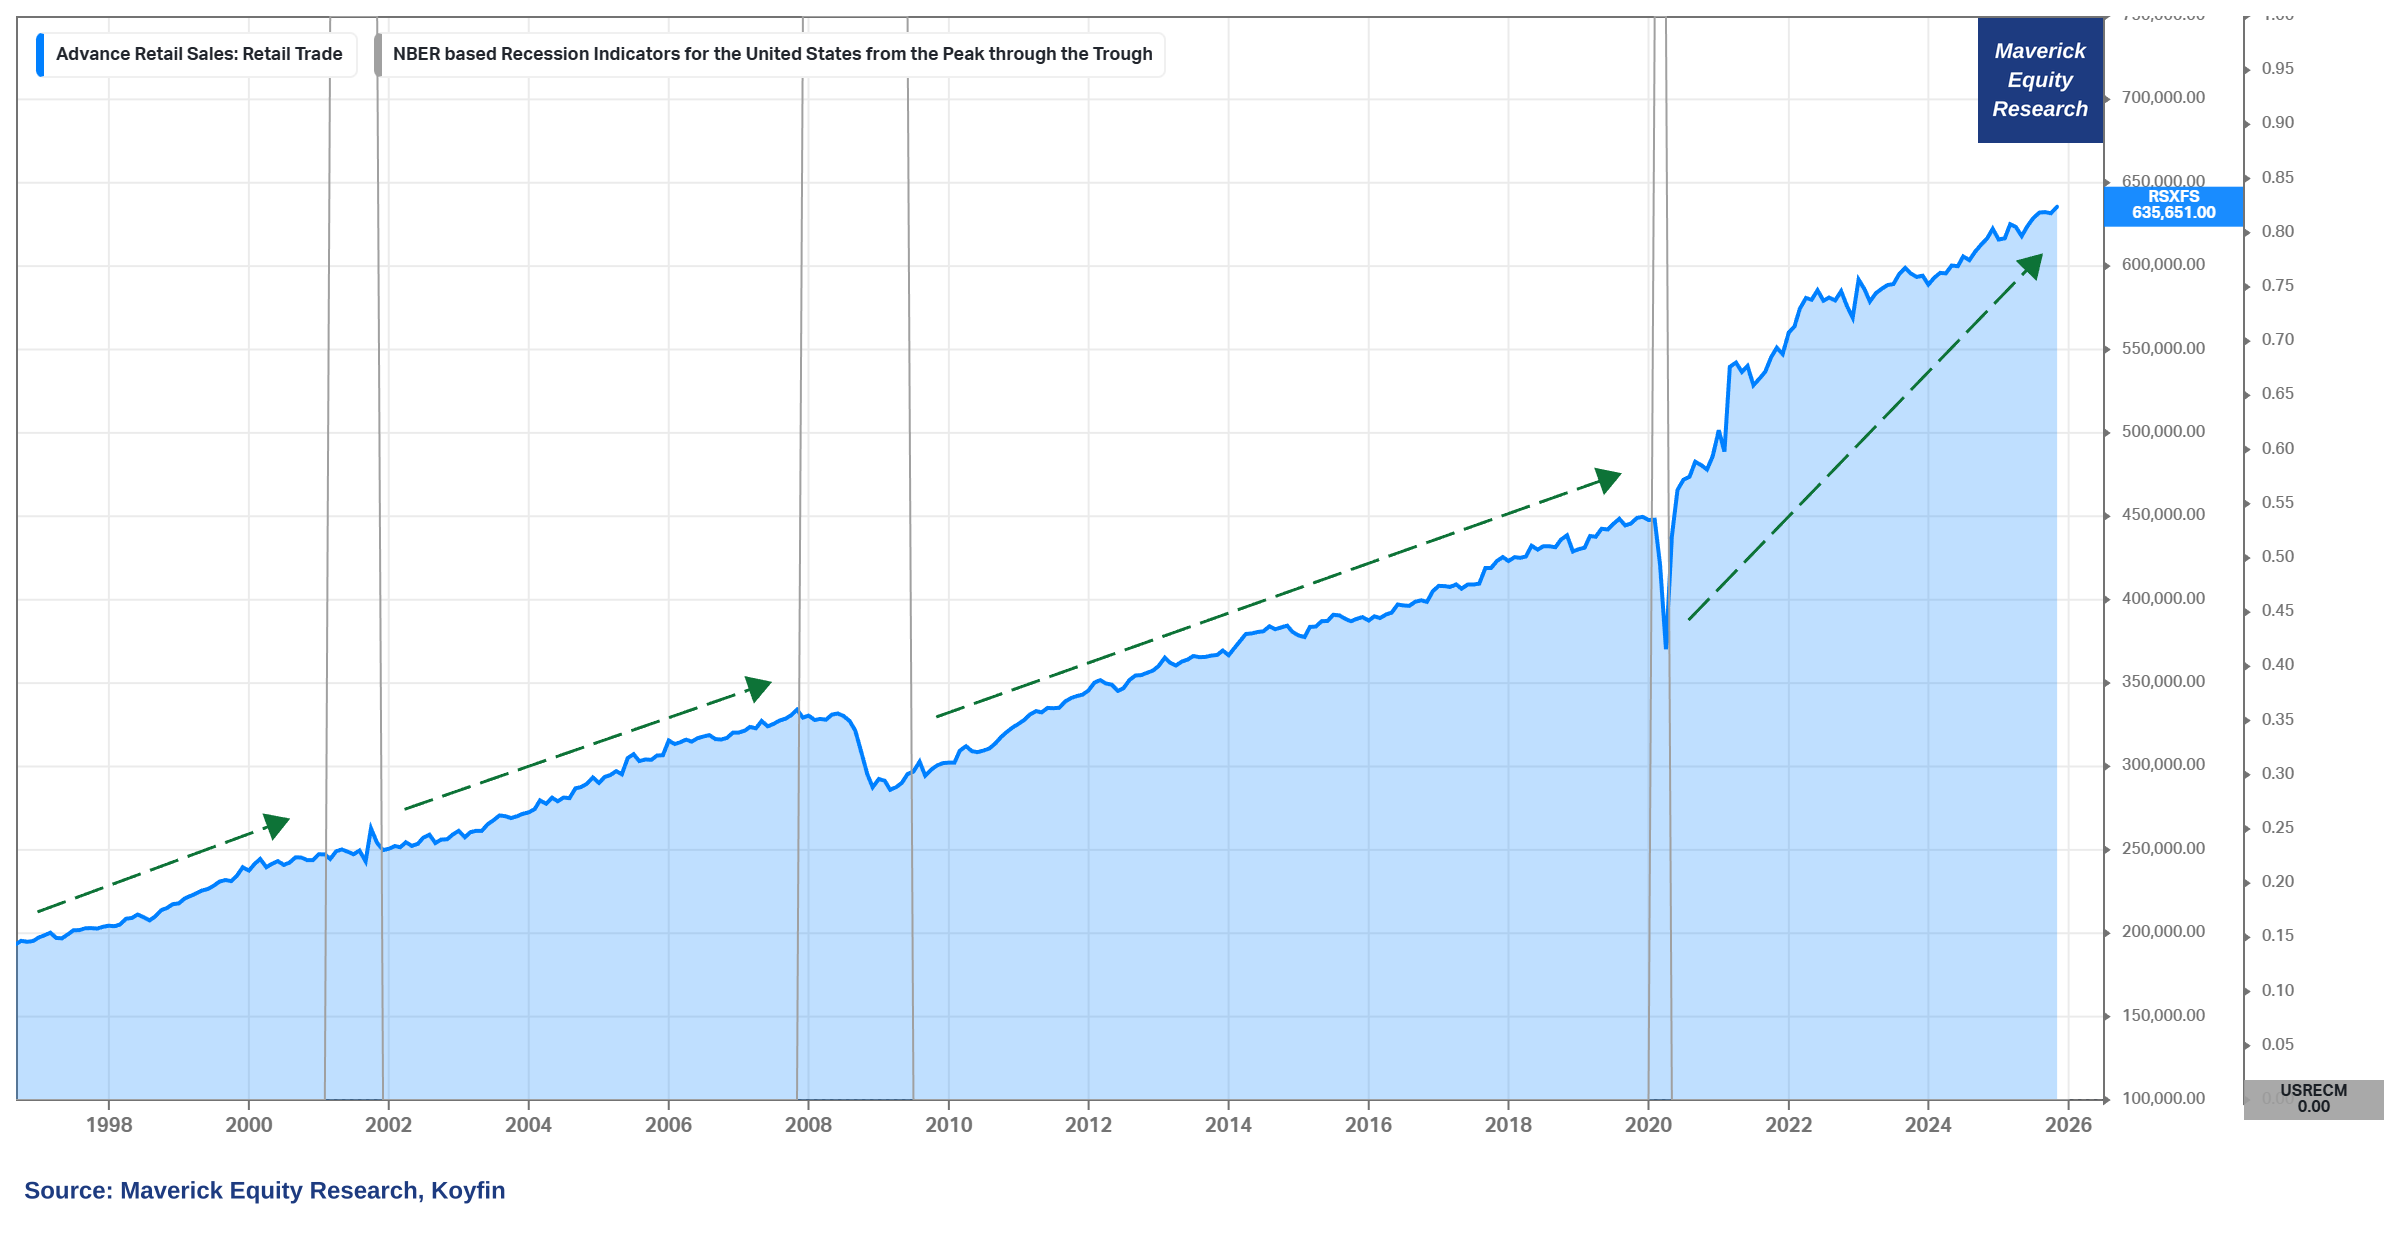
Wondering how are Retail Sales overall doing, aka the Consumer, aka ‘MainStreet’?
👉 up & up with the occasional bigger or smaller recession dips: +0.6% from the previous month for a $635.65 billion total
👉 never bet against for too long against the U.S. Consumer spending and overall entrepreneurship spirit and risk taking
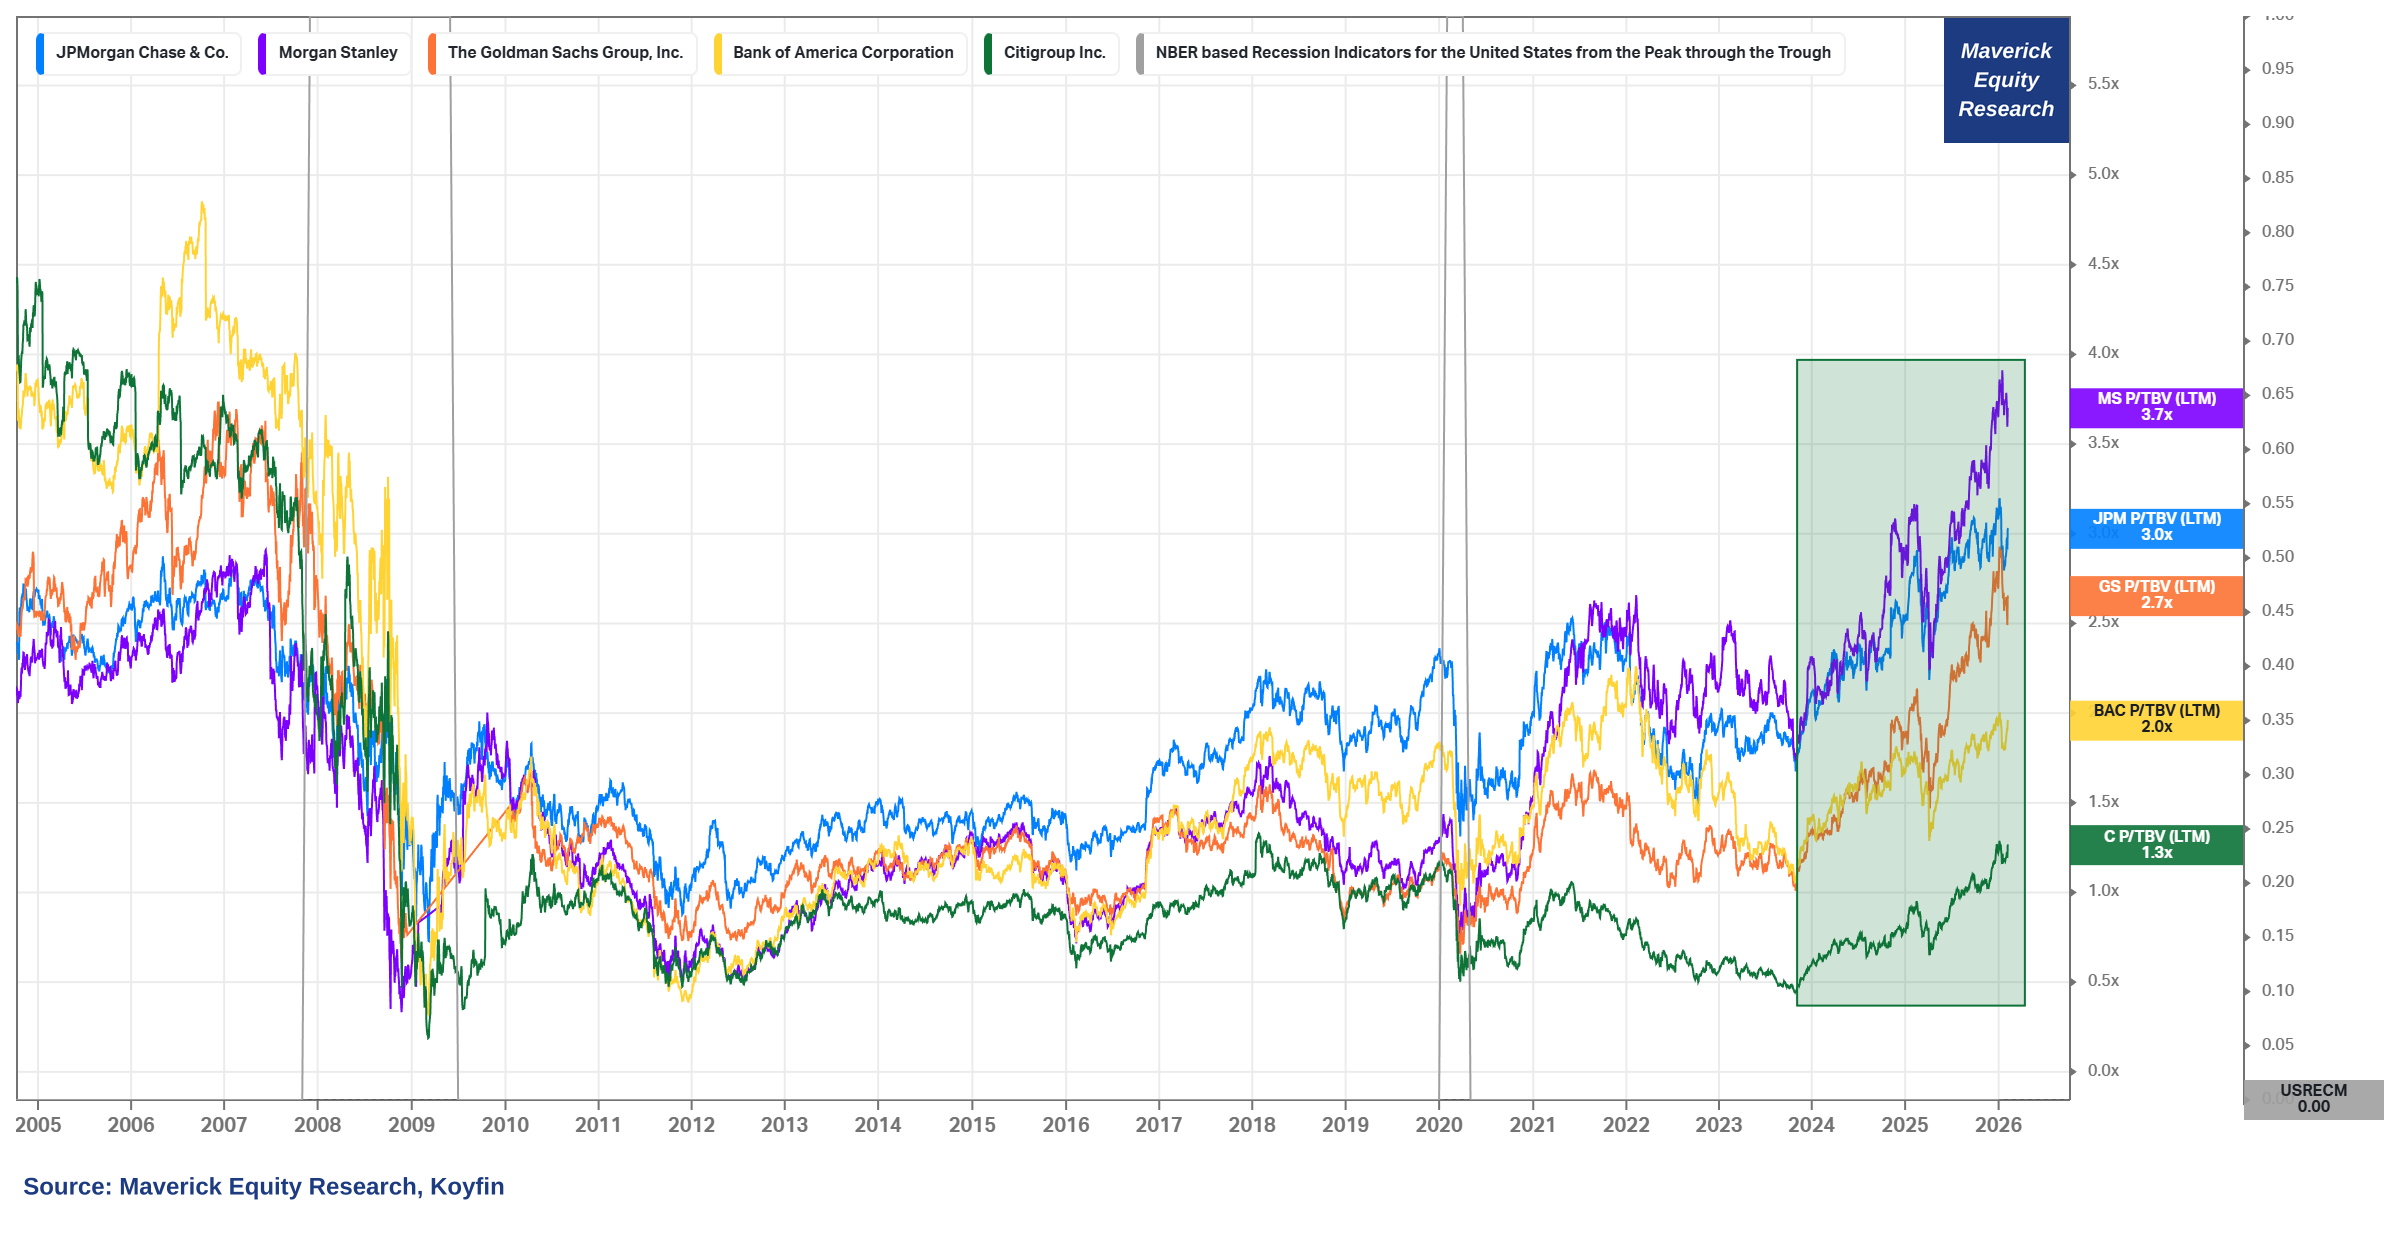
From ‘Main Street’ to ‘Wall-Street’, meaning from Retail Sales to mighty Banks:
👉 valuations on the rise via the Price/Tangible Book Value (TBV)
Morgan Stanley (MS) = 3.7x
JP Morgan (JPM) = 3.0x
Goldman Sachs (GS) = 2.7x
Bank of America (BAC) = 2.0x
Citi (C) = 1.3x
👉 MS at 3.7x & JPM at 3.0x are quite some …
👉 some people hate banks (partly deserved, especially for some aspects/culture), yet one does NOT want weak banks in any economy … just a casual reminder, a lot of the economy / assets sits on the balance sheet of banks
Overall, good signs also from the banking sector!
Among others, working these days also on a JP Morgan mini deep dive into their Corporate Finance actions: buybacks, dividends, lending, valuation — stay tuned!
✍️ J.P. Morgan (JPM): Buybacks, Price/Book, Dividends, ALM = Maverick Special #10
You can read all the previous Maverick Special reports here.
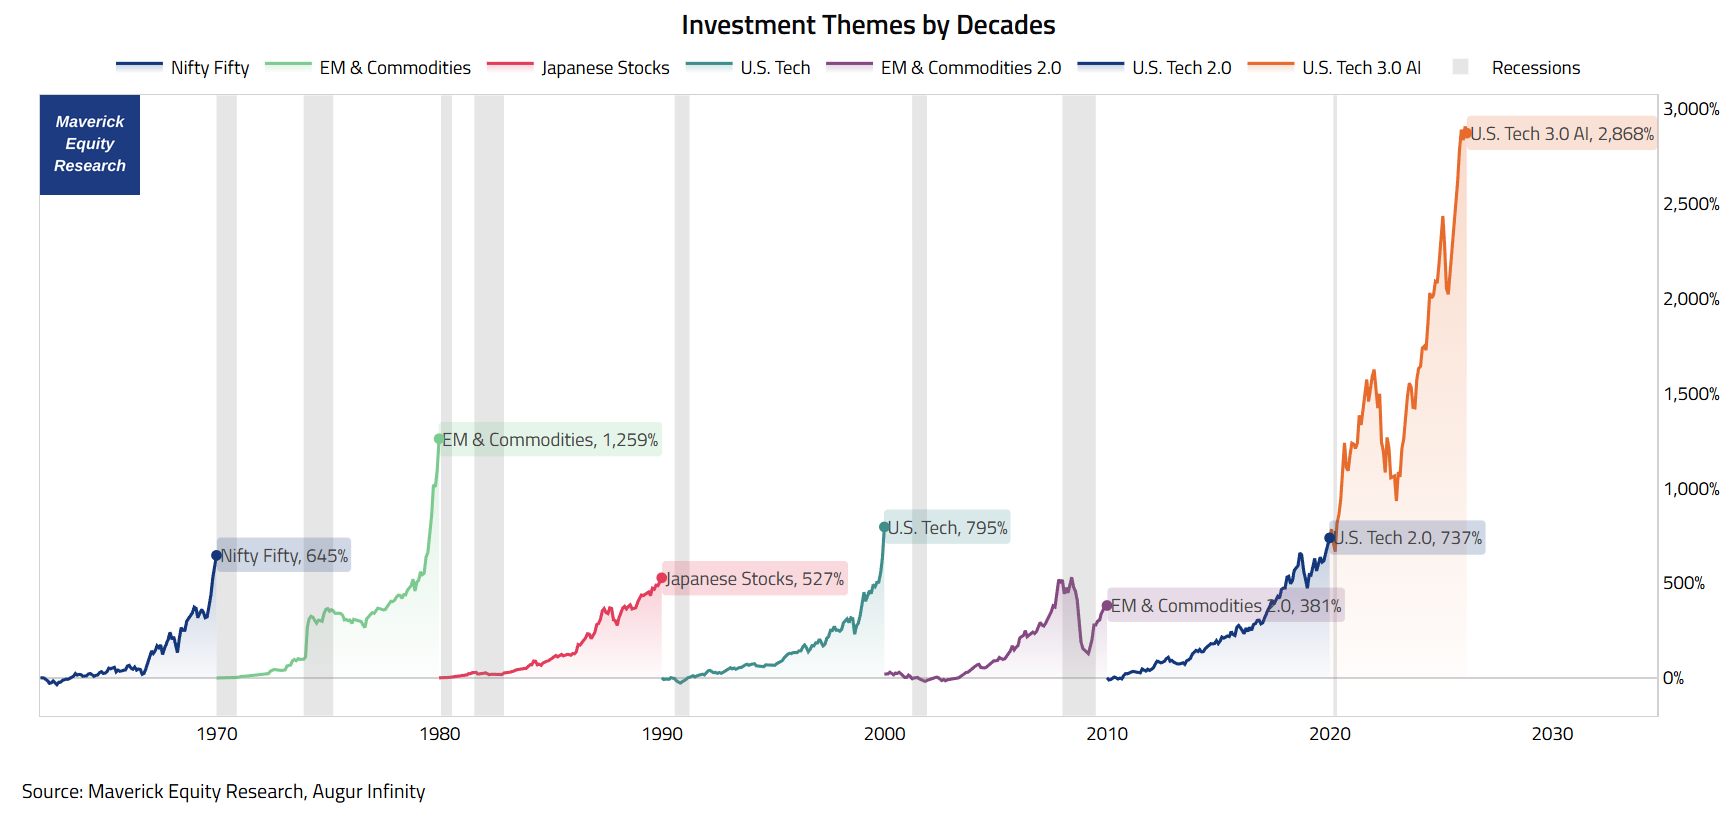
📊 Bonus: Investment Themes by Decades 📊
Investment Themes by Decades & their Returns!
👉 Nifty 50 until 1970 = 645%
👉 EM & Commodities until 1980 = 1,259%
👉 Japanese Stocks until 1990 = 527%
👉 U.S. Tech until 2000 = 795%
👉 EM & Commodities 2.0 until 2010 = 381%
👉 U.S. Tech 2.0 until 2020 = 737%
👉 current U.S. American Tech 3.0 with AI = 2,868%
Food for thought … thoughts?
One of my next Maverick Special research reports covers the big AI question:
✍️ Is AI in Bubbly Territory? Maverick Special #10
As well, on the AI CAPEX big cycle we are having currently I am working on 2 Maverick proprietary indicators/indices that would capture the 2 key aspects:
✍️ AI ROI on CAPEX (a quantitative objective gauge)
✍️ AI Sentiment (a qualitative, mood gauge)
Sentiment is very high and investments have gone parabolic in the AI space, hence:
a rigorous oversight of capital conversion efficiency is necessary to gauge the AI ecosystem’s capacity for sustained growth and ability to translate all that into corporate financial returns
similarly, for the overall economy, it’s growth and potential going forward
Both the qualitative and quantitative gauges are essential to map the current trend and cycle position, allowing us to forecast the eventual stabilization, subsequent market correction (shakeout), and the identification of long-term sustainable winners.
Maverick Charts 56th edition done, 5 key charts with many insights + 1 Bonus!
You can check all the previous 55 editions in the Maverick Charts section!
Mission accomplished for me if the following resonates with you:
‘Hmm I never thought it that way’, ‘now that chart said a whole lot’, ‘now that chart was really interesting’, ‘now that is something new’, ‘now I got it!’, ‘you managed to turn something complex into something actually simple’
hence, if you got to see something differently, my approach gave you a different angle, it did help you connect your key dots, then here we all do well!
Research is NOT behind a paywall and NO pesky ads here unlike most other places!
Did you enjoy this finding it interesting, saving you time and with valuable insights?
If yes, you can support Independent Investment and Economic Research with a Realist-Optimist mindset via the following 3 options:
‘Buy me a Book, Coffee or Data’ which are the tools through which the research is done and delivered straight to your inbox!
PayPal, the classic donation/tip option:
Pledge for a future Premium Research subscription, to be specific introducing “I-RAAS” = Independent Research As A Service
you will be informed in advance both when the Premium Offering will go live, and what it will consists of along its cadence & structure + you can cancel anytime
best part = you will get the best introductory pricing, it will never be cheaper
That’ll definitely support bringing both the current + future ‘Maverick-esque’ research: from a single individual … not a corporate, bank, fund, click-baity media or so … !
Like this, big positive externalities become the name of the game, and we all benefit!
Have a great day! And never forget, keep compounding: family, friends, hobbies, community, work, independence, capital, knowledge, research and mindset!
With respect,
Your Maverick 👋 🤝

P.S. sharing around with like-minded people + hitting the 🔄 & ❤️ buttons = great!
We predicted Walmart's returns would crush Amazon's 2 years ago. See here https://x.com/ThePartnersFund/status/1891846205933486282?s=20
1) Walmart already has the infrastructure (90% of America w/in 10 miles) whereas Amazon needs capex to build it out.
2) Walmart is/was going all-in on advertising which has higher margins which attract higher multiples
3) AWS premium has been priced into Amazon's stock for the last 10 years.
From you chart on "Investment Themes by Decade" a reasonable conclusion would be that the Tech/AI theme is fully priced in and thus over. So, what is the theme for the next decade?