

Dear all,
5 + 2 cherry picked Maverick Charts of the week say 10,000 words or more = the ‘How’!
Table of contents = the ‘What’! Executed in a succinct manner with the aim of a high density of ideas, because great research respects the reader’s time:
📊 Maverick Charts: ‘Live’ GDP, Weekly Economic Index, Jobs, Households
📊 Bonus: CAPEX + Optimism about the U.S. economy & Own Company
✍️ Upcoming Maverick-esque service: Model Portfolios, Baby!
Objective: both data-driven insights + valuable food for thought = the ‘Why’!
📊 Maverick Charts: ‘Live’ GDP, Weekly Economic Index, Jobs, Households 📊
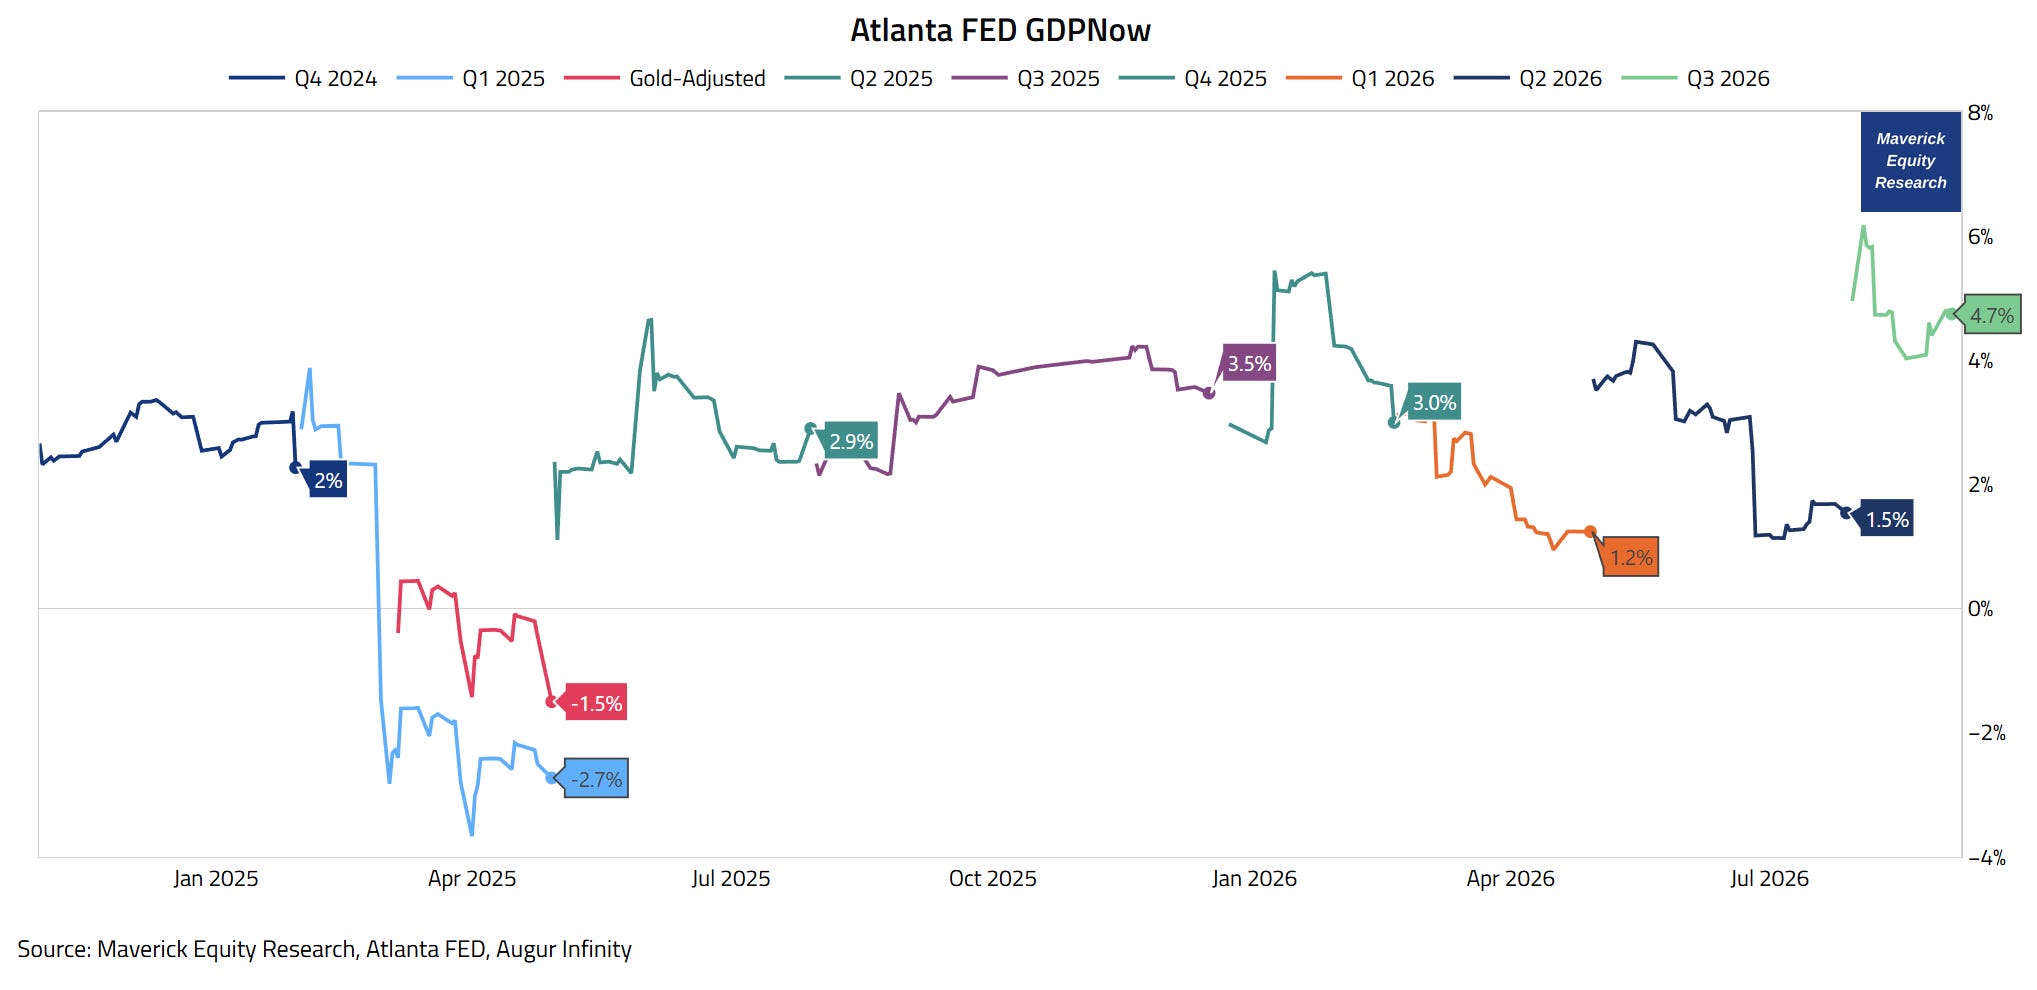
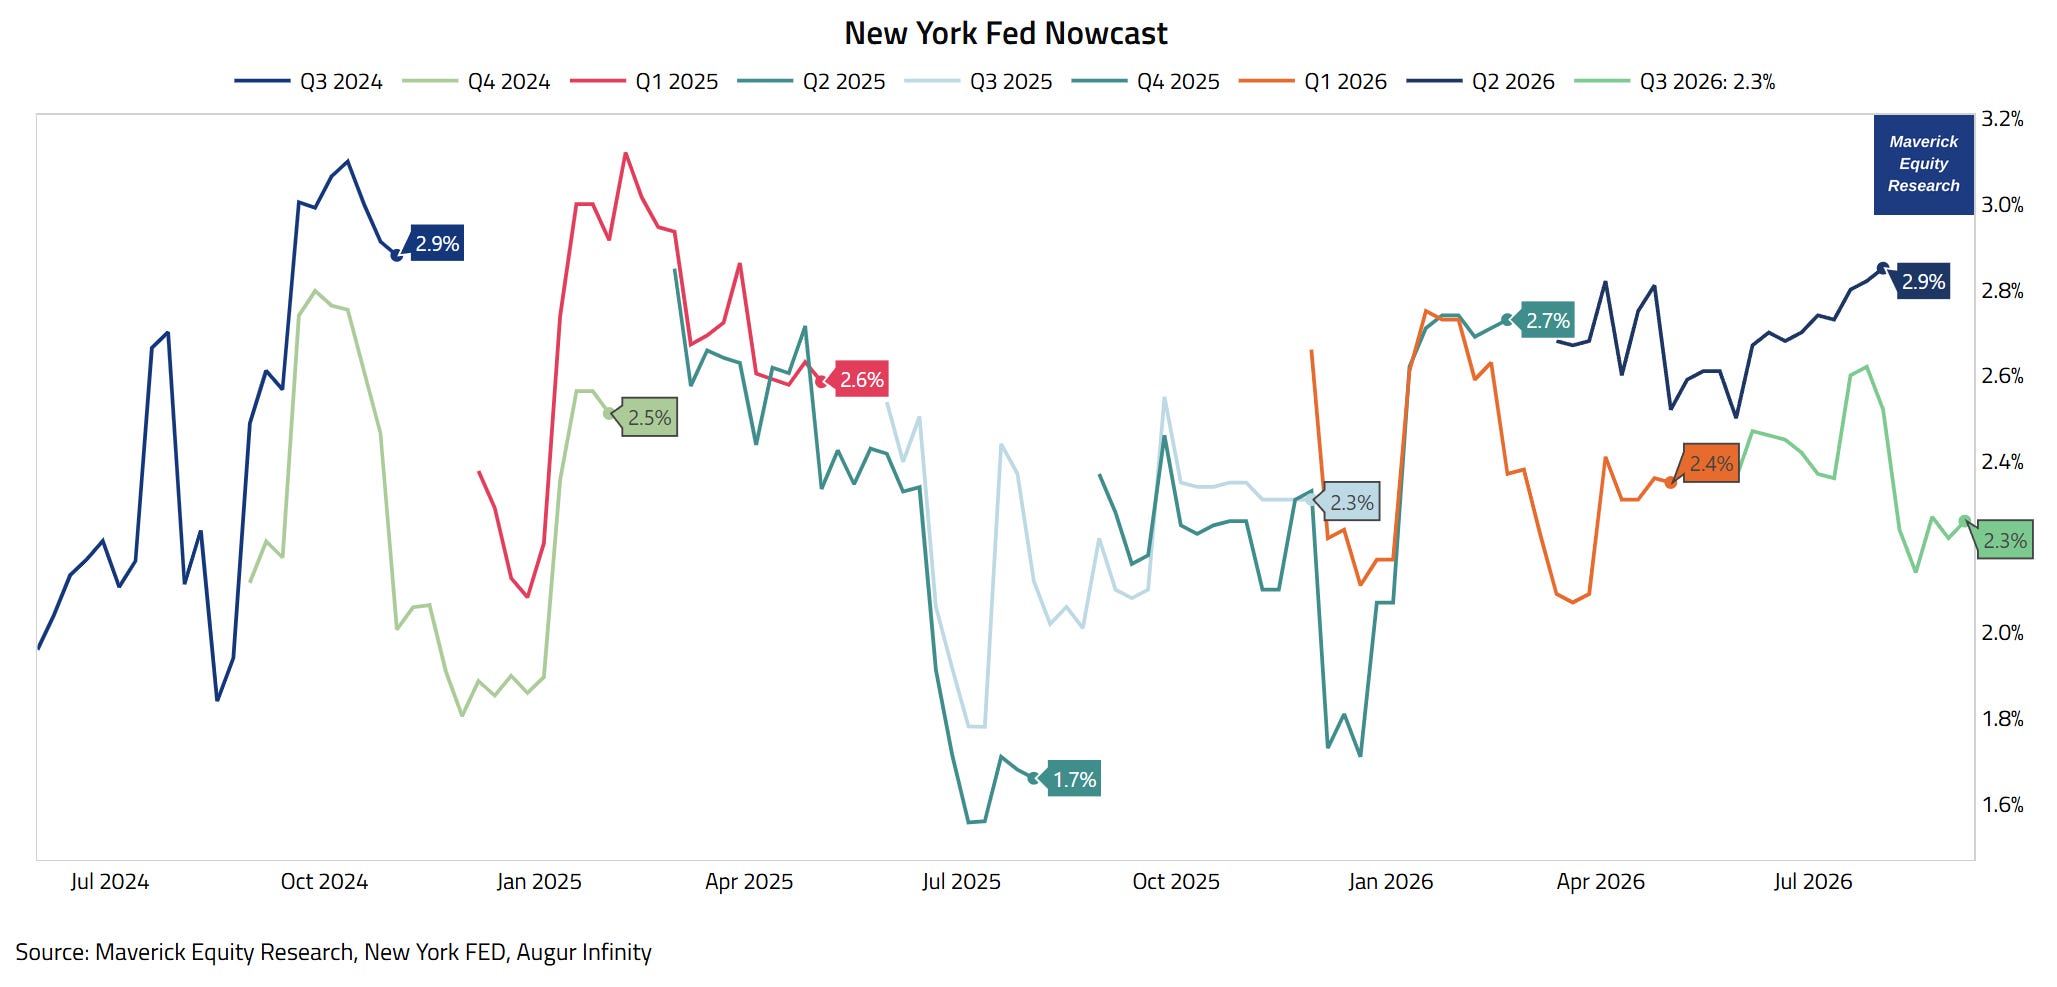
U.S. Q3 GDP latest estimates from the Atlanta FED & New York FED.
Atlanta Fed GDPNow real GDP, fresh latest estimate from September 3rd:
👉 +4.7% and note that it was even +6% when the quarter begun
Another very solid reading!
New York FED Nowcast, fresh latest estimate from September 4th:
👉 +2.3% and note that it is a smoother / more compact estimate
A very solid reading!
The U.S. Economy in Real-Time via another sleek and even better high frequency data point which is highly complementary — it confirms or not the 2 from above.
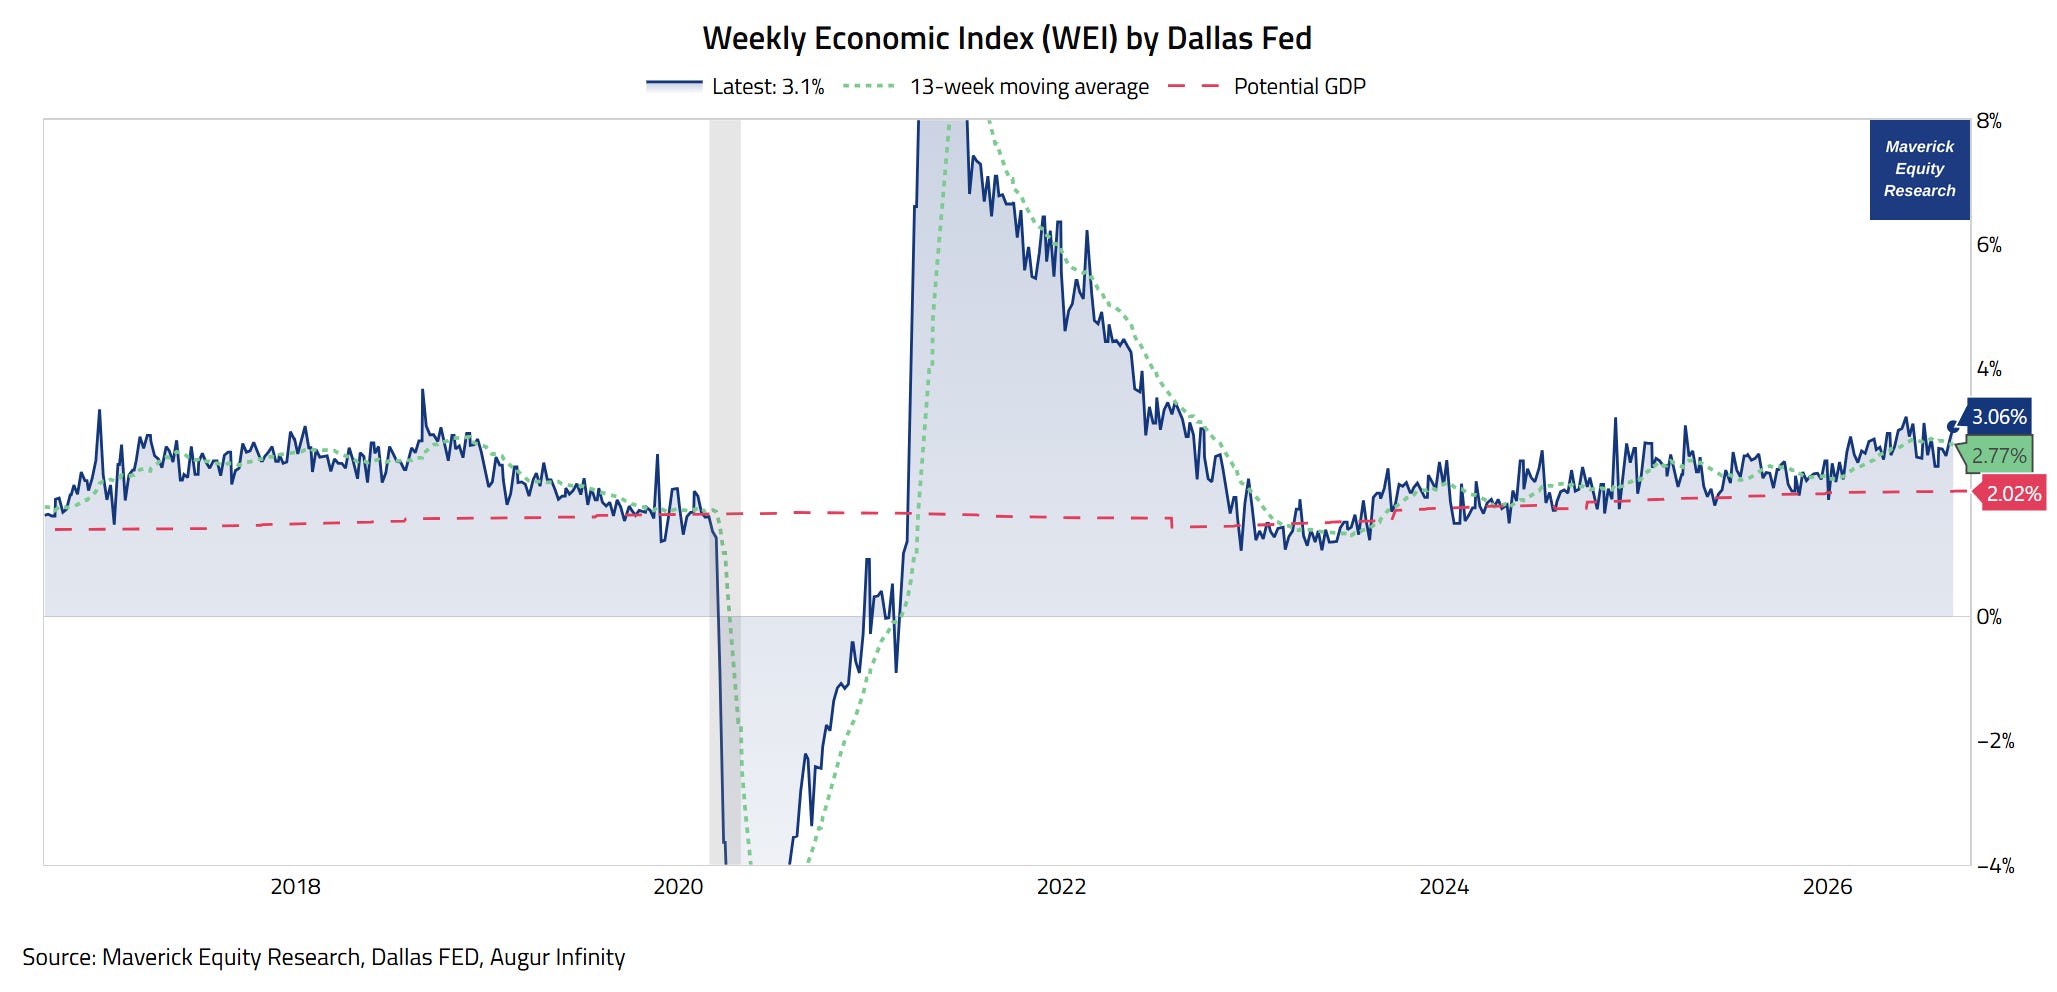
Weekly Economic Index (WEI) by Dallas Fed, a good GDP proxy as the index is scaled to align with year-over-year GDP growth, which gives it a concrete interpretive anchor beyond just being a directional signal:
👉 3.06% (blue) for the week ended August 29th, and 2.84%t for August 22nd, according to the latest release from just 3 days ago, the 3rd of September — basically, it is equivalent to a +3% year‑over‑year rise in GDP
👉 it jumped to its strongest reading in nearly 2 months — latest estimate signals that growth has accelerated from the 2.1% annual trend officially reported for Q2
👉 2.77% via my preferred view as the 13-week moving average — smoother estimate
👉 not only defying the recent headwinds, but actually accelerating strongly lately — hence also a strong signal for a great Q3 in 2026!
Simply put, another very good reading from a very good indicator!
Background info:
the ‘weekly’ part in the name does not do enough justice in terms of how timely and good it is because it provides a signal of the state of the economy based on data available at both a weekly and daily frequency — hence we can say it reflects economic conditions with less than a 1-week lag, sleek isn’t it?
it represents the common component of 10 different daily and weekly series covering consumer behavior, financial/fiscal flows, the labor market & production
therefore, it is one of my preferred high-frequency trackers of the U.S. Economy, especially since 2020 COVID, as it was capturing the historic March–April 2020 collapse and subsequent recovery in near-real-time
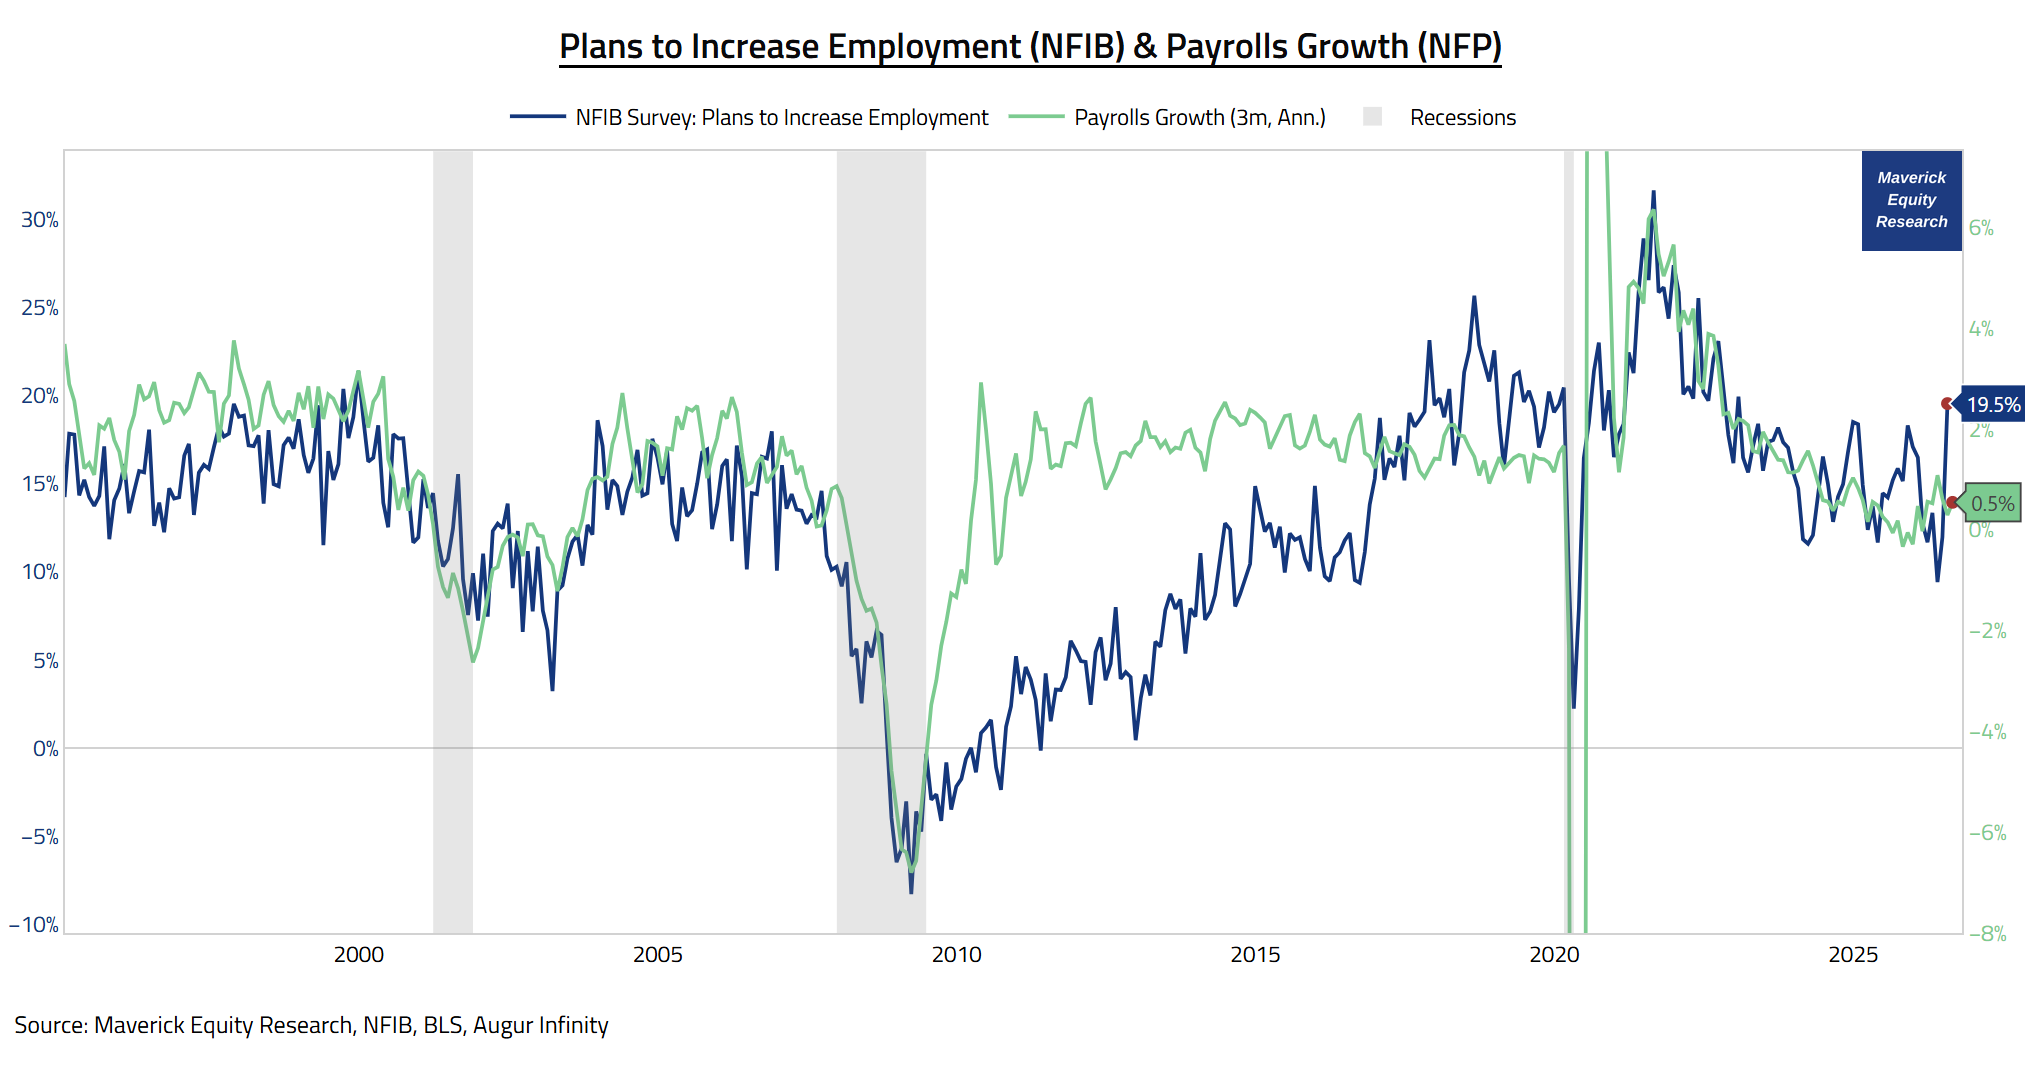
Let’s look also at the Labor Market that’s so key for the U.S. Economy via a rare chart:
Payrolls Growth (NFP) & Plans to Increase Employment (NFIB):
👉 +0.5% monthly change in Nonfarm Payrolls (NFP) is back in positive territory after it was negative in Q4 2025 — not a lot of net jobs the economy is adding, but when the economy is operating at full/potential capacity, one cannot expect a huge number of growth in jobs
4.1% Unemployment Rate (UR) is already low, and there is a Natural Rate of Unemployment (NRU) in the economy, and a Non-Accelerating Inflation Rate of Unemployment (NAIRU)
with the UR at 4.1% and NAIRU 4.16% to 4.3% estimates above that, it shows a rather balanced or a tight labor market in an economy at or beyond its sustainable capacity — hence we just CANNOT have a booming payroll growth these days
👉 moreover, the +19.5% Plans to Increase Employment (NFIB Survey) is quite optimistic on the future payrolls growth
Simply put, Payrolls Growth is positive, and Employment Plans look quite good!
Let’s look also at the Households level, namely key Debt Service figures.
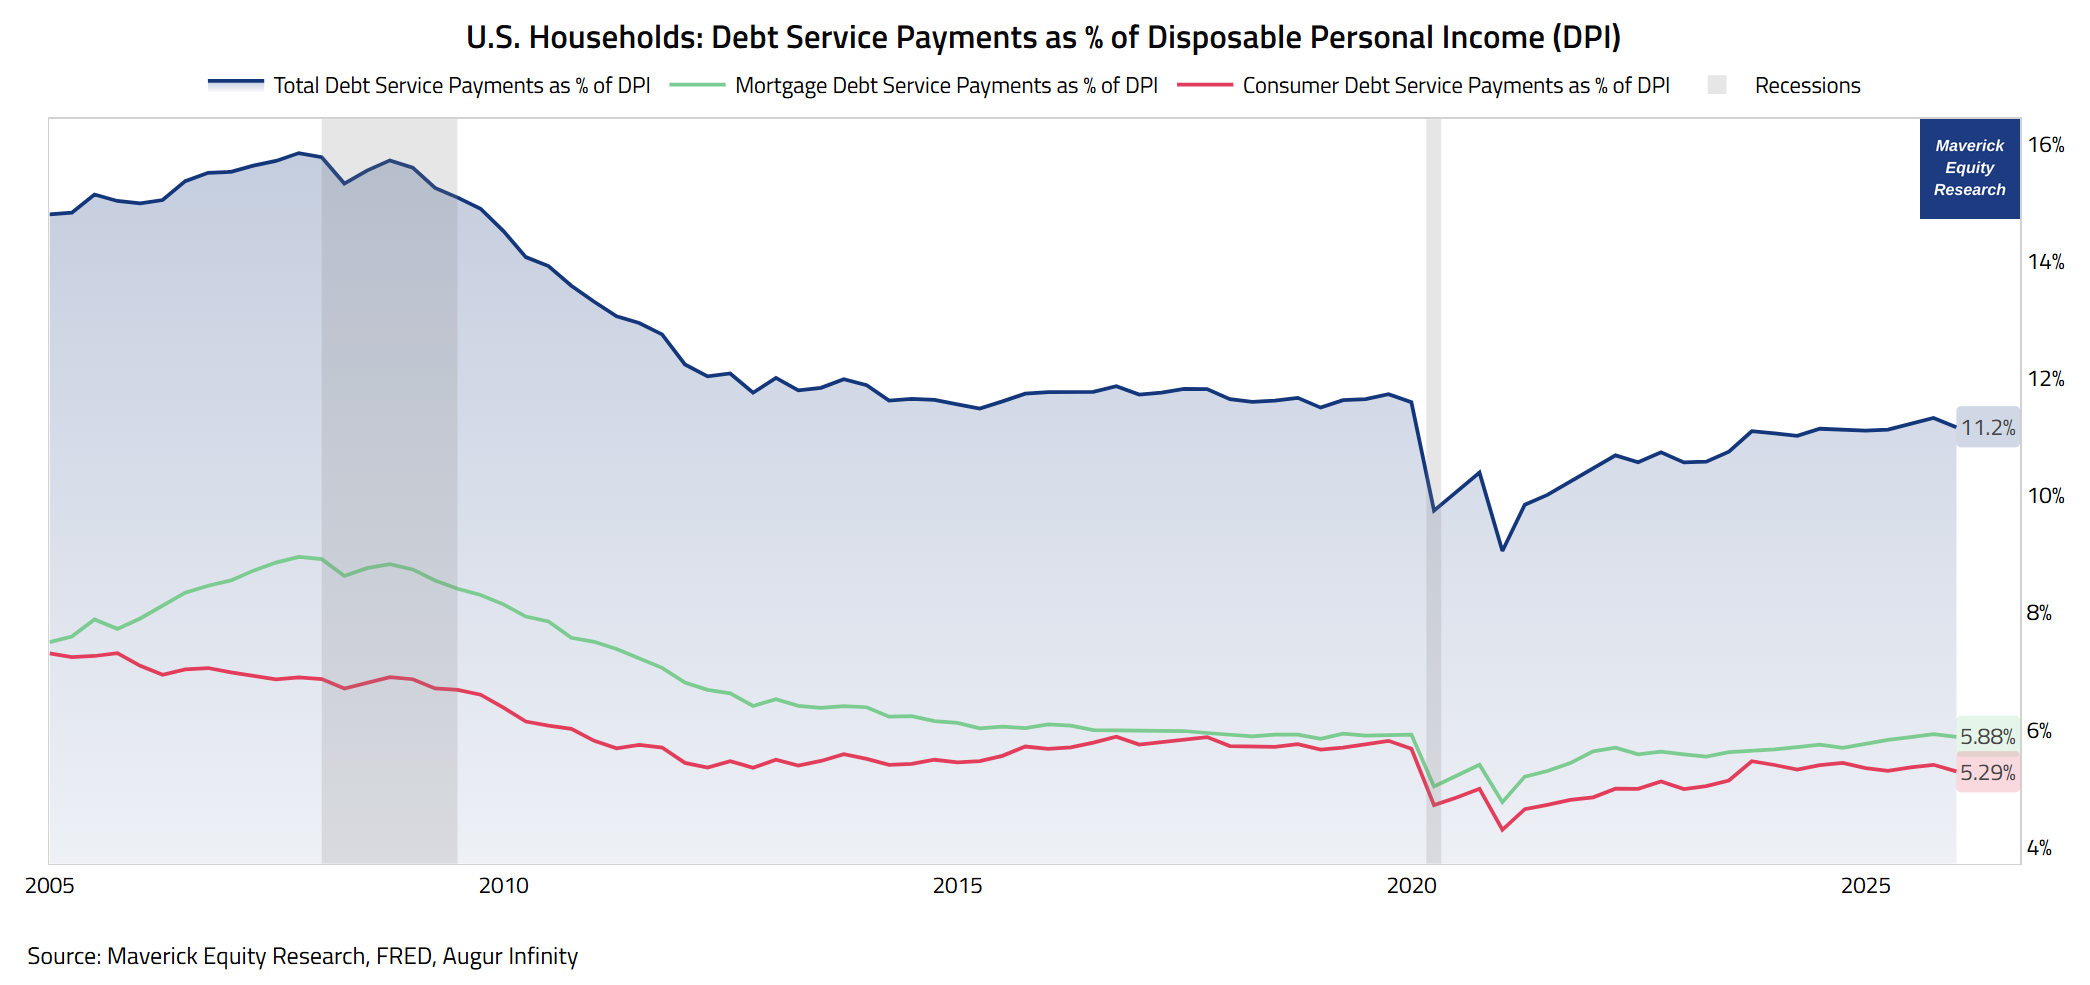
Households: Debt Service Payments as % of Disposable Personal Income (DPI):
Debt Service is one of those gloomy media sensationalist headlines, yet when you look at it properly as a % of Disposable Personal Income (DPI), people start/should cool off — after all, that is the difference between ‘News’ chasing eyeballs/clicks for Ad money and research, especially the independent research you get here since 4 years:
👉 Consumer Debt Service Payments as % of DPI (red): 5.29%
👉 Mortgage Debt Service Payments as % of DPI (green): 5.88%
👉 Total Debt Service Payments as % of DPI (blue): 11.2%
All 3 at very good levels, be it compared to pre 2007-2009 GFC, or pre 2020 Covid!
📊 Bonus: CAPEX + Optimism about the U.S. economy & Own Company 📊
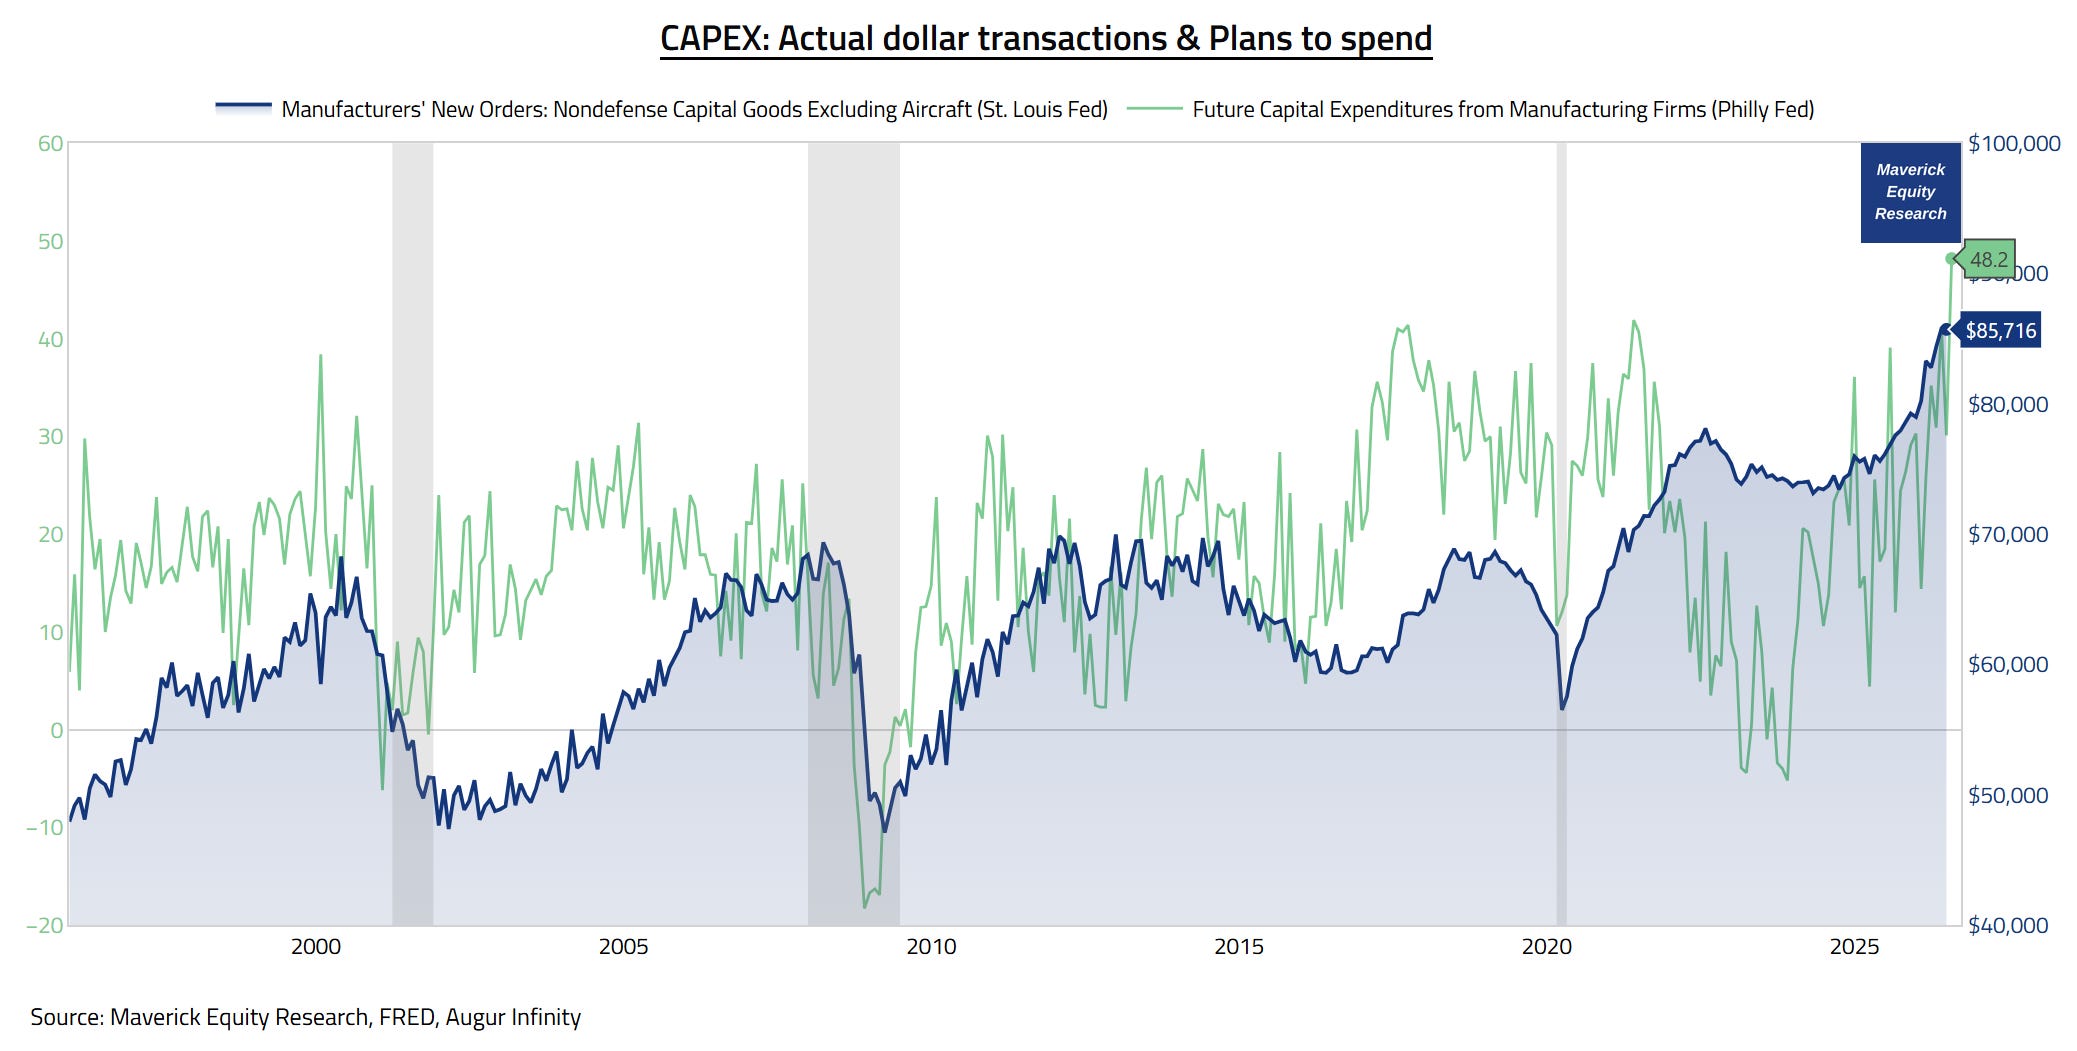
U.S. CAPEX (Investment) via both Actual dollar transactions & Plans to spend — rationale is to capture both Hard Data (actual business activity) and Soft Data (Sentiment) in one go, and ideally they confirm each other, and when they do not, understand why that is not the case:
Manufacturers’ New Orders: Nondefense Capital Goods Excluding Aircraft (blue):
👉 $85.7 billion in July 2026 as it keeps going higher = legal commitments to spend in the near future — economists often use the technical term "hard demand pipeline"
Future Capital Expenditures from Manufacturing Firms (green):
👉 48.2 in August rose sharply from 30.1 in July, highest levels since 1973! = nearly half of manufacturing executives turned aggressively expansionary: planning to buy more machinery, industrial property, equipment and overall upgrades
Takeaway:
investment spending are a forward commitment aka Skin In The Game (STIG)
while sentiment reflects expectations and business plans going forward
Both look good these days!
3 complementary notes to cover F.A.Q. on this comprehensive chart:
Manufacturers’ New Orders: Nondefense Capital Goods Excluding Aircraft (blue):
signals long-term confidence in Manufacturers’ own growth, hence from there we derive an overall positive outlook & economic strength for the months to come
regarded as a key factor driving the economy and one of the leading indictors of business activity - hence to be monitored for any big swings be it up or down (see how it related to the business cycle with the grey bars showing recession periods)
Future Capital Expenditures from Manufacturing Firms (green):
it reflect what manufacturing executives in the Mid-Atlantic expect to spend over the next 6 months — hence it is not a national level survey, but still relevant as an outlook and confidence going forward
P.S. I will also do a dedicated Maverick Special report on the current Investment cycle:
✍️ U.S. CAPEX Boom! Invest Baby, Invest! ✍️
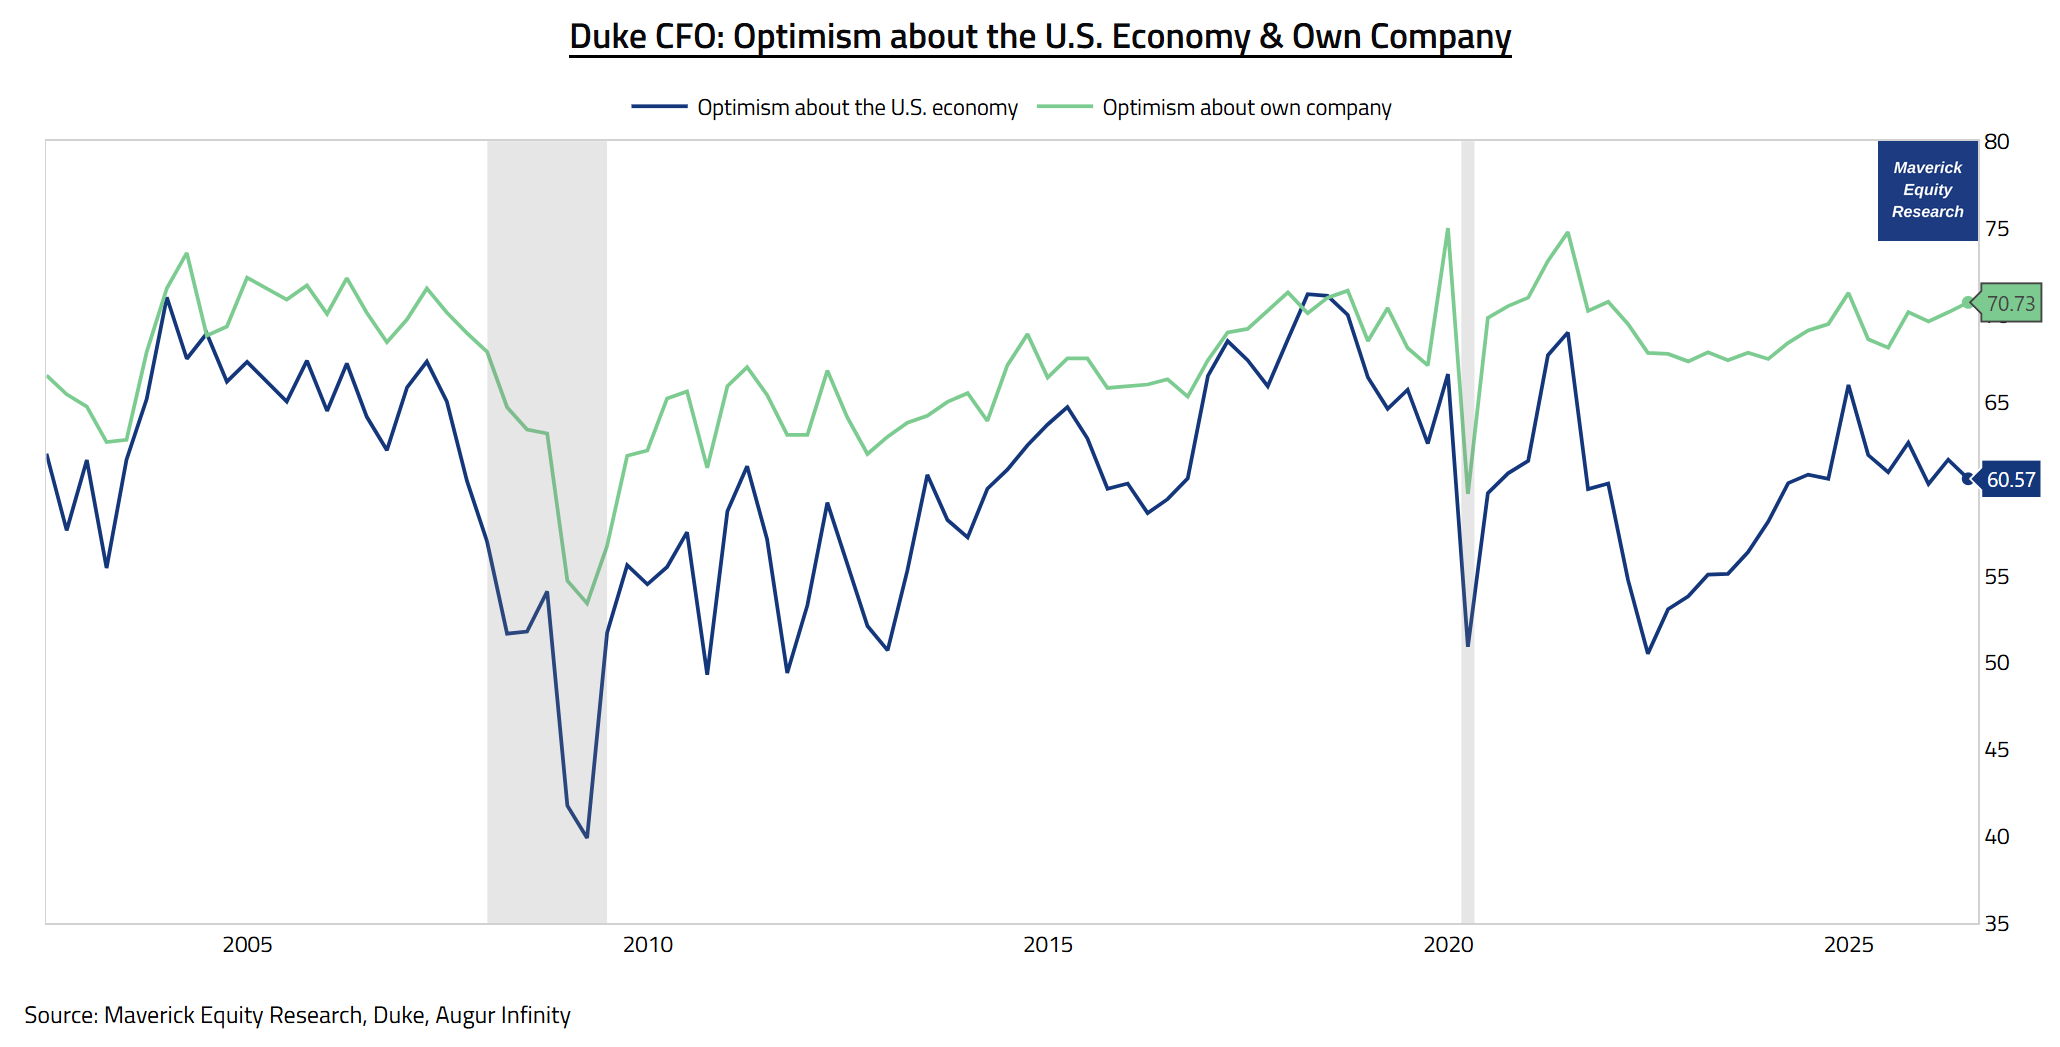
Optimism about the U.S. economy & Own Company via Duke’s CFO survey where 0 represents absolute pessimism and 100 represents absolute optimism:
👉 Optimism about the U.S. Economy = 60.57 dropping lately, yet still optimistic
👉 Optimism about Own Company = 70.73 increasing lately, quite positive
Given both above 50, optimistic signs also from the CFOs side! Note also that:
their trend is a bit disconnected lately, but note that almost always executives are more optimistic about their own company than the economy overall
this is similar to how consumers respond in general saying the economy is bad, but their own finances are quite good
"Make it make sense, Mav!": reading too much Macro is bad for people’s mindset, and it’s always nice to have an excuse or to blame ‘the economy’ when one own’s company is not doing well (but still get that big undeserved bonus …)
P.S. way more on the U.S. Economy via my 2 key deep dives for both Top-Down & Bottom-Up approaches, in essence connecting the mighty Macro-Finance bridge:
✍️ The State of the U.S. Economy in 75 Charts = A Deep Dive! ✍️
The report breaks down the U.S. economy and ultimately aims to answer two of the biggest questions in Finance and Economics:
“How are the Fundamentals of the U.S. Economy?“
“What is the Probability of a Recession?”
✍️ Decoding the U.S. Economy in Real-Time Through
Sleek High Frequency & Alternative Data ✍️
decoding the U.S. Economy by looking way beyond the traditional economic metrics, namely, through the lens of real-time, high frequency & alternative data!
a sharper and timely way to understand the macro forces shaping investing and overall financial markets!
in essence, a ‘live’ view on the state of the U.S. Economy, and quite a unique report which you do not see elsewhere!
✍️ Upcoming Maverick-esque service: Model Portfolios, Baby! ✍️
Soon coming to town, Model Portfolios! Specifically, full solutions, ready to invest entire portfolios based on various financial objectives, risk tolerance and risk capacity:
✍️ Maverick All-Weather Portfolio (MAWP)
✍️ Maverick Core-Satellites Portfolio (MCSP)
✍️ Maverick All-Equities Portfolio (MAEP)
… and way more, including Thematic portfolios … all along key insightful posts that cover major portfolio management topics, and especially mindset, temperament and patience: one needs both the ‘hard’ portfolio + the ‘soft’ mindset part in order to win!
Maverick Charts 63rd edition done, 5 key charts with many insights + 2 Bonus!
You can check all the previous 62 editions in the Maverick Charts section!
Mission accomplished for me if the following resonates with you:
‘Hmm I never thought it that way’, ‘now that chart said a whole lot’, ‘that chart was really interesting’, ‘now that is something new’, ‘now I got it!’, ‘you managed to turn something complex into something actually simple’, ‘you saved me time and gave me clarity’
hence, if you got to see something differently, my approach gave you a different angle and it did help you connect your key dots, then we all do well here!
Research is NOT behind a paywall and NO pesky ads here unlike most other places!
Did you enjoy this by finding it interesting, saving you time and getting valuable insights? What would be appreciated?
Just sharing this around with like-minded people, and hitting the 🔄 & ❤️ buttons!
That’ll definitely support bringing in more & more independent investment research: from a single individual … not a corporate, bank, fund, click-baity media or so … !
Like this, the big positive externalities become the name of the game! Thank you!
Sharing = 3x win: you + your close ones + me!
Have a great day! And never forget, keep compounding: family, friends, community, capital, knowledge, research and mindset!
With respect,
Mav 👋 🤝
“Compound interest is both the ultimate and biggest natural hedge!”
Maverick Equity Research

The gap between the two nowcasts is the signal, not the noise. Atlanta at 4.7 and New York at 2.3 for the same quarter isn't one model being wrong, it's a methodology tell: GDPNow mechanically extrapolates each incoming series, so it runs hot early and volatile, while the NY smoother is Bayesian and shrinks toward trend. Stacking the Dallas WEI at ~3% year-over-year alongside them effectively triangulates the true read into the low-to-mid 3s.
Which is the useful discipline here, reading three estimates as a distribution rather than picking the friendliest headline. The spread between them tells you how much of the quarter is still being guessed.