✍️ Margin Debt (Leverage/Borrowing) by Retail Investors. Maverick Special #7
Margin Debt: Absolute vs Relative! They are not really the same!
Dear all,
U.S. equities at all-time highs, MEME stocks & retail favorites going parabolic, hence one topic making the rounds = Margin Debt (leverage/borrowing) by Retail Investors!
As usual, too many out there (no name calling) are using just the level $ values to chase clicks, fear monger, practice politics-like polarisation, or simply not doing more of the work required to provide more angles and nuances for better insights.
Well, that is why I am here, and I guess also why you enjoy this independent research!
Hence, as you got used to, in just 7 Maverick Charts I will ‘say’ 10,000 words or more!
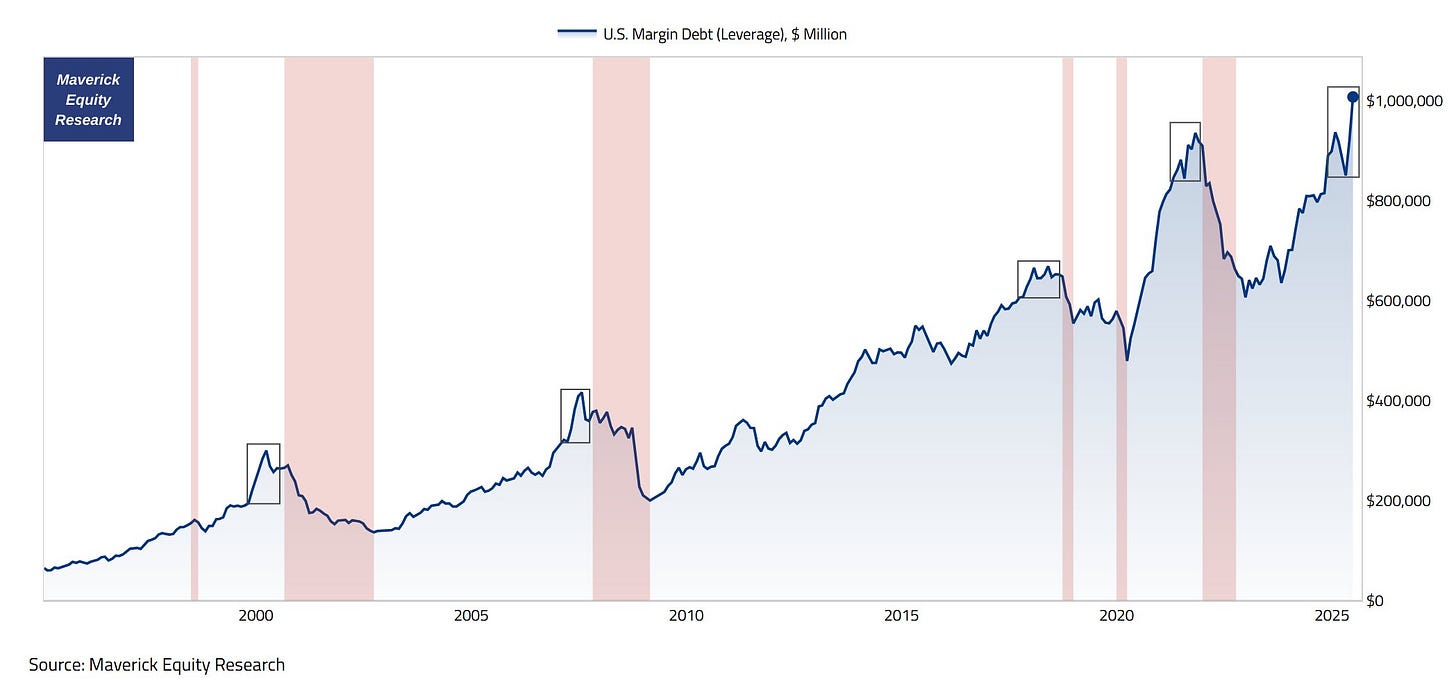
Margin debt in brokerage accounts (FINRA data):
👉 tops $1 trillion for the 1st time in history with a +9.4% growth from May to June, and marking the highest jump since November 2020
👉 topped even the 2021 madness as retail investors go into debt to buy 'stonks', hence July data likely even higher, maybe +$1.1 trillion ... melt up is underway ...
👉 big margin spikes into local tops = a pattern happening before equities drawdowns (red shaded areas), just check the boxes = pun intended 😉
N.B. this chart and post had +20,000 views on Twitter
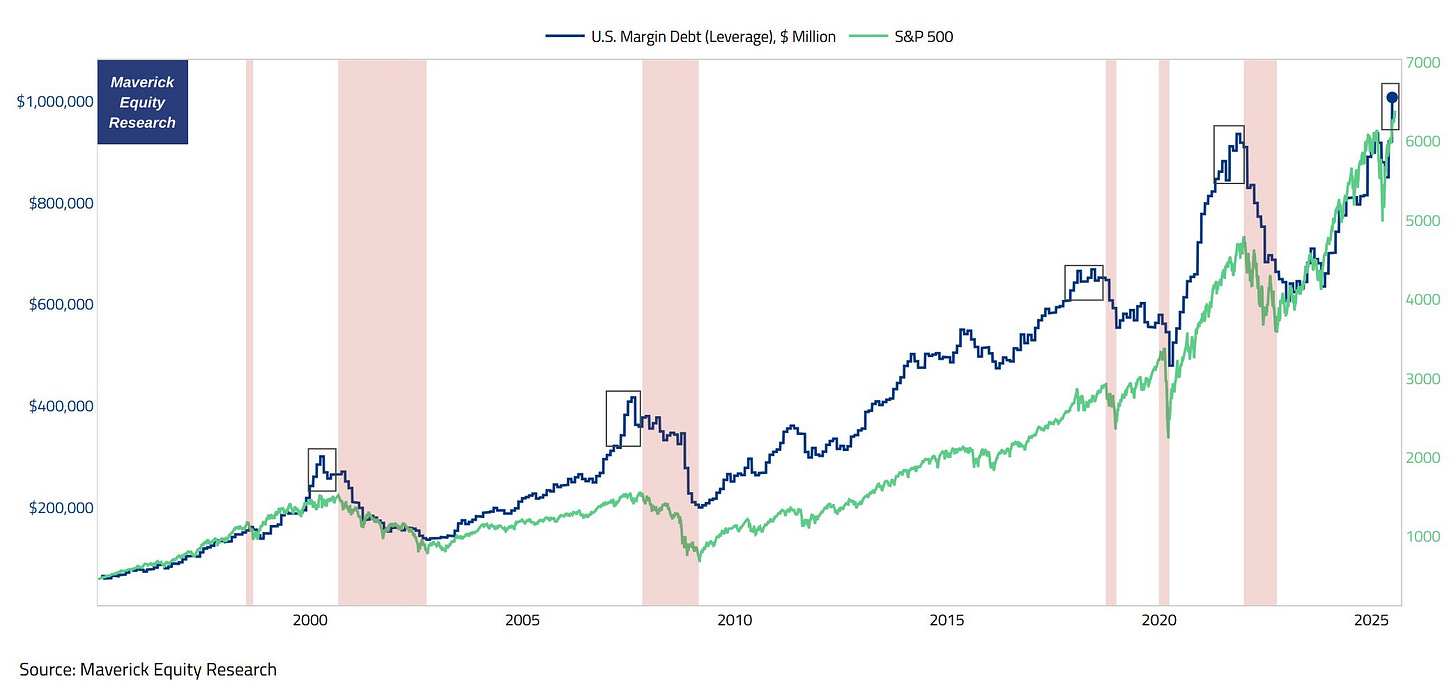
Enhancing the chart by adding also the S&P 500 - a similar message:
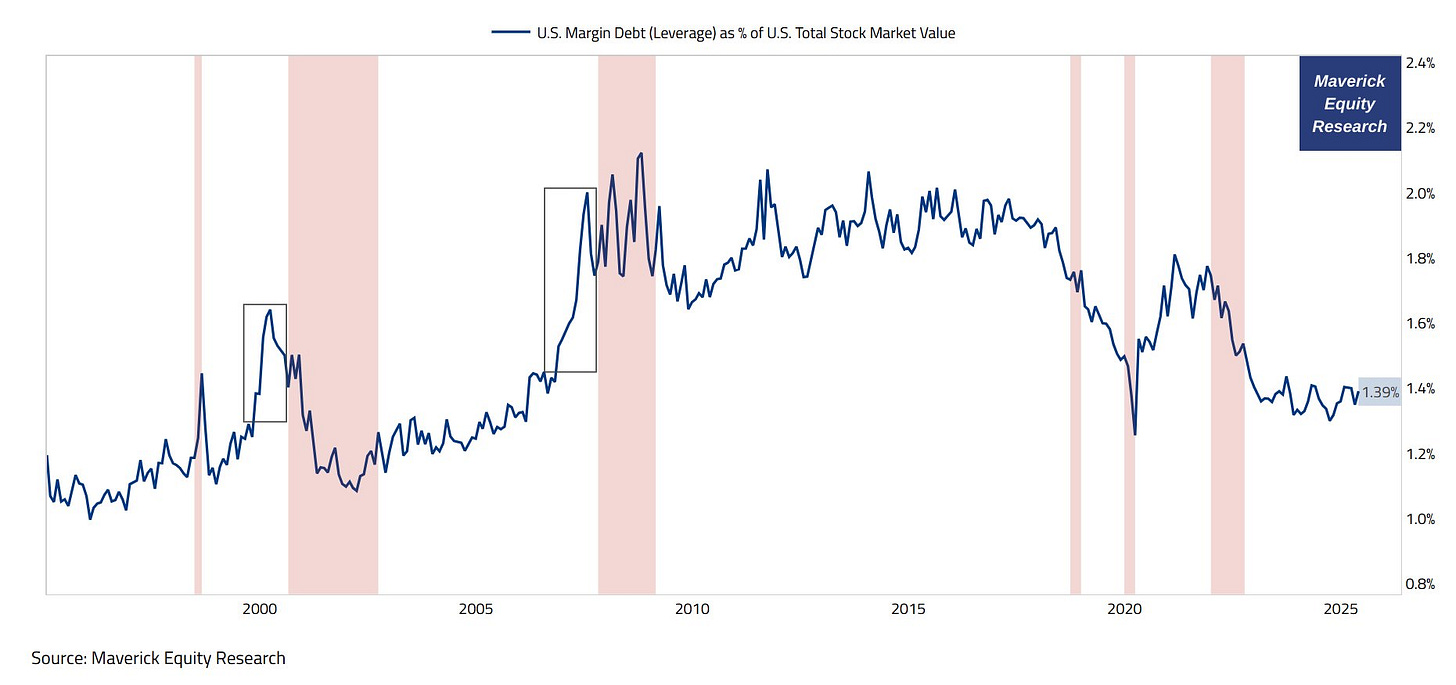
Margin Debt as % of U.S. Total Stock Market Value and equities drawdowns (red shaded areas) in order to 'standardise' / 'normalise' this data series:
👉 looks way way less troublesome and worrisome at 1.39%
👉 2000s Dot-Com bubble and 2007/GFC/Lehman spikes were very noticeable (check the 2 boxes), hence only when we would have a similar vertical increase, I would be more confident to say this metric signals that the local top is just around the corner
👉 therefore, for now hovering around 1.4% it is just a flat & boring line since 2023, hence just 5,000 views on Twitter despite being more insightful …
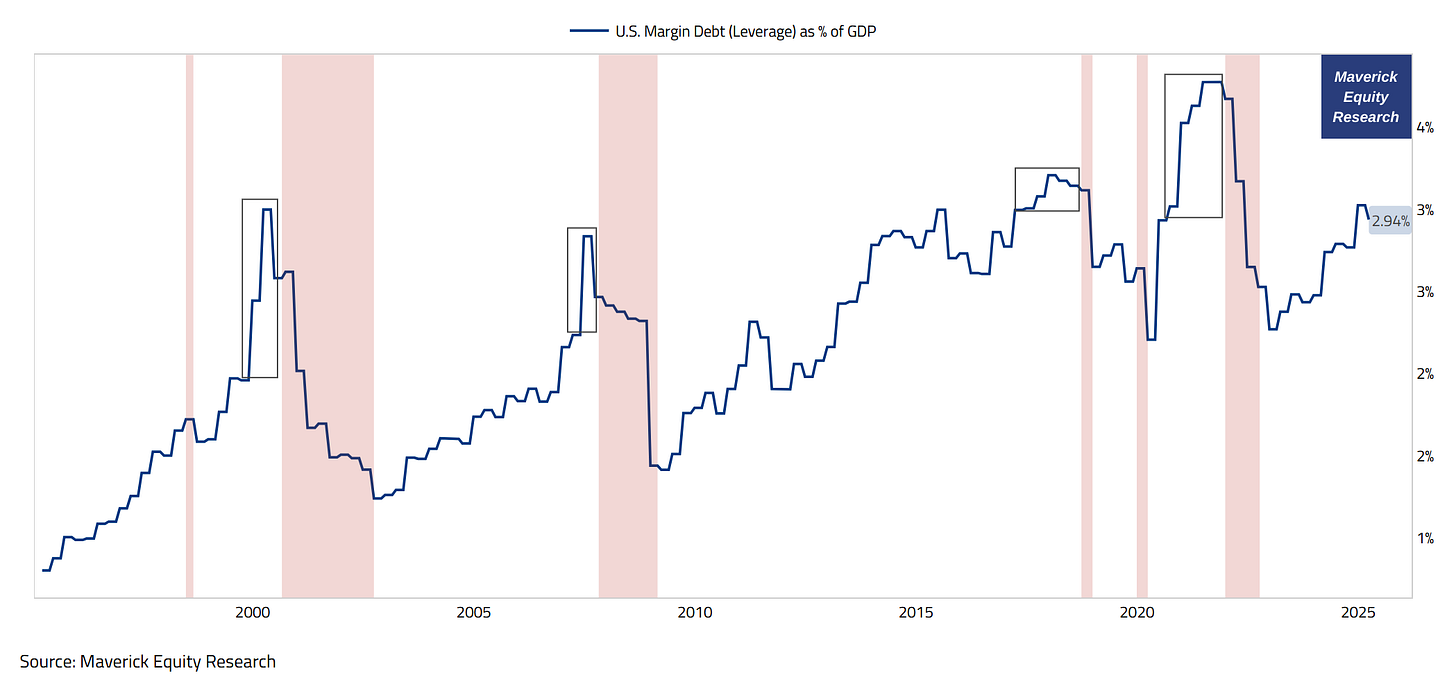
Margin Debt as % of GDP:
Some say to see Margin Debt via GDP is a bit of a stretch given that MD exists within financial markets, and not the real broader economy, but on the other side let’s recall the fact that stock market values change quickly sometimes - 2025 latest example with a 19% market drop in April before an almost immediate recovery. And in general it happens certainly way more than the economy (GDP).
Therefore, also a valuable angle I think, especially that in general and many times we have it like I like to say it: 'In research there are no exact magic solutions or metrics, just various weights to variables and trade-offs'
👉 Margin Debt as % of GDP = 2.94% it does not look that troublesome
👉 not the case currently, but check for big vertical spikes into local tops like before = a pattern happening before equities drawdowns (check the boxes = pun intended)
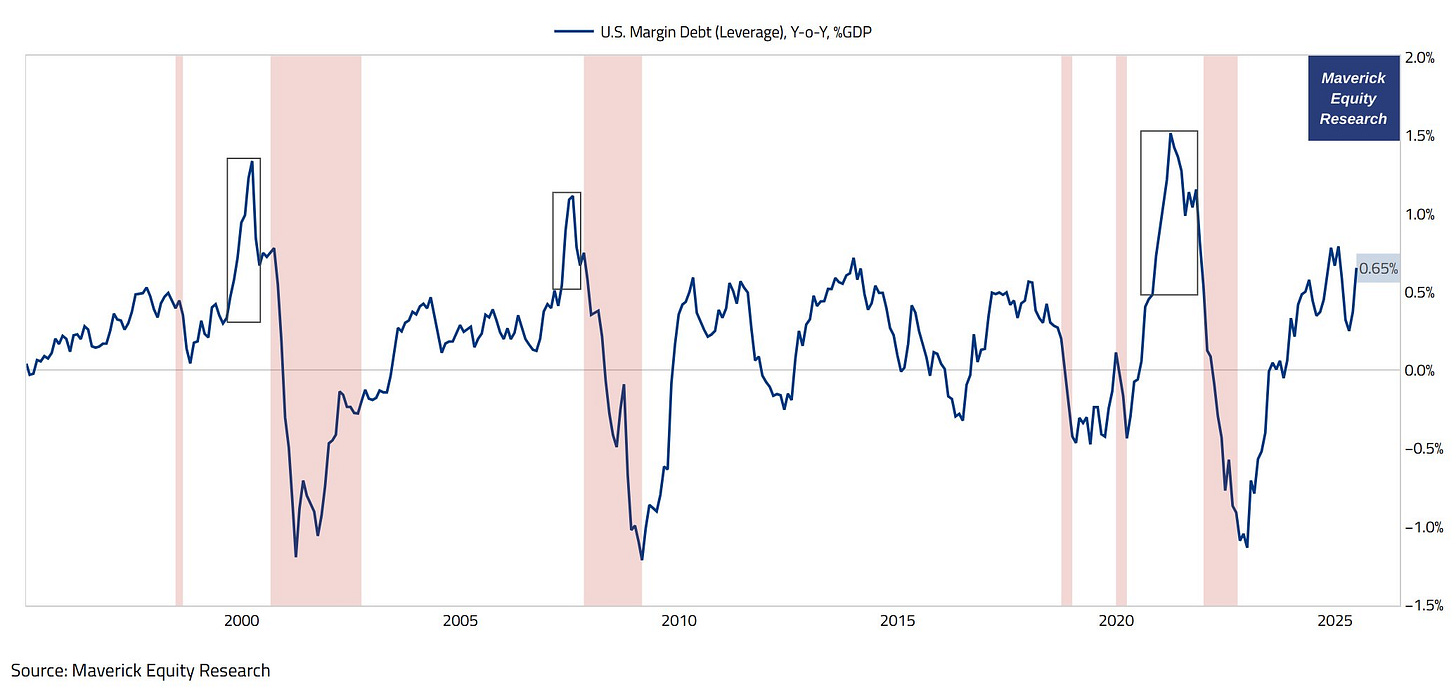
Margin Debt change to GDP (Y/Y, %GDP), going funky a bit now:
👉 at 0.65%, more is needed to reach troublesome signalling territory, yet to check for big vertical spikes into local tops like before = a pattern happening before equities drawdowns (check the boxes = pun intended)
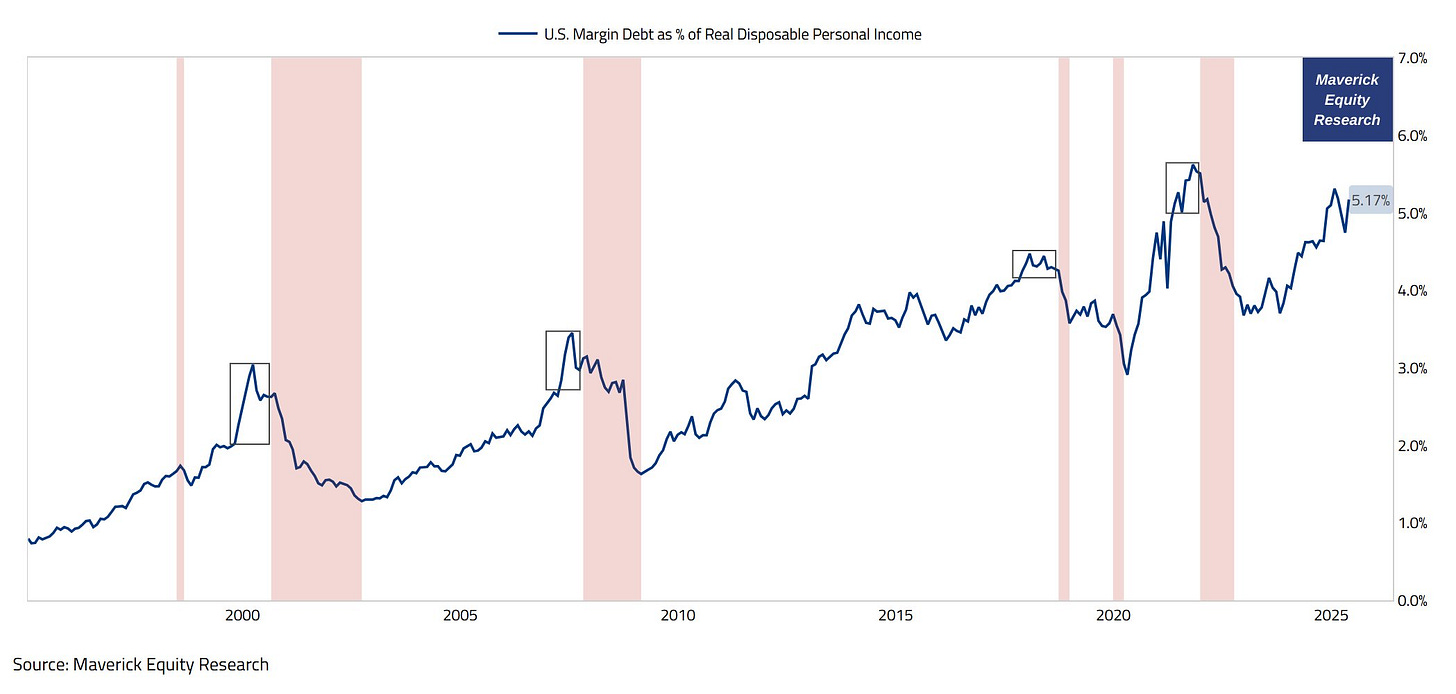
Margin Debt as % of Real Disposable Personal Income:
👉 at 5.17%, lower than the recent 5.62% peak during the 2021 stock market mania
👉 more and a vertical spike is needed to reach troublesome signalling territory
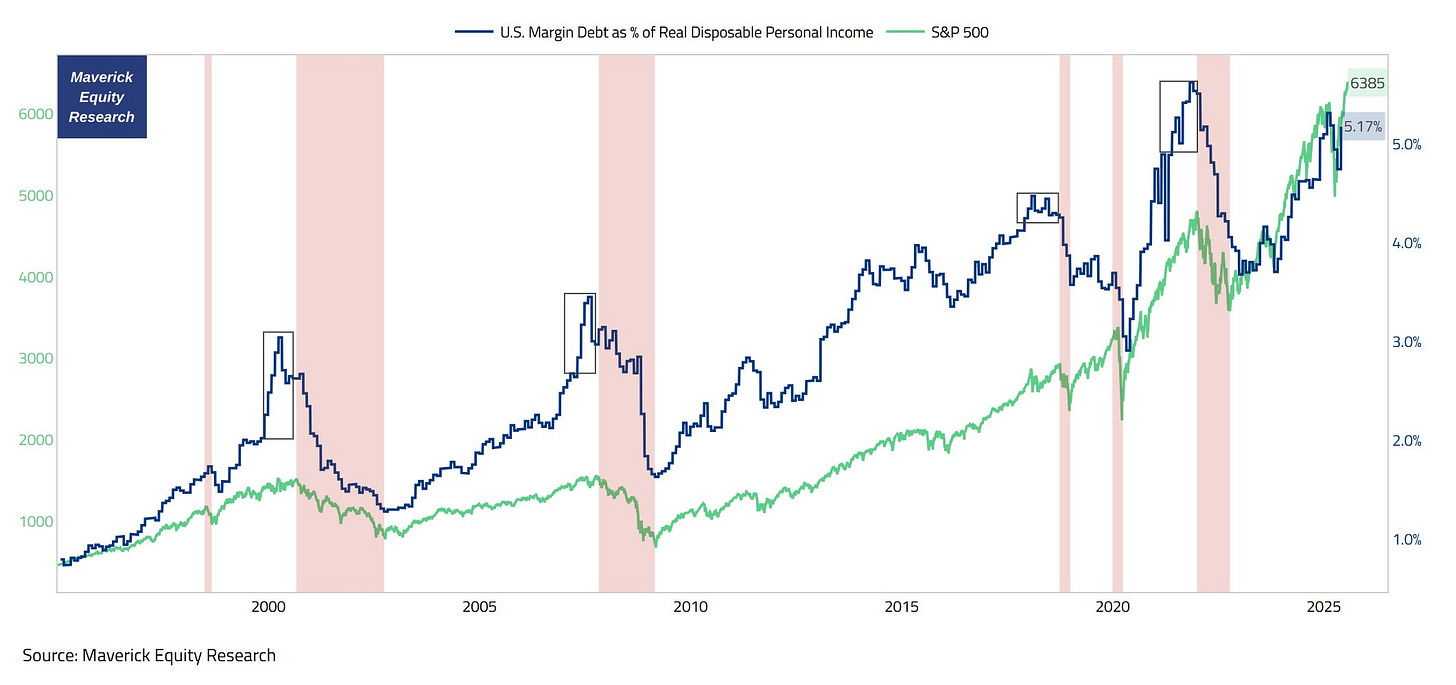
Margin Debt as % of Real Disposable Personal Income + the S&P 500:
👉 relatively 'low' to the S&P 500 latest up kick
👉 to signal trouble, margin debt should kick higher and faster than the S&P 500
A final few key notes for some extra food for thought:
given high(er) interest rates nowadays, margin debt is way more expensive than it was during the low / very close to 0% interest rates era (ZIRP) when one could so easily leverage up their investments
behaviour wise, when speculation and mania kicks in, likely not even higher borrowing costs are a big deterrent as animal spirits can kick in (FOMO)
all margin should not be assumed to only ‘chase upside’ - many see the market very overvalued nowadays, hence margin is to be used also to finance short selling
Bonus: recall ‘The Triple L’ via Charlie Munger, and with a wordplay & jokey vibes: Leverage does it quickly while Ladies & Liquor take longer but do the same too 😉.
Maverick’s net takeaways aka conclusions:
👉 Margin Debt current nominal historical record above $1T is clearly surpassing 2000's ~$300B, 2007's ~$400B and 2021’s $930B peaks
👉 that said, relative to market capitalisation, GDP, and real disposable personal income, it looks way less troublesome currently
👉 vertical spikes in both $ absolute amounts, and especially in % relative terms are to be monitored going forward should they get into troublesome signalling territory
All in all, as I don’t chase clicks, fear monger, do polarisation & similar ‘marketing BS’, I rely on you sharing my independent investment & economic research around your networks! Like this, the big positive externalities become the name of the game! Thank you!
N.B. in the future, and just like with all the other Maverick Special Reports, you will get this one as well on an ad-hoc needs-based frequency. Just in case you missed the previous 6 report, you can read them here.
F.A.Q.: ‘What is your view on the market in terms of valuation?’ Deep dive on that via my future 2 distinct and materially enhanced S&P 500 reports:
✍️ S&P 500 Report: Performance, Sentiment, Seasonality, Technical Analysis (#Ed 6)
✍️ S&P 500 Report: Valuation, Fundamentals, Special Metrics & Leading Indicators (#Ed 6)
Complementary, the U.S. economy will also be covered given the interconnectedness between the real economy and the financial markets - that is Maverick Macro-Finance!
✍️ The State of the U.S. Economy in 75 Charts (4th edition)
Have a great day! And never forget, keep compounding: family, friends, hobbies, community, work, independence, capital, knowledge, research and mindset!
With respect,
Mav 👋 🤝




Great catch. But I think the surge in the ratio is more due to a sharp drop in the denominator. To me, the margin debt is more like a lagging indicator, because when people's risk appetite rises, they are willing to borrow debt for investment(Gambling). Once the economy declines, people immediately refuse to take on any risky investments, so the margin debt will also decline.
I keep telling the same thing for a while. Thanks to show this with great charts!