

Dear all,
welcome to the 1st edition of the ‘Maverick Valuations’ report covering Switzerland.
This report is unique, hence quite ‘Maverick-esque’ as I tried to find it served by banks, overall media, or independent investment researchers like myself, but none. Therefore, I decided to create it myself and also plan to improve it going forward.
Report is NOT behind a paywall & there are no pesky ads here. It would only be highly appreciated you just spreading the word around to likely interested people.
Report structure:
📊 Swiss stocks = ‘Swissness’ 📊
🏦 Bonus Charts 🏦
What are the various likely use cases provided by this report & visual analytics? Research for market leaders & laggards, likely un/warranted cheap or expensive stocks, peers analysis, stock screener, outliers, positive or negative momentum, relative strength, full equity research on single stocks & general market assessment.
My favorite use cases:
finding future winners via further research
finding stocks that did well across past tough times, hence resilient winners … which are likely also going forward to be future winners
N.B. the Full Equity Research section will cover those in the future

Great to have at hand at least 8 times per year: before & after each of the 4 quarterly earnings. An overall yearly recap is also very interesting. Let’s see before Q1 2023 earnings are out & usefully compare going forward with the future editions. Check your stocks & also outliers in the scatterplots, it can get interesting & food for thought.
📊 Swiss stocks = ‘Swissness’ 📊
What’s inside? Let’s dive into the MSCI Switzerland ETF (EWL) which was created in 1996 & consists of 42 stocks. It invests in stocks operating across diversified sectors, market capitalizations (size) & both growth & value (style).
How? Via sleek visuals & analytics, namely price & valuation scatterplots because they say 1,000 words. Full names, tickers with sectors & industries to begin with:

Performance via the overall 5 year Total Return of EWL vs ACWI: EWL not only outperformed ACWI, but note as well how during the Covid crash it dropped less: EWL is 56.7% in Health Care & Consumer Staples which are defensive sectors.
Note: EWL has a 0.5% fee / year, hence on the medium-long term it can be a material dragger on the compound interest for investors vs buying the individual names.

Very interesting via a 20-year dividend overview, namely yield and payments:
current dividend yield is 1.82%, though note it went above even 5% during the 2007-2009 Global Financial Crisis & the 2012 EuroZone Sovereign debt crisis. Now given that defensive sectors dominate and also AAA rated Switzerland, during bad times locking in a 5% dividend yield is quite tempting to me
dividend payments not interrupted & increasing over time - during 2007-2009 more often payments to likely signal the market that this is a relative safe place

6 Maverick visuals in total now, 3 on price & 3 on valuation:
Price action views:
2023 YTD Winners & Rebounders from their 52-week low

2023 Total Returns & 2022 Total Returns to answer an interesting research question: which stocks were positive both in the 2022 bear market & up to today in 2023?

Here on recent performance returns, it is quite interesting at times to plot it like this: 1 year past returns with Earnings/EPS growth. Rationale? We want to spot companies with declined stock price, but still strong expected earnings growth

Valuation views via:
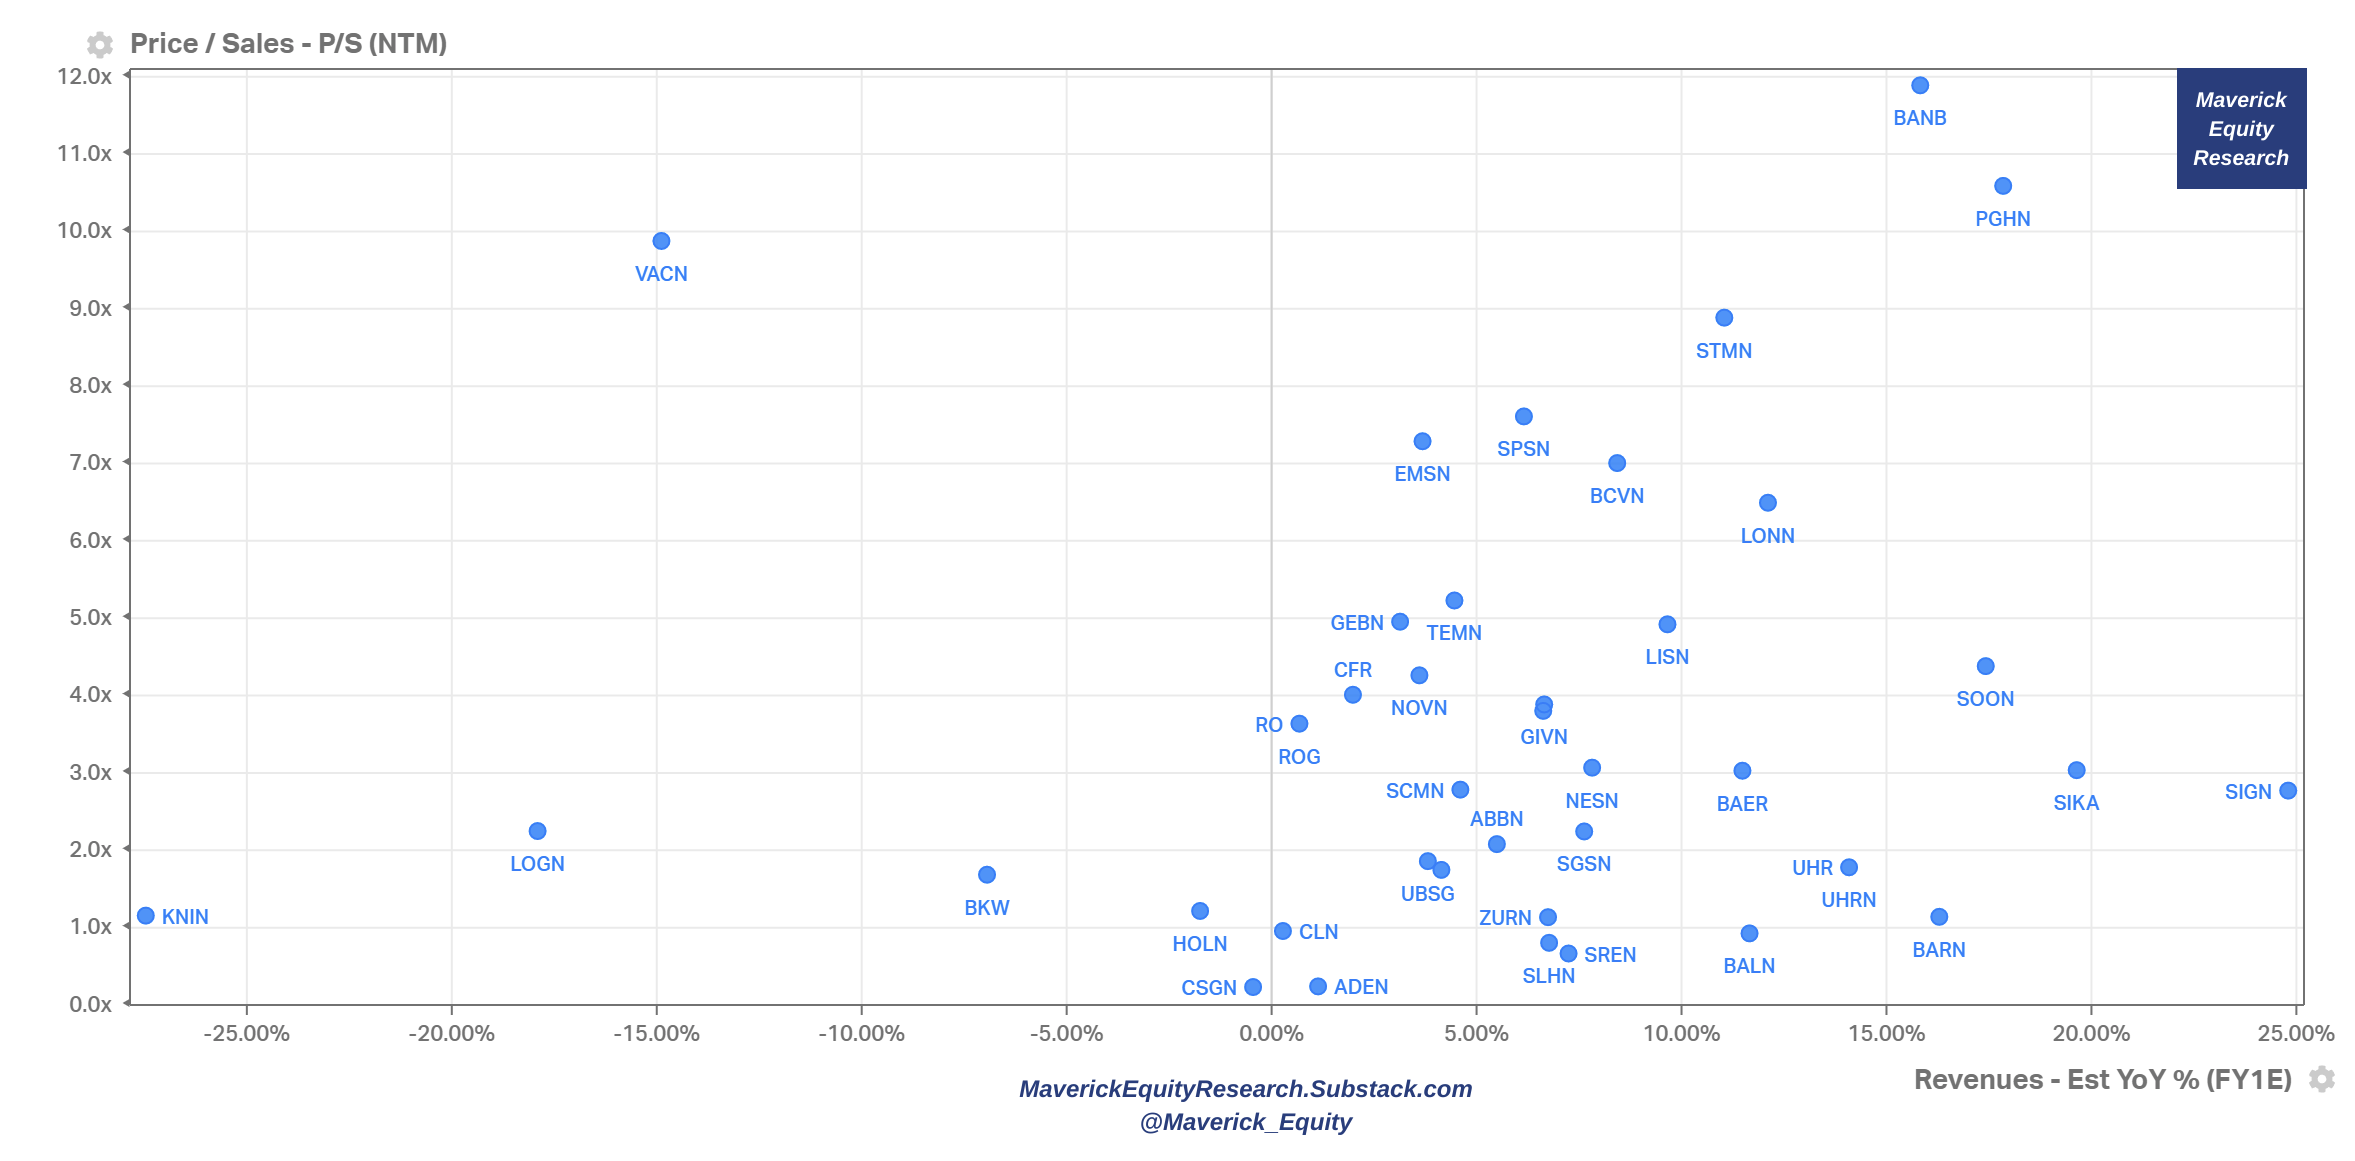
Sales/Revenue aka ‘Top-line’ view: P/S multiple & Revenue growth (next year estimates). Interpretation: Forward P/S multiple the stock is trading at for the given level of estimated Sales growth
Profitability aka ‘Bottom-line’ view: P/E multiple & Earnings/EPS growth (next year estimates). Interpretation: Forward P/E multiple the stock is trading at for the given level of estimated Earnings/EPS growth

Free Cash flow aka ‘cash’ view: P/FCF multiple & FCF/Share (last twelve months). Interpretation: P/FCF multiple the stock is trading at for the given level of FCF/Share

🏦 Bonus Charts 🏦
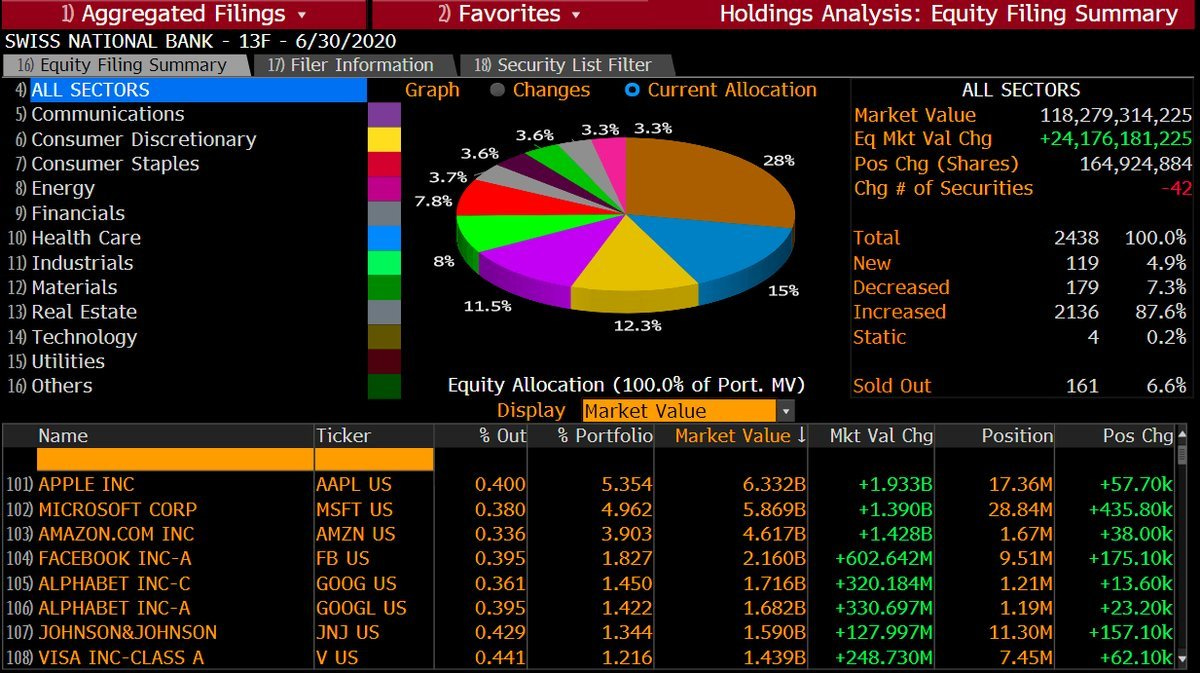
Fun fact: Swiss National Bank stocks holdings overview as of YE 2022 = $139 billions market value & 2677 positions!
Some call it a mutual fund, some jokingly a hedge fund ... quite sure a big tech investor with a 26.9% weight: Apple, Microsoft, Amazon, Google, Nvidia … then Tesla, United Health, J&J, Exxon, P&G, Visa, Chevron, Tesla, HD
SNB does not ‘trade’ to be sure here about the jokes, it tracks +/- the MSCI USA index with a 80/20 allocation between bonds & stocks (algorithmically rebalanced)

Check how it changed since the middle of 2020, very interesting ... $118 billion market value back then while now $139 billion market value
I hope you enjoyed this research & it would be great to hear your feedback! Should you have found this interesting and valuable, just subscribe & share it around with likely interested people as well. Thank you!
Have a great day!
Maverick Equity Research
Thanks, great coverage! Every time something interesting & new! Cheers!
Nice, barely coverage on Swiss stuff … can you do more in the future ? Or at least continue this … thanks!