
Dear all,
welcome to the 1st edition of the ‘Maverick Valuations’ report covering Canada via the MSCI Canada ETF (EWC). Sleek visuals & analytics via Price and Valuation scatterplot … because they say 1,000 words.
I plan to expand the Canadian coverage down the road as soon as I get good financial data so that I cover the main Canadian stock indices, equivalent how I did it for US.
Report is NOT behind a paywall & there are no pesky ads here. It would only be highly appreciated if you just spread the word around to likely interested people.
Report structure is the following:
📊 MSCI Canada ETF (EWC) 📊
🏦 Bonus Charts 🏦
What are the various likely use cases provided by this report & visual analytics? Research for market leaders & laggards, likely un/warranted cheap or expensive stocks, peers analysis, stock screener, outliers, positive or negative momentum, relative strength, full equity research on single stocks & general market assessment.
My favorite use cases:
finding future winners via further deep dives / full equity research
finding stocks that did well across past tough times, hence resilient winners … which are likely also going forward to be future winners
finding ‘Pick & Shovel’ businesses that span across industries with many use cases which can make tick 2 boxes in the same time: limited downside risk though still keeping good potential upside
Great to have at hand at least 8 times per year: before & after each of the 4 quarterly earnings. An overall yearly recap is also very interesting. Let’s see after most Q4 2022 earnings are out & usefully compare going forward with the future editions. Check your stocks & also outliers in the scatterplots, it can get interesting & food for thought.
📊 MSCI Canada ETF 📊
Let’s dive into the MSCI Canada ETF (EWC) which was created in 1996 & consists of 95 large & mid-cap stocks (including those in the main S&P/TSX 60 index). It covers diversified sectors & covers both growth & value stocks. For more info, the ETF constituents by name, ticker and sector can be found here while the factsheet here.
10 visuals total now from my side:
Introduction before anything, the overall 5 year Total Return:

Note: EWC has a 0.5% fee / year, hence on the medium-long term it can be a material dragger on the compound interest for investors vs buying the individual names.
Price action views:
2023 YTD Winners & Rebounders from their 52-week low

2023 YTD Winners & Total Return for 2022 to answer the research question: which stocks were positive both in the 2022 bear market and up to today in 2023?

Valuation views via:
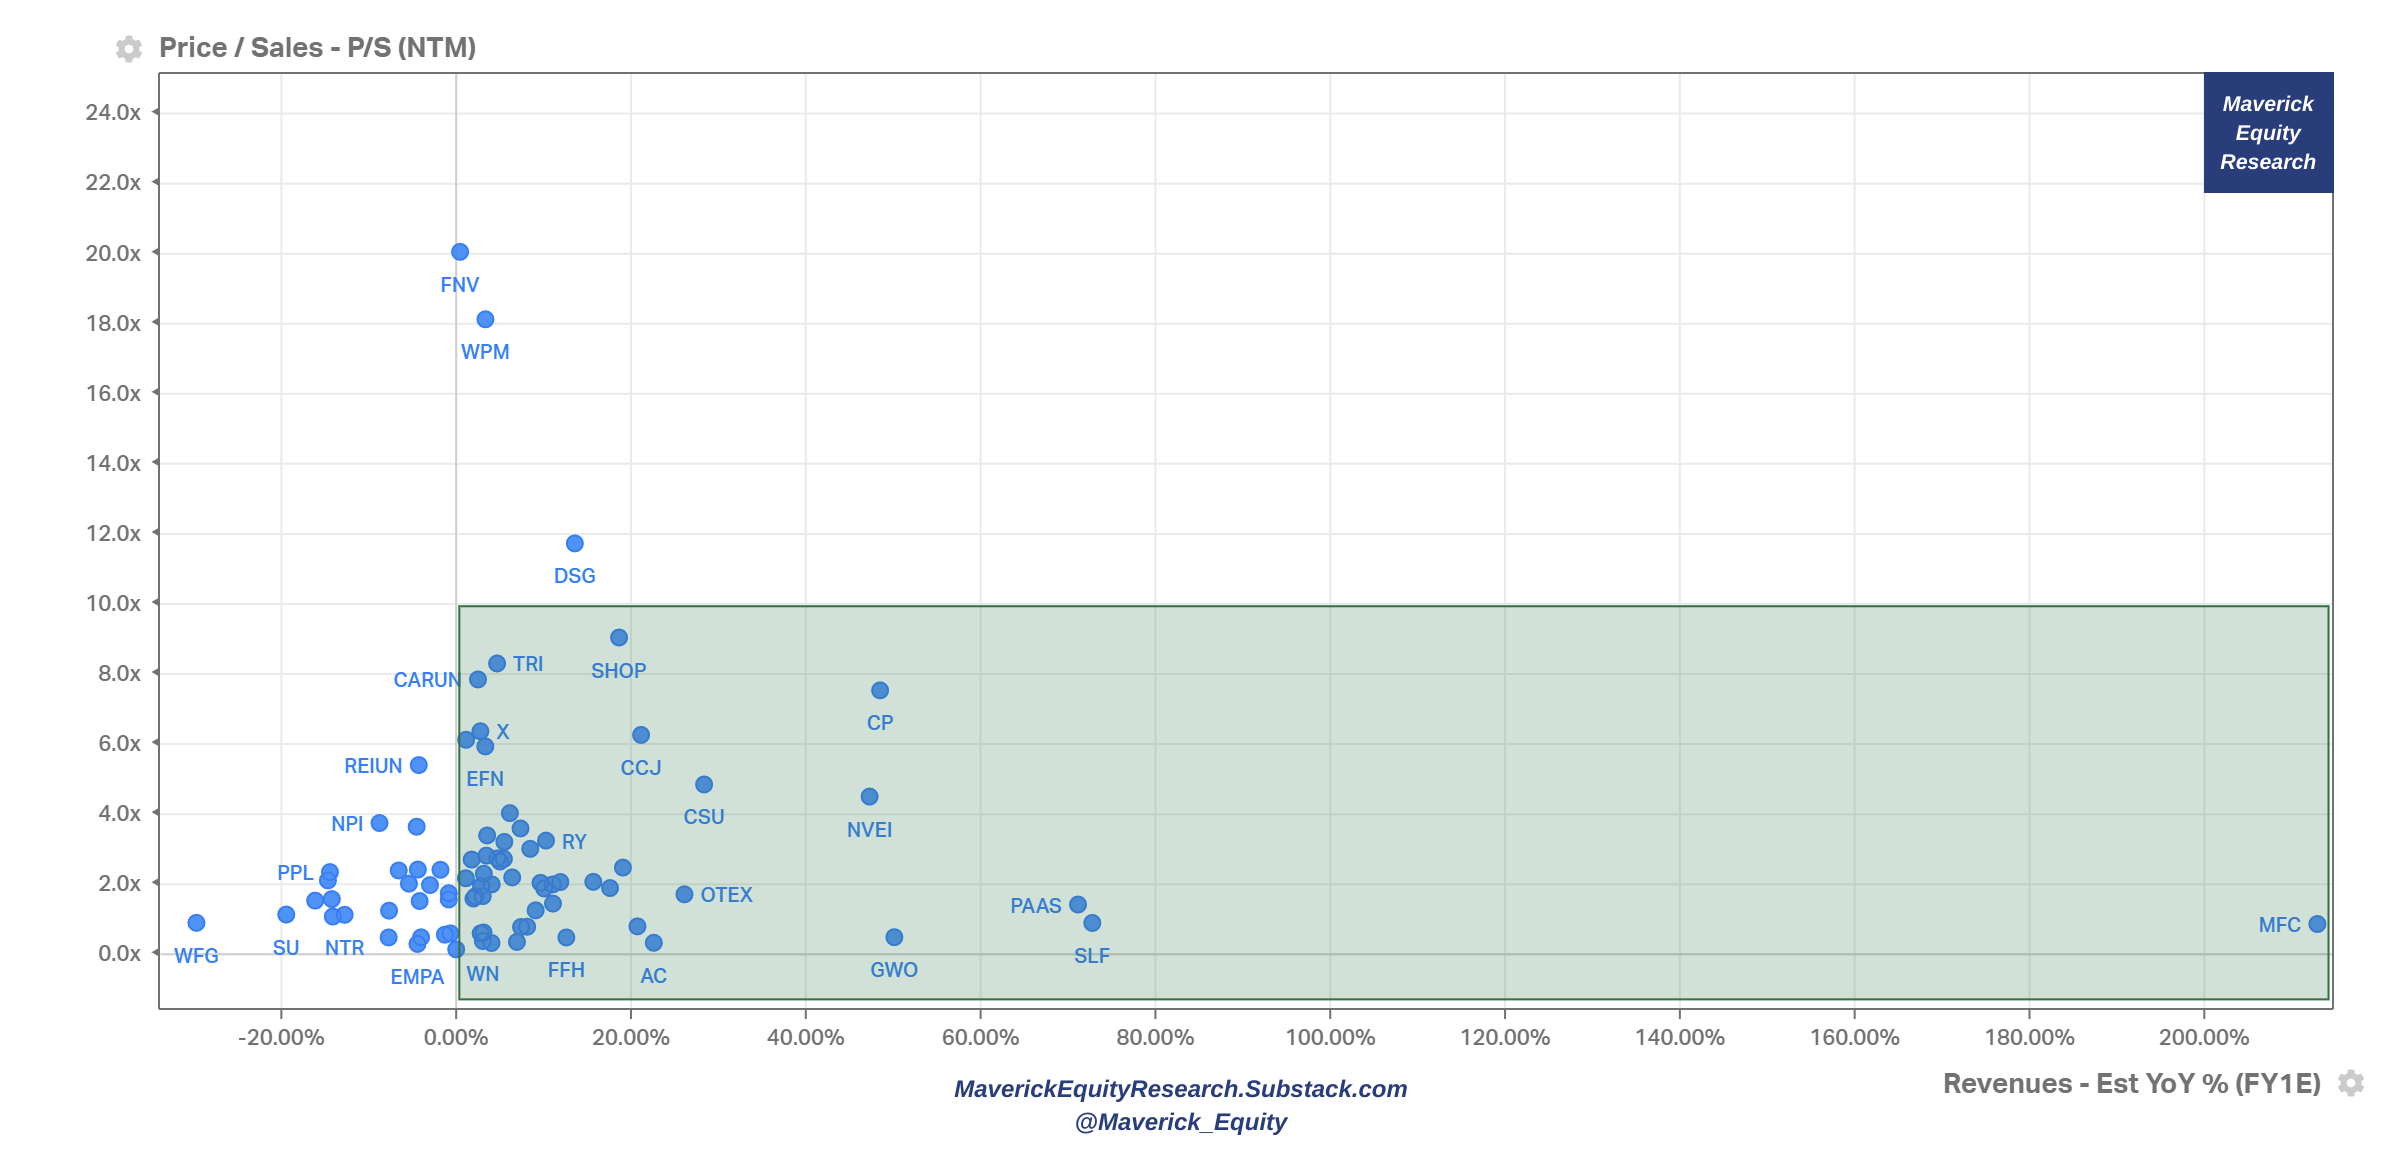
Sales/Revenue aka ‘Top-line’ view: P/S multiple & Revenue growth (next year estimates). Interpretation: Forward P/S multiple the stock is trading at for the given level of estimated Sales growth
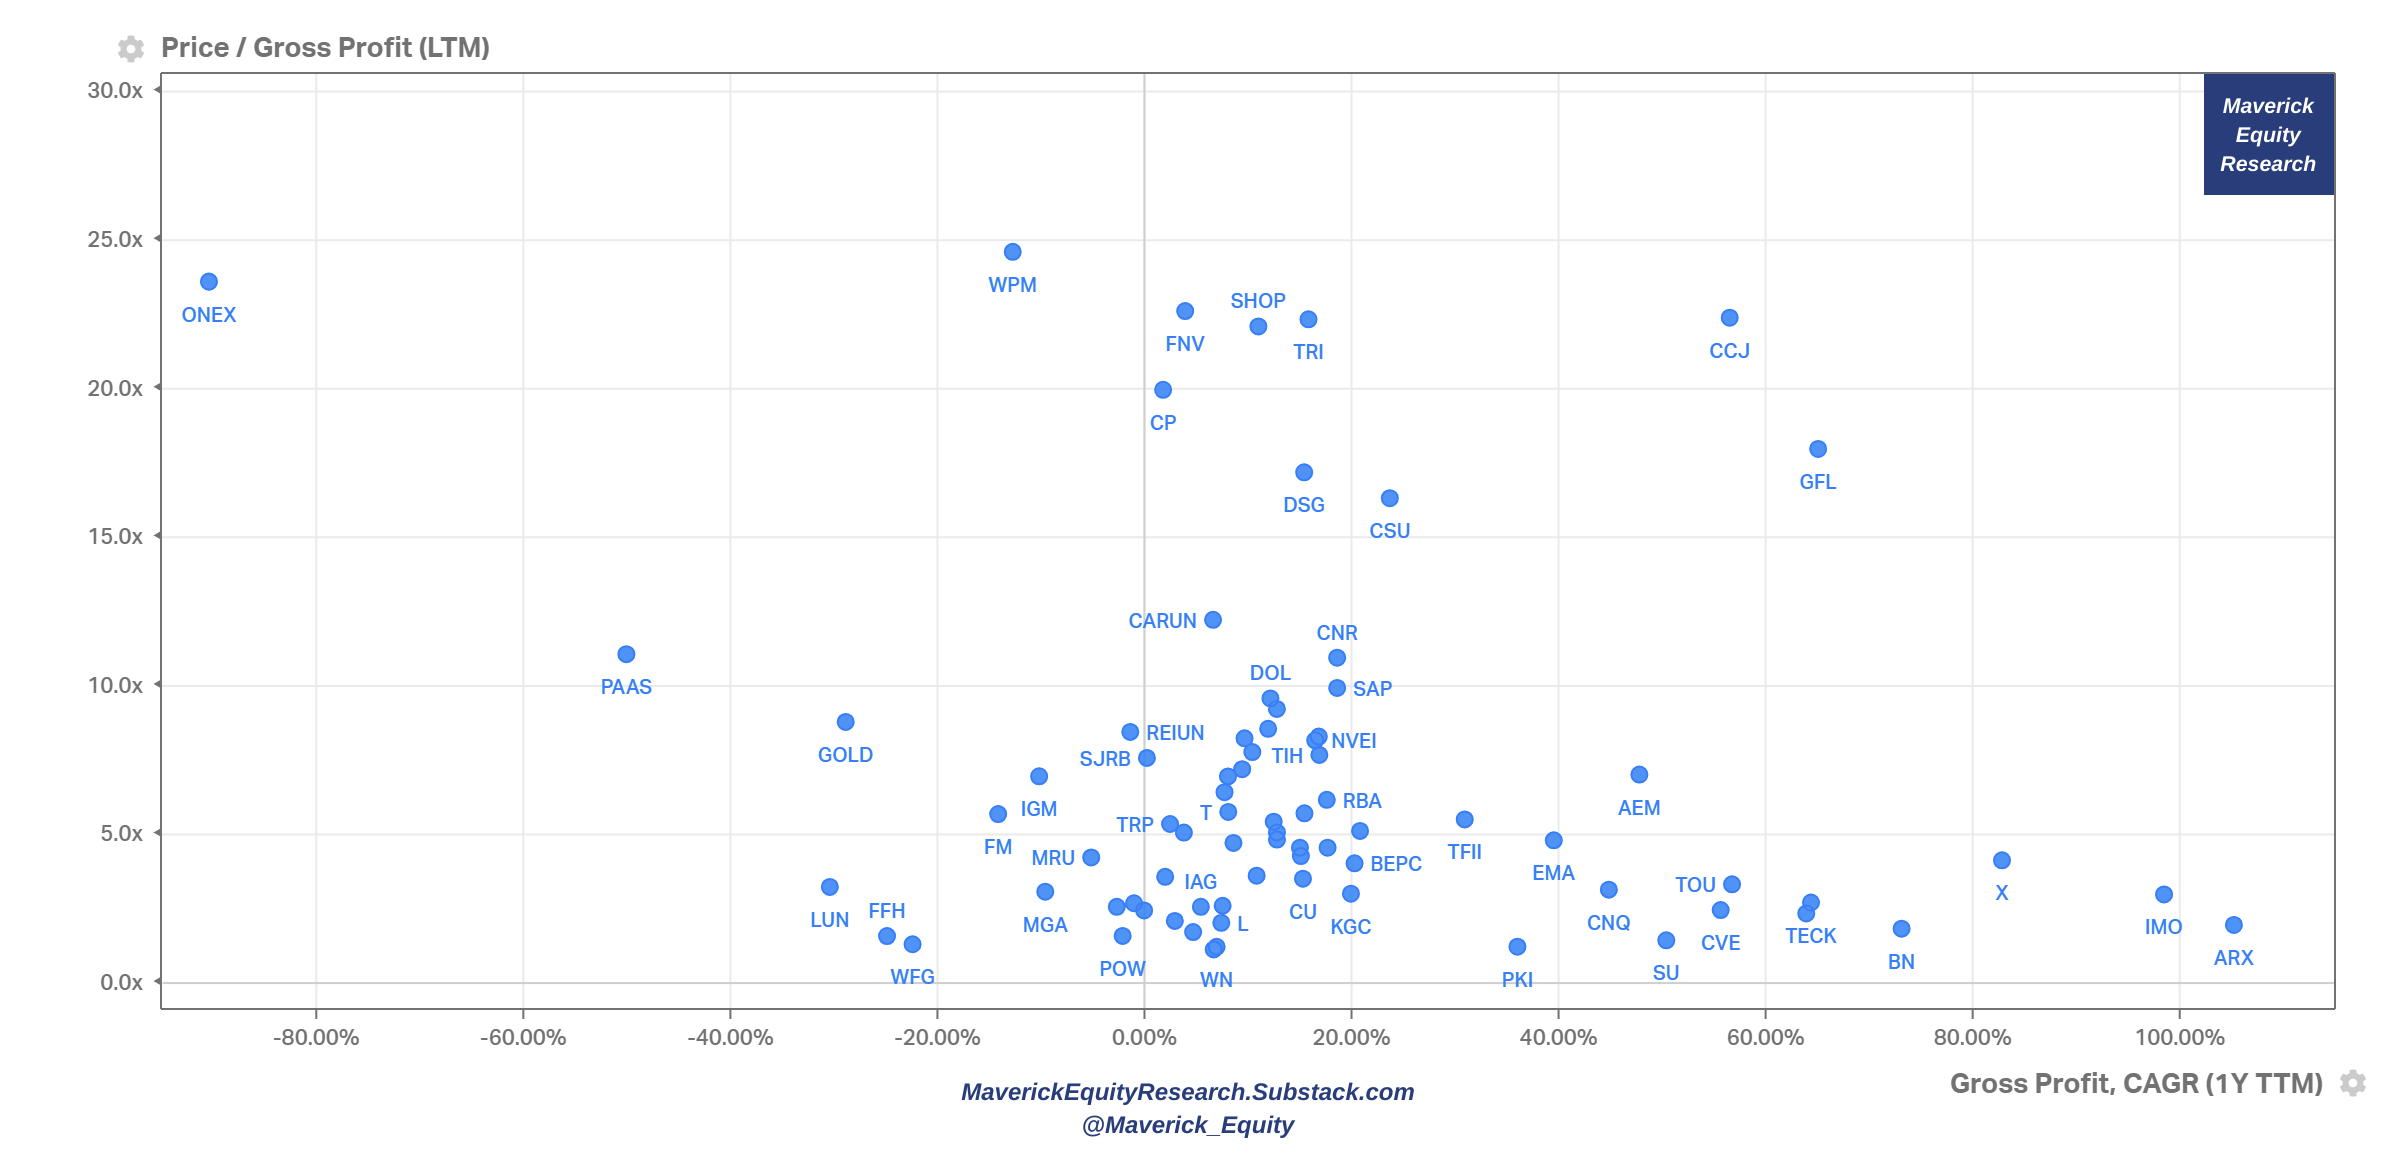
Gross Profit aka ‘gross’ view: P/GP multiple & Gross Profit CAGR (last twelve months). Interpretation: P/GP multiple the stock is trading at for the given level of Gross Profit growth
Profitability aka ‘Bottom-line’ view: P/E multiple & Earnings/EPS growth (next year estimates). Interpretation: Forward P/E multiple the stock is trading at for the given level of estimated Earnings/EPS growth

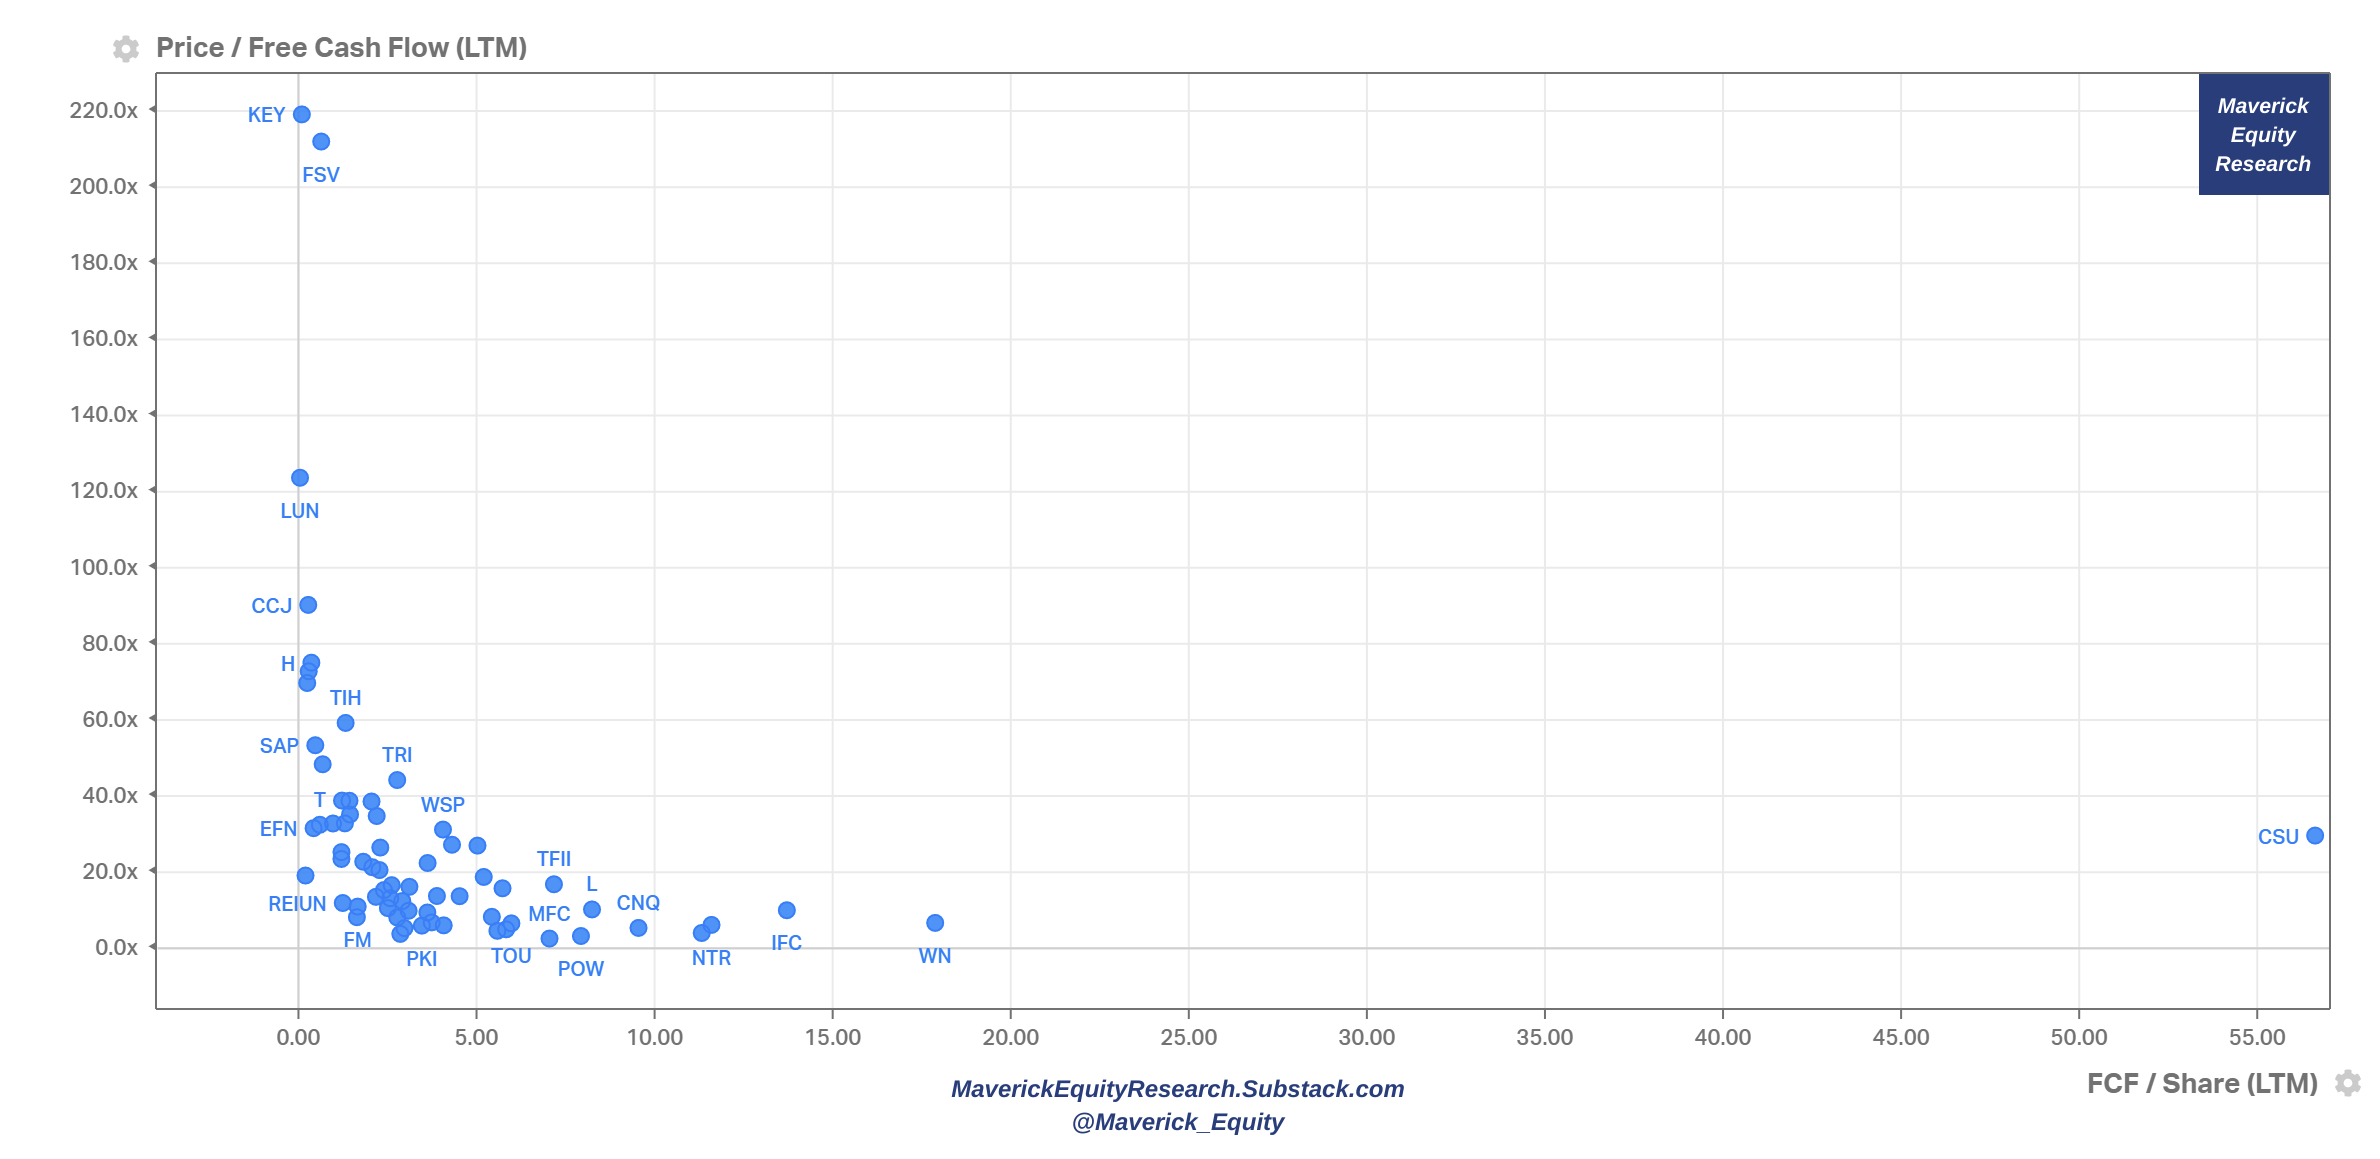
Free Cash flow aka ‘cash’ view: P/FCF multiple & FCF/Share (last twelve months). Interpretation: P/FCF multiple the stock is trading at for the given level of FCF/Share
Lastly via a side angle, 2 Enterprise Value (EV) multiples: EV/EBITDA & EV/EBIT
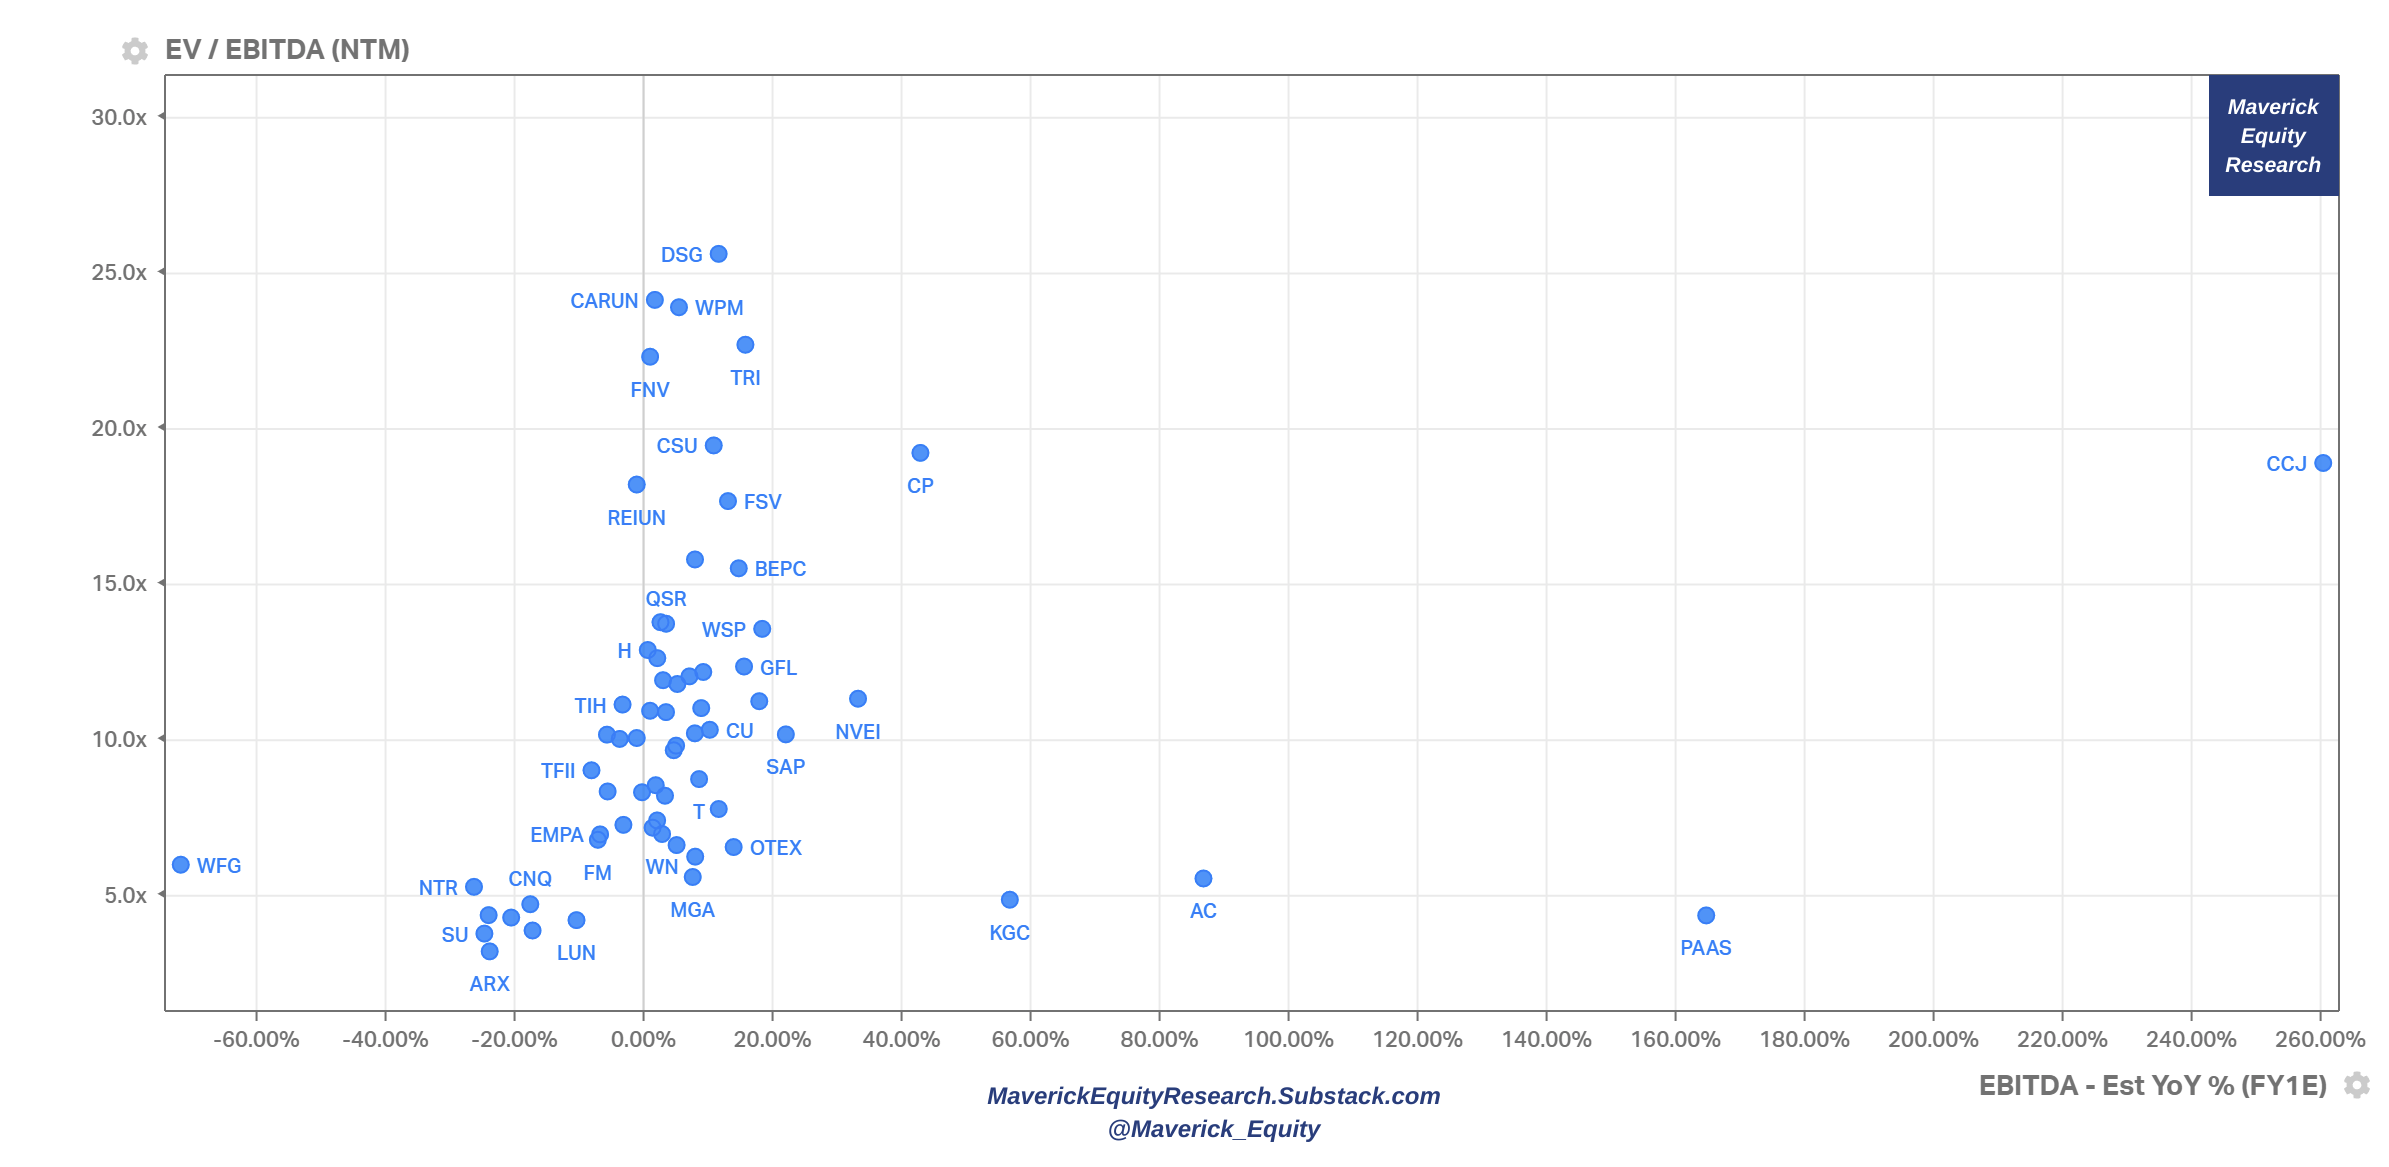
EBITDA view aka loose proxy for Cash Flow from Operations (CFO): EV/EBITDA & EBITDA growth (next full year forward estimates)
EBIT view aka core operations aka operating profit view: EV/EBIT & EBIT growth (next full year forward estimates)

Side note visual for Sales to EBITDA … to Net Profit. Naturally, more to the story once going into specific industries, sectors and single names … comparability is key.

🏦 Bonus Charts 🏦
Have you ever wondered about the combined Short Interest & Total Return on these big Canadian basket of stocks? 3 visuals total and a takeaway: stocks with high return & low short interest can be seen as carrying positive sentiment & resilient winners.
Total Return in 2023 vs Short Interest: some short could have worked

Total Return for the past 12 months vs Short Interest: given the 2022 bear market, some more shorts could have worked

Total Return for the past 3 years vs Short Interest: but it’s hard to stop a moving train & shorting blue chips from essentially any market, will likely result in losses the more one holds the position … unless short term & super due diligent, very hard business.

I hope you enjoyed this research & it would be great to hear your feedback! Should you have found this interesting and valuable, just subscribe & share it around with likely interested people as well. Twitter post can be found here. Thank you!
Have a great day!
Maverick Equity Research
‘which stocks were positive both in the 2022 bear market and up to today in 2023?’, thank you, that was great insight … very interesting overall
thanks, great to see also some Canadian coverage ... cheaper market than US overall ...