Dear all,
as mentioned previously, and also part of the About section, one big project and service that I am working on is launching Maverick Model Portfolios (MMPs)!
First and foremost, so that we are on the same exact page, what are Model Portfolio? They are ready to invest fully constructed portfolios based on various key parameters:
returns = historical and future expectations
risk capacity = financial ability and flexibility: income security, reserves, withdrawal needs e.g. incoming big events like buying a house or retiring
risk tolerance = emotional resilience: a subjective behavioral trait as reactions during past market crashes and especially, the likely reaction in the future
investment horizon: medium to long-term approaches
liquidity needs: short to medium term variables predominantly
costs and fees: to invest and gain access to e.g. broker, products, portfolio
taxes: tax aware investing as after-tax returns are key for compounding wealth
Naturally, there are trade-offs which have to be properly understood and accepted, while in the same time, we can do various optimisations for the various trade-offs.
This post covers Portfolio Management 101, a walkthrough of the performance of various asset classes via 12 Maverick Charts for 10,000 Words! All that paired with valuable historical economic and financial insights.
Equipped with insights and food for thought for the future, we’ll wrap up with a quick preview of the Maverick Model Portfolios (MMPs)!
Table of contents:
Introduction:
📊 U.S. Asset Long-Term Returns: $1,000 invested from 1925 to 2026
📊 U.S. Recessions, Stocks Bear Markets and Drawdowns since 1925
📊 U.S. Asset Long-Term Returns: $1,000 invested from 1970 to 2026
📊 U.S. Recessions, Stocks Bear Markets and Drawdowns since 1970
📊 U.S. Asset Long-Term Returns: $1,000 invested from 1995 to 2026
📊 U.S. Recessions, Stocks Bear Markets and Drawdowns since 1995
Maverick Model Portfolios (MMPs) preview:
📊 All-Weather, Core-Satellites, All-Equities
📊 U.S. Asset Long-Term Returns: $1,000 invested from 1925 to 2026 📊
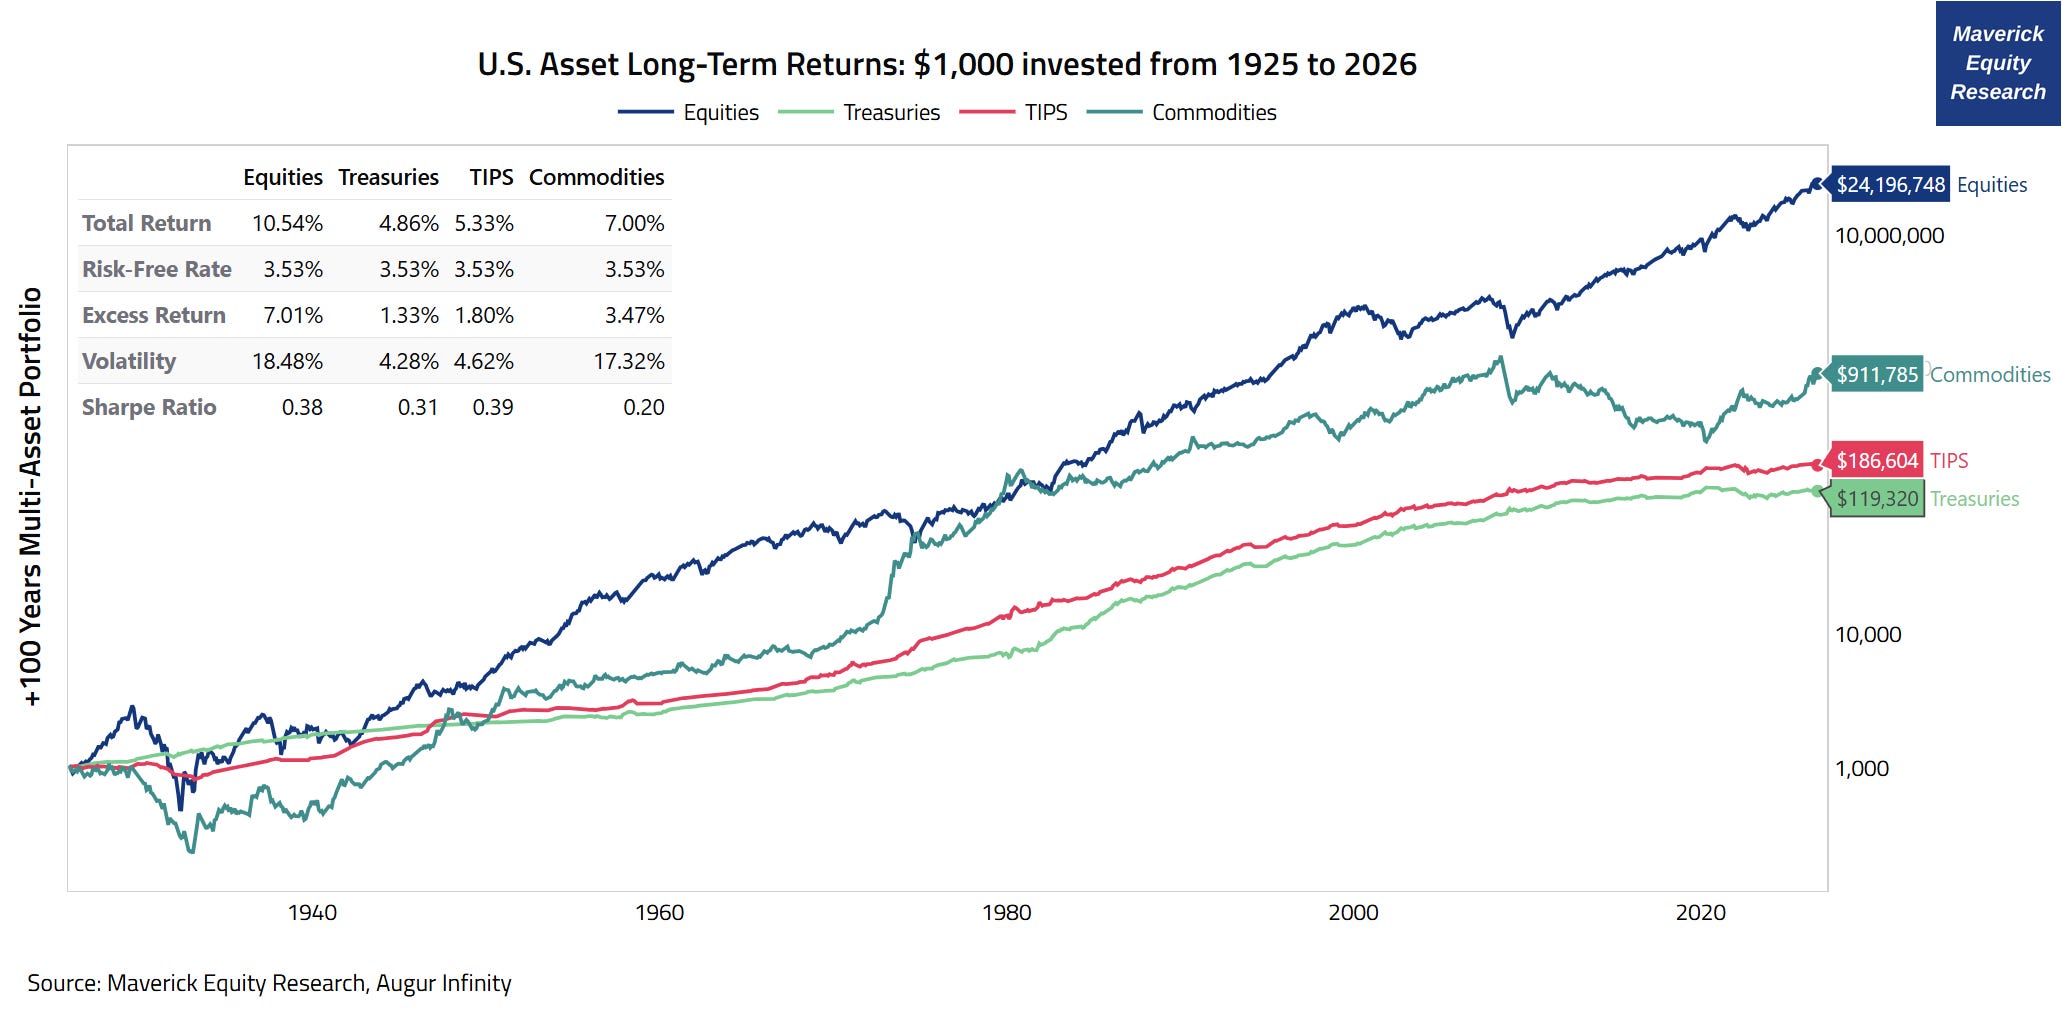
Let’s begin with a very rare Maverick Chart: $1,000 invested in Stocks, Treasuries, TIPS & Commodities from January 1925 to September 2026 + key statistics:
👉 Equities (S&P 500):
+10.54% annualized return with a 18.48% annualised volatility
0.38 Sharp Ratio with a 7.01% excess return
$1,000 turned into 24,196,748 millions = bonkers good!
👉 Commodities:
+7.0% return with a 17.32% volatility — note, just a bit below equities
0.20 Sharp Ratio (you did likely expect more) with a 3.47% excess return
$1,000 turned into $911,785
👉 Treasury Inflation-Protected Securities (TIPS):
+5.33% return with a 4.62% volatility which is a bit higher than treasuries
0.39 Sharp Ratio that you should be positively surprised about: higher than both Equities and Treasuries, and with a 1.80% excess return
$1,000 turned into $188,604 = decent given risk free, both nominal and real
👉 Treasuries:
+4.86% return with a way lower 4.28% volatility
0.31 Sharp Ratio with a 1.33% excess return
$1,000 turned into $119.320
📊 U.S. Recessions, Stocks Bear Markets and Drawdowns since 1925 📊
“Why are you showing +100 years of asset classes returns, Mav”?
Great question! Many reasons, yet the key ones:
👉 Zooming out to begin wit: it shows beautifully how the various key asset classes performed & behaved, more or less since the beginning of the modern capitalism era
👉 Starting point in order to think how to construct various portfolios with different risk/return characteristics, and all with a forward looking view
👉 Anti-Fragile and Resilience — we have been through a lot in 100 years:
16 recessions since 1925 (NBER official arbiter of U.S. business cycles), and duration wise: 23 months on average Pre-WWII Era, 10.3 months Post-WWII Era
incredible human progress, a lot of regimes, wars, pandemic, geopolitics, and with that, many business cycles with their naturally occurring recessions
Overall, downturns used to be more frequent, so today’s investors are out of practice:
from the mid-1980s to 2007 we even had the ‘Great Moderation’, which was a dominant theory that signalled we got way better at managing the business cycle, yet the 2007–2009 Global Financial Crisis (GFC) challenged big time that view
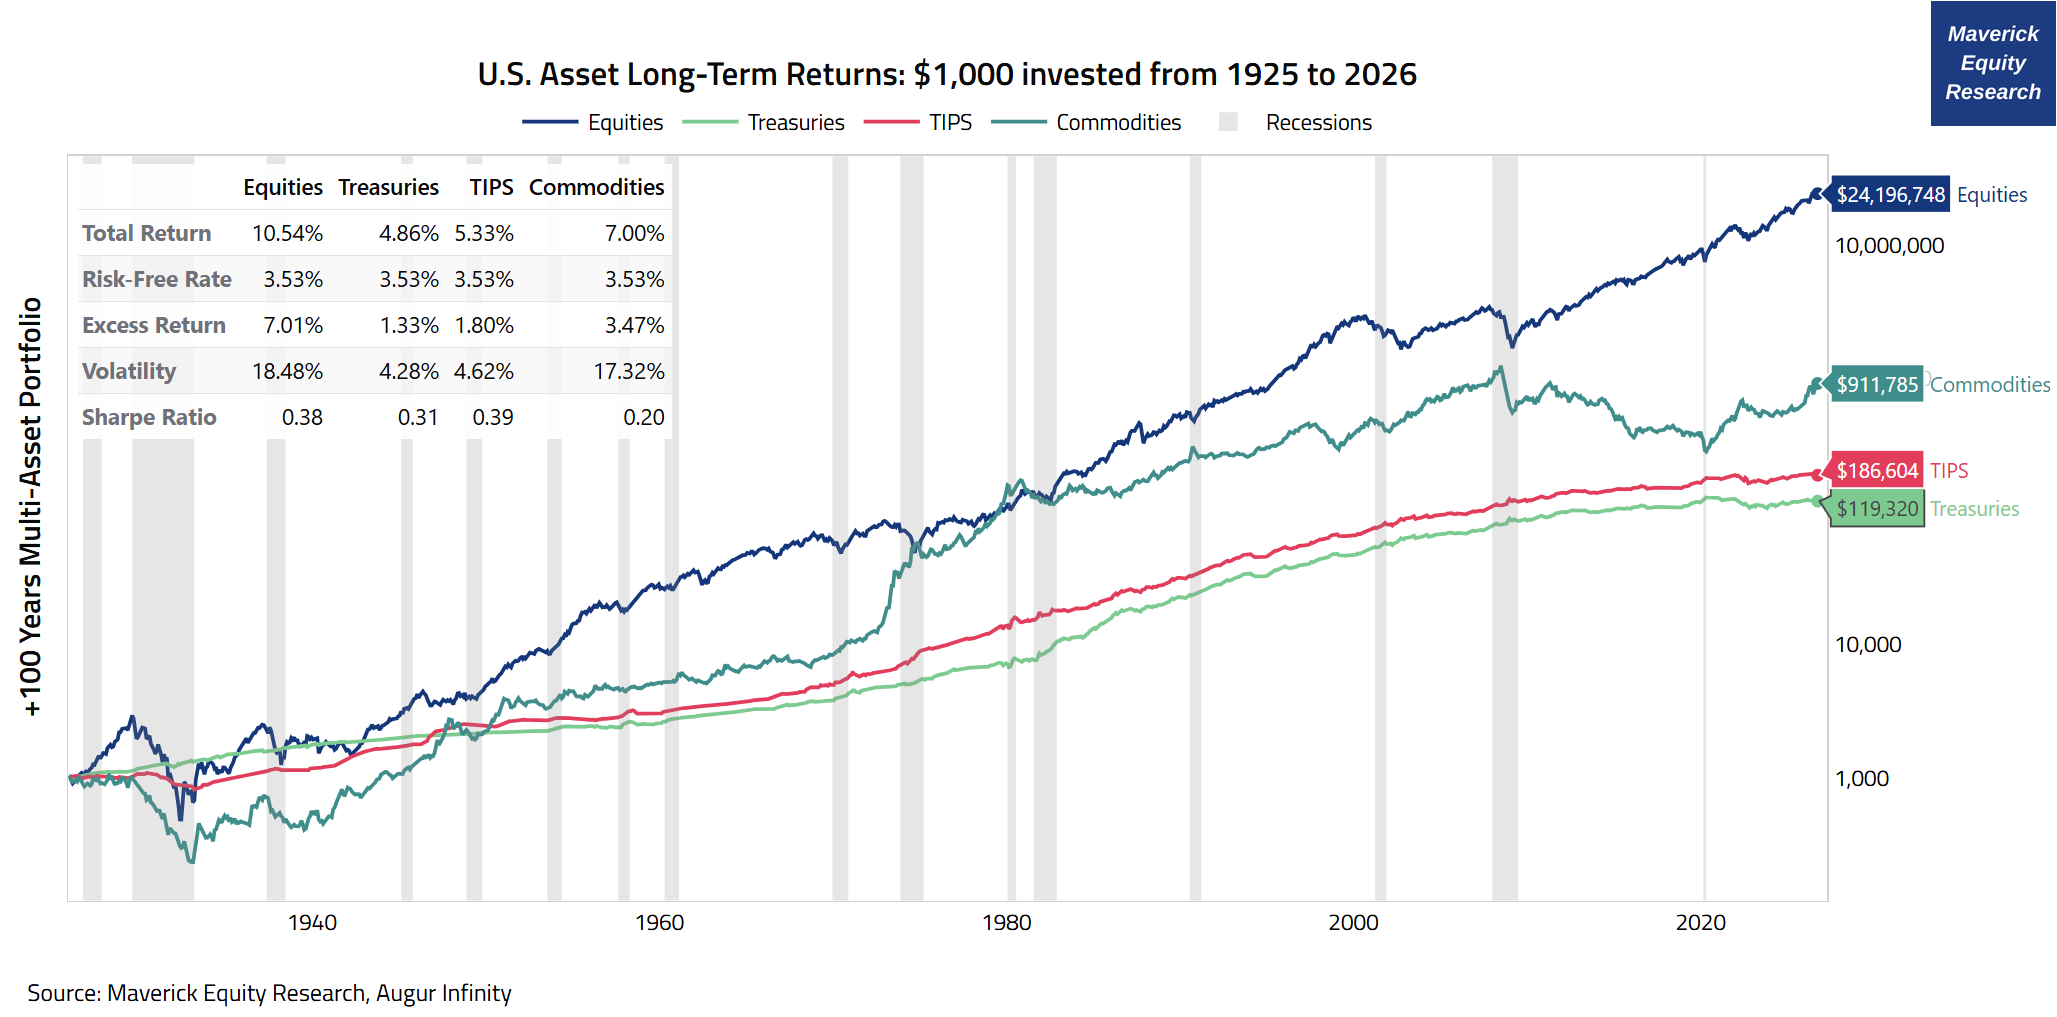
all in all, we did get better managing the business cycle since 1925, which is complementary visualised below adding recessions periods (grey bars)
Below the chart where I added extra the Recessions = shaded grey areas:
“Recessions are nice to see, but Mav, can you show us stock market drawdowns”?
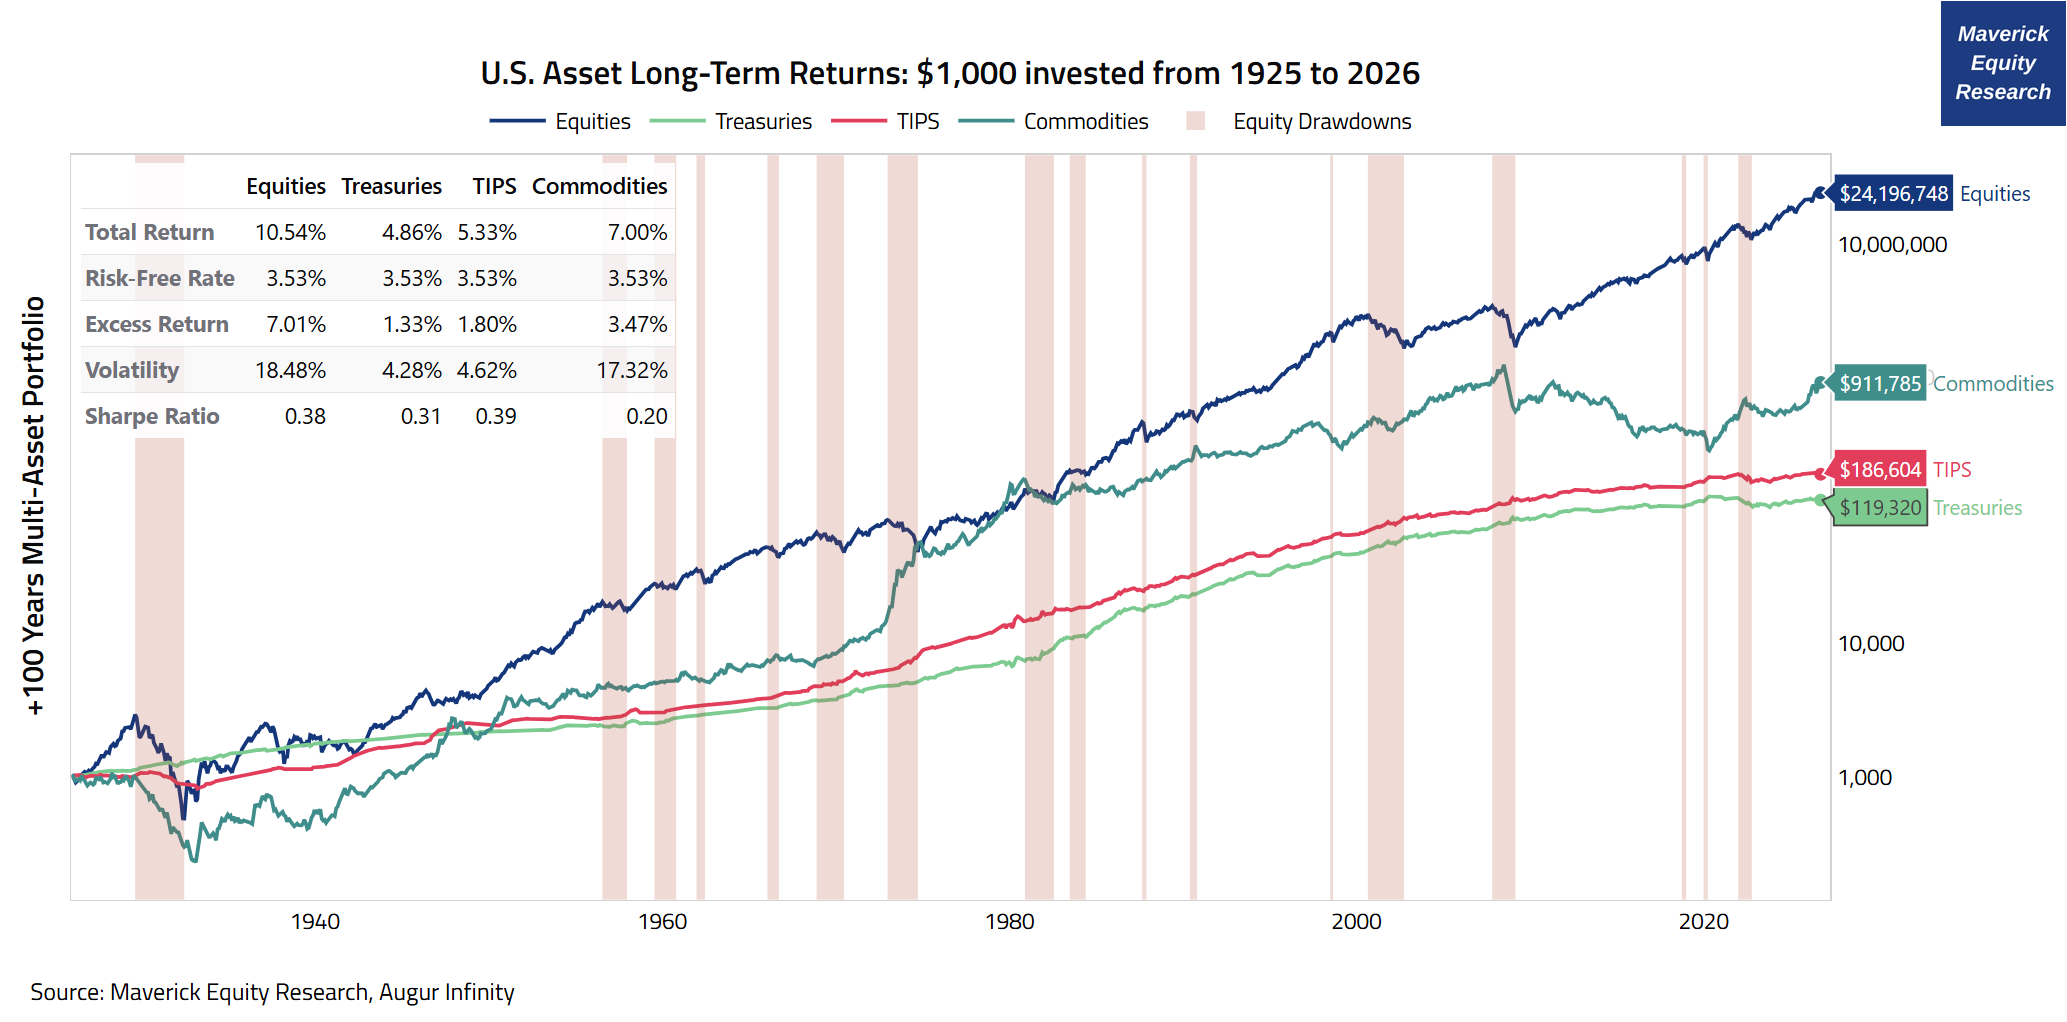
Yes, I can! Check the same chart where I added drawdowns as red shaded areas. Also check the followings bear markets stats (-20% drops or more) which are frequent also:
👉 Drops & Gains (average): stocks drop -35% on average in a bear market, yet what about gains? +112% gains during a bull market — quite good, isn’t it?
👉 Bear & Bull market duration: 289 days (9.6 months) = average length of a bear market, which is way shorter than that of a bull market, namely 988 days or 2.7 years
👉 Bear & Bull market % in which mode: stocks the rise 78% of the time
👉 Frequency: every 3.7 years = the long-term bear markets average frequency
Maverick key forward looking note = with a 20-30 years investment horizon:
you should expect to digest about 6-10 bear markets
out of which 2-4 big ones … let that one sink in … more on that in a future post
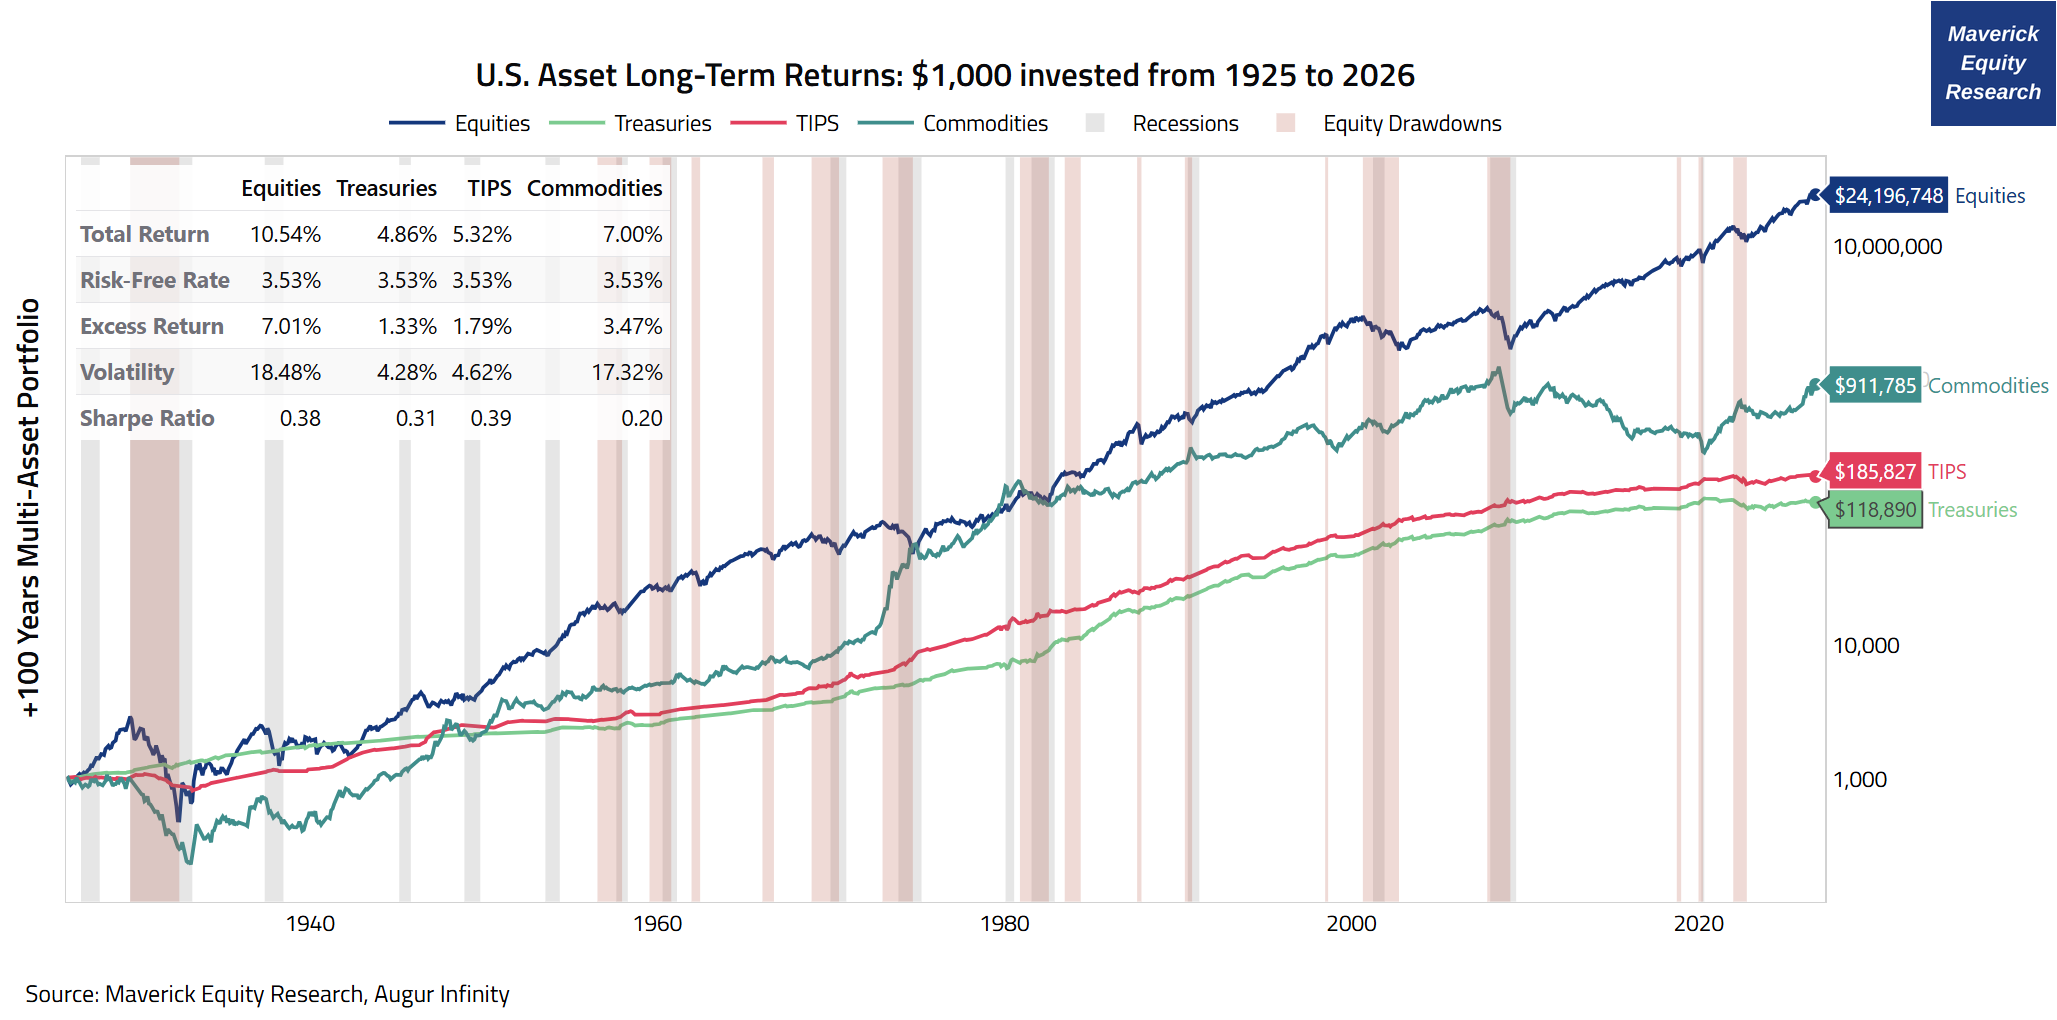
The visual covering both Recessions (grey) and Equity Drawdowns (red) since 1925:
👉 bear markets do not necessarily come with an economic recession as a package, and the other way around, yet the overlap is substantial in both directions, and to be noted, bear markets are more frequent than recessions
Total count: 27 bear markets with 16 recessions
Average frequency: bear markets every 3.7 years with recessions every 6.3 years, hence bear markets occur roughly 1.7 times more often than economic recessions
👉 wondering what are the primary drivers of each?
Bear markets: forward-looking narrative shifts with their related investor sentiment, corporate earnings expectations, liquidity shifts, shocks/black swans, or just simply dropping by 20% or more from very overvalued levels
Recessions: backward-looking broad declines in economic activity across the economy lasting more than a few months: consumer spending, real income, employment, industrial production, retail sales and related real GDP drop
📊 U.S. Asset Long-Term Returns: $1,000 invested from 1970 to 2026 📊
Initially, you saw above +100 years of returns + key statistics. Long time series are something many in finance/economics/statistics love (including myself), yet key questions and points need to be addressed:
1) How similar is the economy from 1925 to 2026? Quite different:
1920s was just when we transitioned from horse-drawn carriages in cities (still a familiar sight in rural areas) to mass-produced and affordable car (led by the Ford Model T) — nowadays EVs, Hybrids, Plug-In Hybrids, autonomous or semi-autonomous cars are quite common
in 1920, only 1% of U.S. homes had both electricity and indoor plumbing, meaning the vast majority of people did not have a modern bathroom — nowadays, we send rockets in space with various orbital, lunar and soon likely Mars missions
the banking system from the 1920s to today’s one is like day & night, even compared to pre 2007-2009 there is a massive difference — I know that in quite detail as I did my thesis on the topic, but that story is for another day 😉
In short and in Maverick terms:
“From shitting in the bushes (in the Outhouse/Privy), to electricity and modern bathrooms, a solid banking system, super modern cars, fancy mobile phones with unparalleled access to information, to democratised and global investing, we have come a very long way, brother! Wanting more is great, actually a pre-requisite for human progress, but let’s also appreciate what we have, show some gratitude, be in the present and enjoy our achievements, brother!“
Hear it from Warren Buffett as well:
"I have been in a golden age ever since I was born [1930]. The world has changed so much for the better in terms of how well off people are compared to any other time in history. If I had been born 150 years ago and went to the dentist, they'd pour whiskey down me [instead of local anesthetic]. There are just all kinds of improvements!"
2) Investing is always a forward looking activity
history is the greatest teacher, and also an underrated investing advantages
yet while the past is representative, hence valuable, investing has to be always done with a forward looking lens (otherwise, better to become a pure historian)
3) Recent Economy = Recent Returns = More Representative Going Forward
looking at the more recent modern economy and related financial returns of various asset classes, is a better representation for our outlook going forward
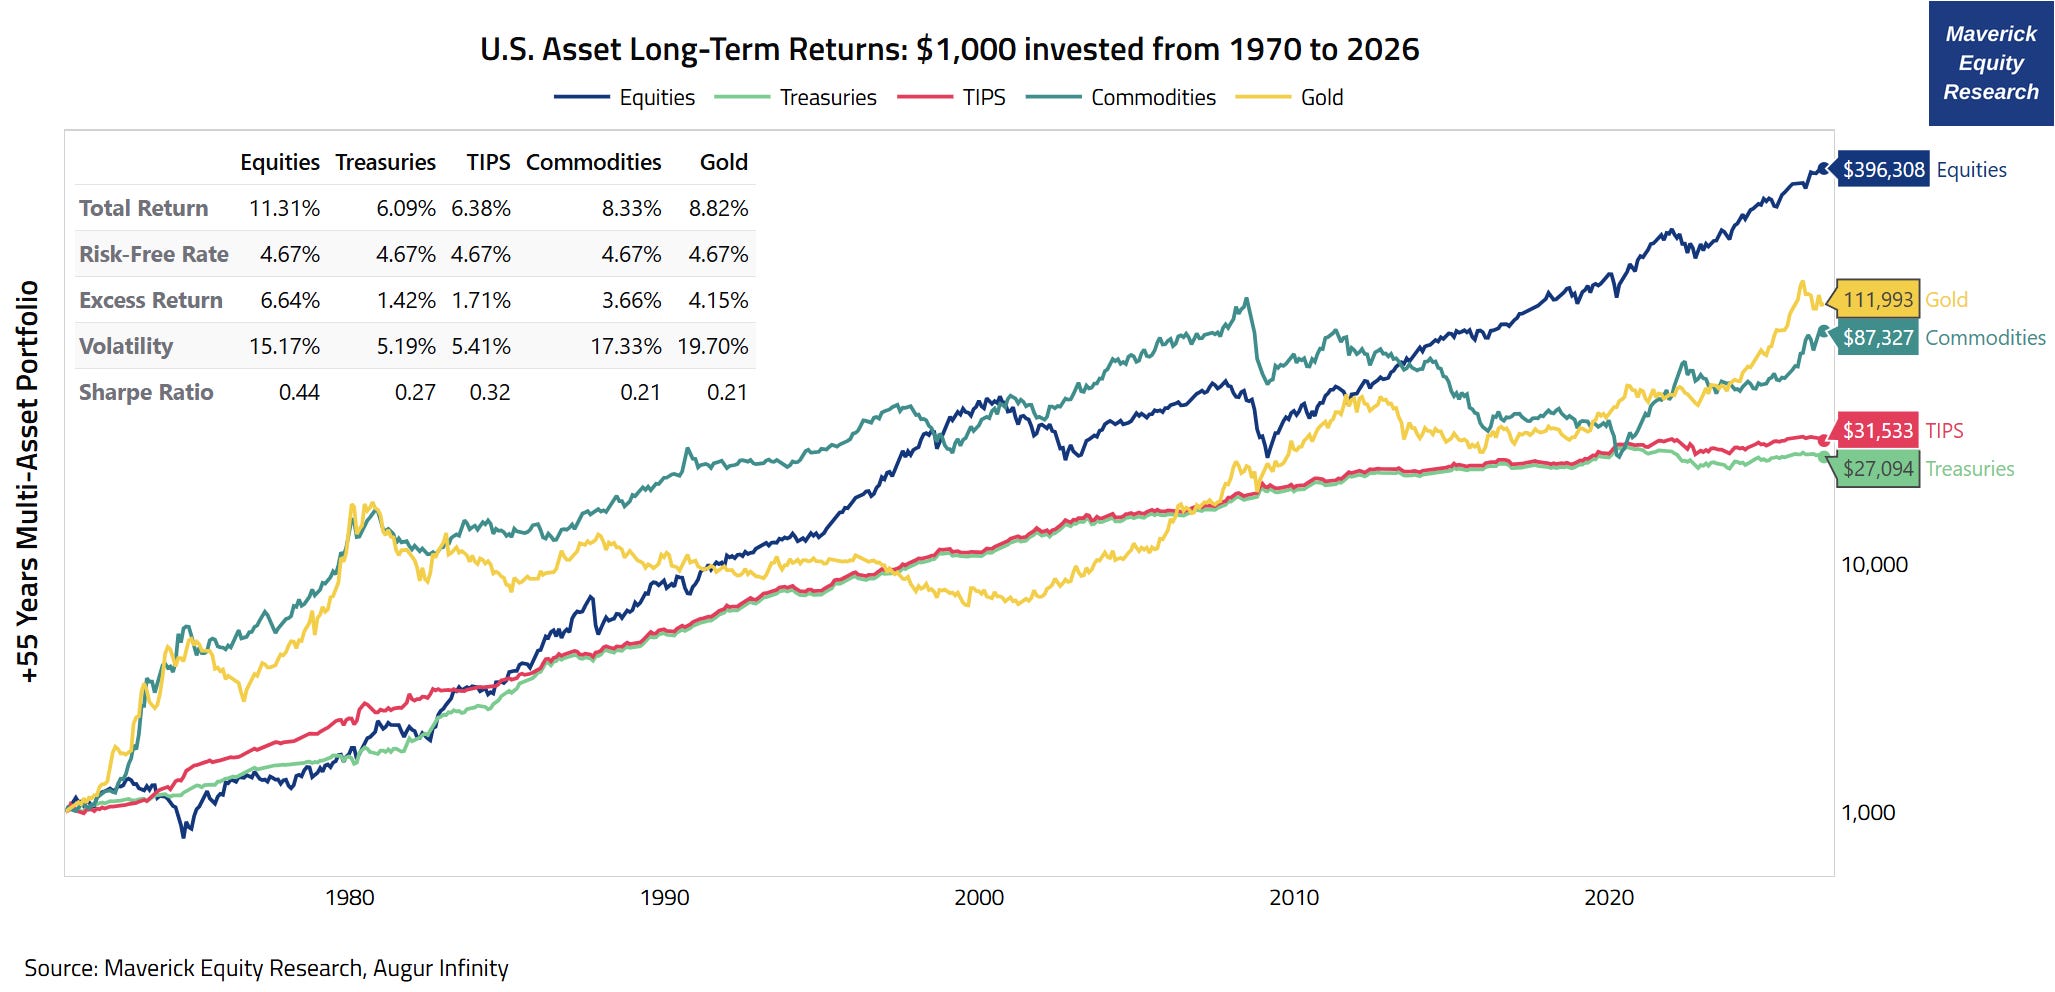
Therefore, check $1,000 invested in Stocks, Treasuries, TIPS, Commodities + Gold since 1970 to 2026 + key statistics — note, the golden boy Gold asset is new here:
👉 Equities (S&P 500):
+11.31% average annualized return with a 15.17% annualised volatility = higher returns mixed with lower volatility compared to since 1925
0.44 Sharp Ratio with a 6.64% excess return
$1,000 turned into 396,308 = bonkers good as well!
👉 Commodities:
+8.33% return with a 17.33% volatility = higher returns with similar volatility compared to since 1925
0.21 Sharp Ratio (you did likely expect more) with a 3.66% excess return
$1,000 turned into $83,327
👉 Treasury Inflation-Protected Securities (TIPS):
+6.38% return with a 5.41% volatility which is a bit higher than treasuries
0.32 Sharp Ratio which is higher than Treasuries, and with a 1.71% excess return
$1,000 turned into $31,533 = very decent given risk free, both nominal and real
👉 Treasuries:
+6.09% return with a lower 5.19% volatility
0.27 Sharp Ratio with a 1.42% excess return
$1,000 turned into $27,087
👉 Gold:
+8..82% return with a 19.7% volatility = sweet returns mixed with high volatility
0.21 Sharp Ratio with a 4.15% excess return
$1,000 turned into $111,993 = very good!
You might wonder, what was my economic rationale for choosing since 1970?
👉 Peaceful times: post WWII 1939-1945 with way more peaceful times onwards
👉 Gold Standard: in 1971 U.S. President Richard Nixon ended the gold standard, hence shifting the global economy to a fiat currency system
👉 Bretton Woods: 1971–1973 system fallout meant the end of fixed exchange rates which allowed capital to move across borders with far fewer restrictions
👉 Microprocessor: 1971 invention meant we switched into the Information Age which drove unprecedented productivity growth, and gave rise to entirely new industries — as microprocessors grew exponentially more powerful (following Moore’s Law) their economic implications triggered a positive structural revolution
👉 Oil Crisis: 1973 supply shock triggered a sharp recession combined with high inflation, hence a nasty stagflation — it forced Western economies to restructure, accelerating the shift toward deregulated financial markets and international lending
👉 Hyper-Globalization: mid-1970s marked the transition into a significantly deeper phase of globalisation, often called hyper-globalization or modern globalization:
Deep integration: production becomes fragmented across global value chains with components made anywhere, hence driving down costs
Free Trade Agreements: 1994 North American Free Trade Agreement (NAFTA) and the economic opening of China and the Soviet bloc
👉 The Great Moderation: mid-1980s start of a period when U.S. macroeconomic volatility sharply plummeted as we got better at managing the business cycle
👉 Returns data quality: compared to 1925, the last decades carry way more cleaner data quality measuring the returns and key stats for various asset classes — recall that the current official format of the S&P 500 index dates back to 1957, while in general for all asset classes, data quality is less good the more we go back in time (previous other formats, reconstructed, backfilling etc)
Overall, the recent modern economy since 1970 is more representative for both nowadays & going forward, and so are the financial returns from various asset classes.
📊 U.S. Recessions, Stocks Bear Markets and Drawdowns since 1970 📊
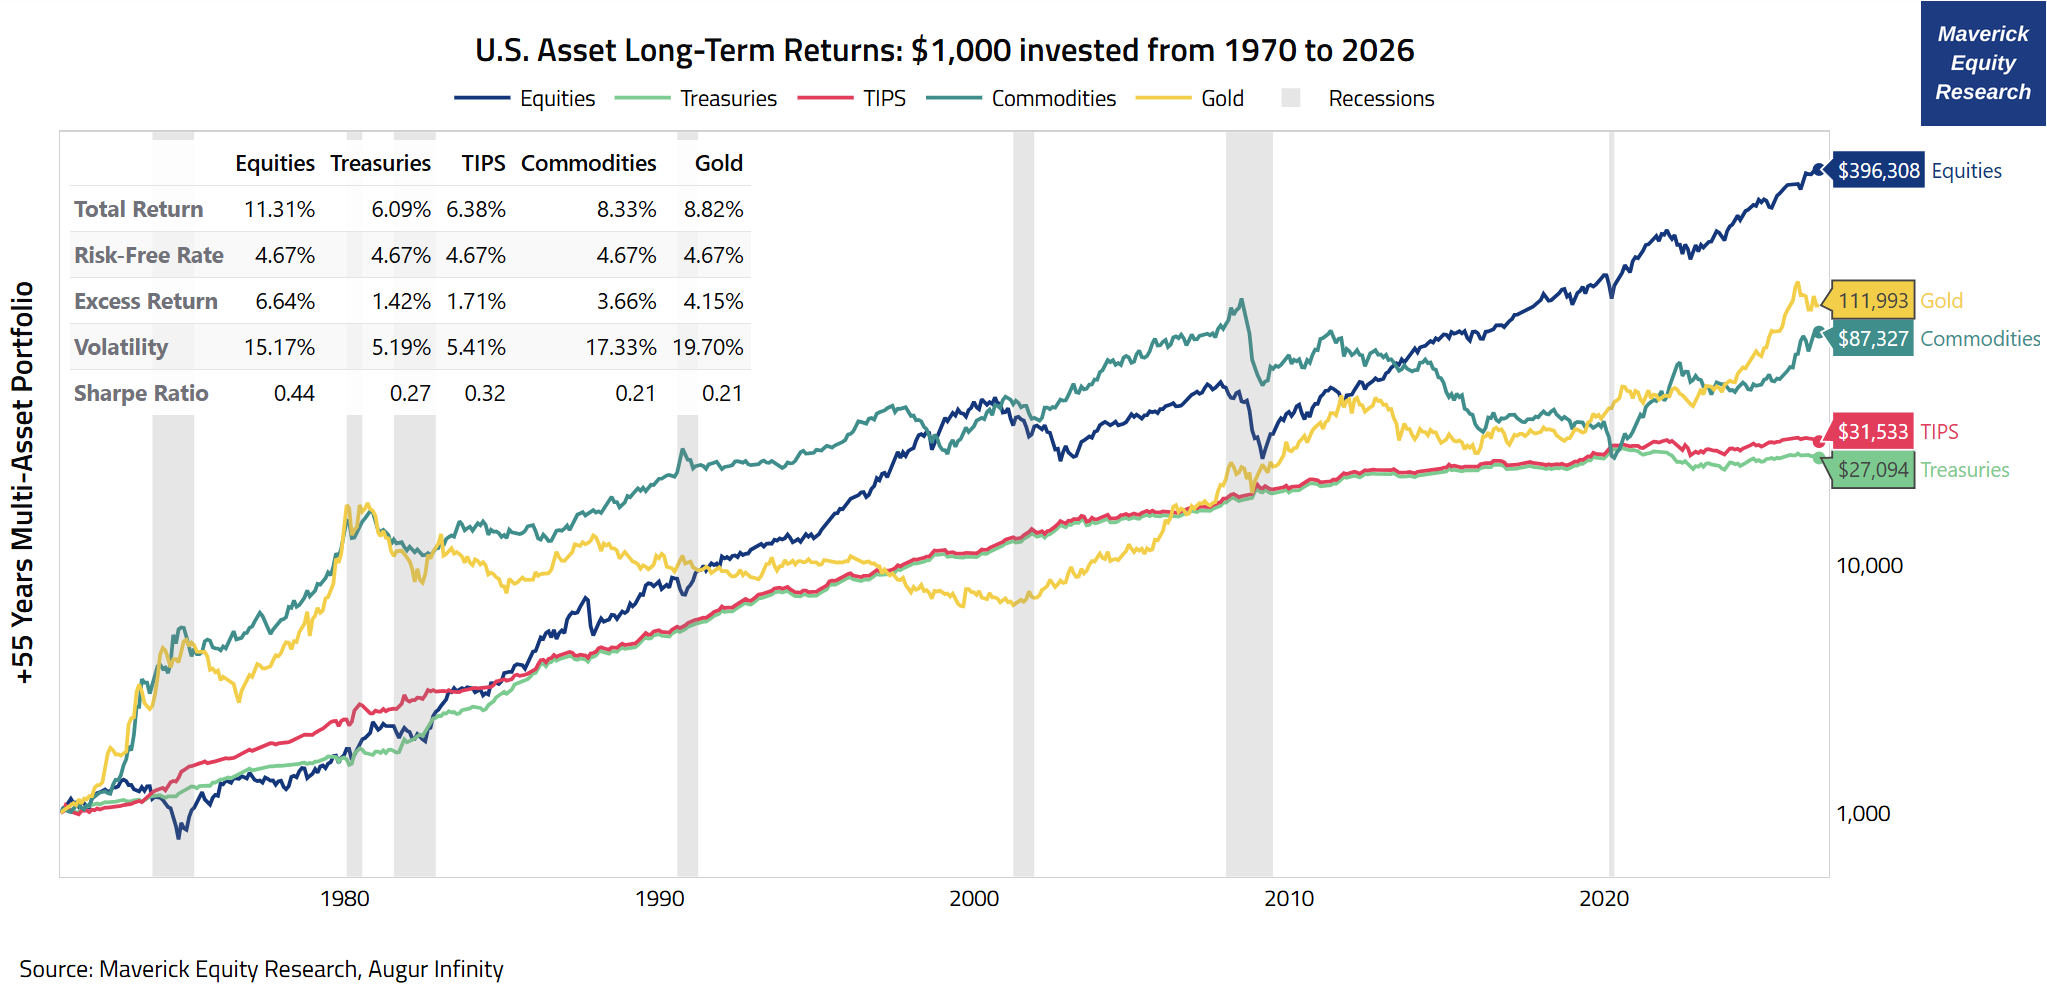
How many recessions since 1970?
👉 7 occurrences
What was the duration on average?
👉 10.6 months (74 total months divided by 7), hence less than a year = very good!
What were the top 3 longest recessions?
👉 16 months Nov 1973 – Mar 1975
👉 16 months Jul 1981 – Nov 1982
👉 18 months Dec 2007 – Jun 2009 = the big one = the GFC/Lehman!
Below the chart where I added extra the Recessions = shaded grey areas:
“Recessions are nice to see, but Mav, can you show us stock market drawdowns”?
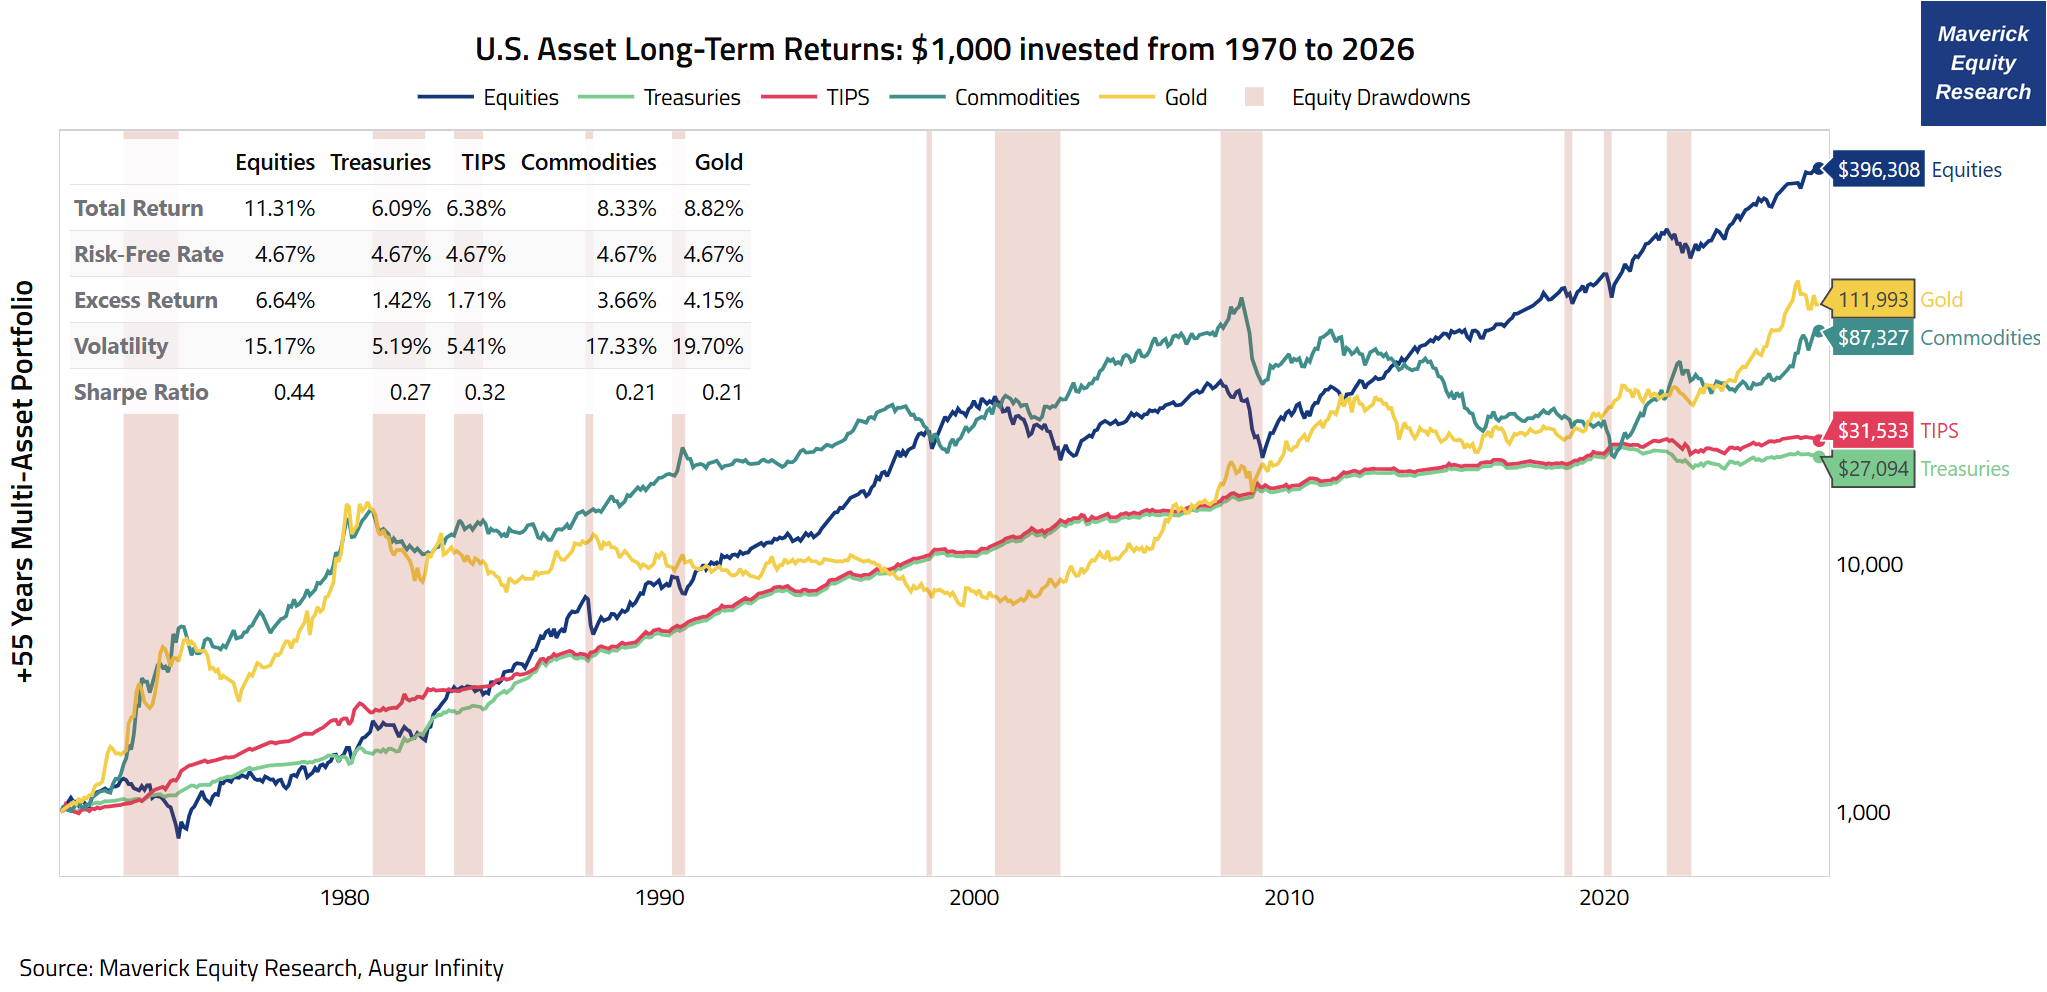
Yes, I can! Check the same chart where I added drawdowns as red shaded areas.
How many stock market drawdowns since 1970?
👉 11 occurrences, some bigger and longer, some smaller and shorter
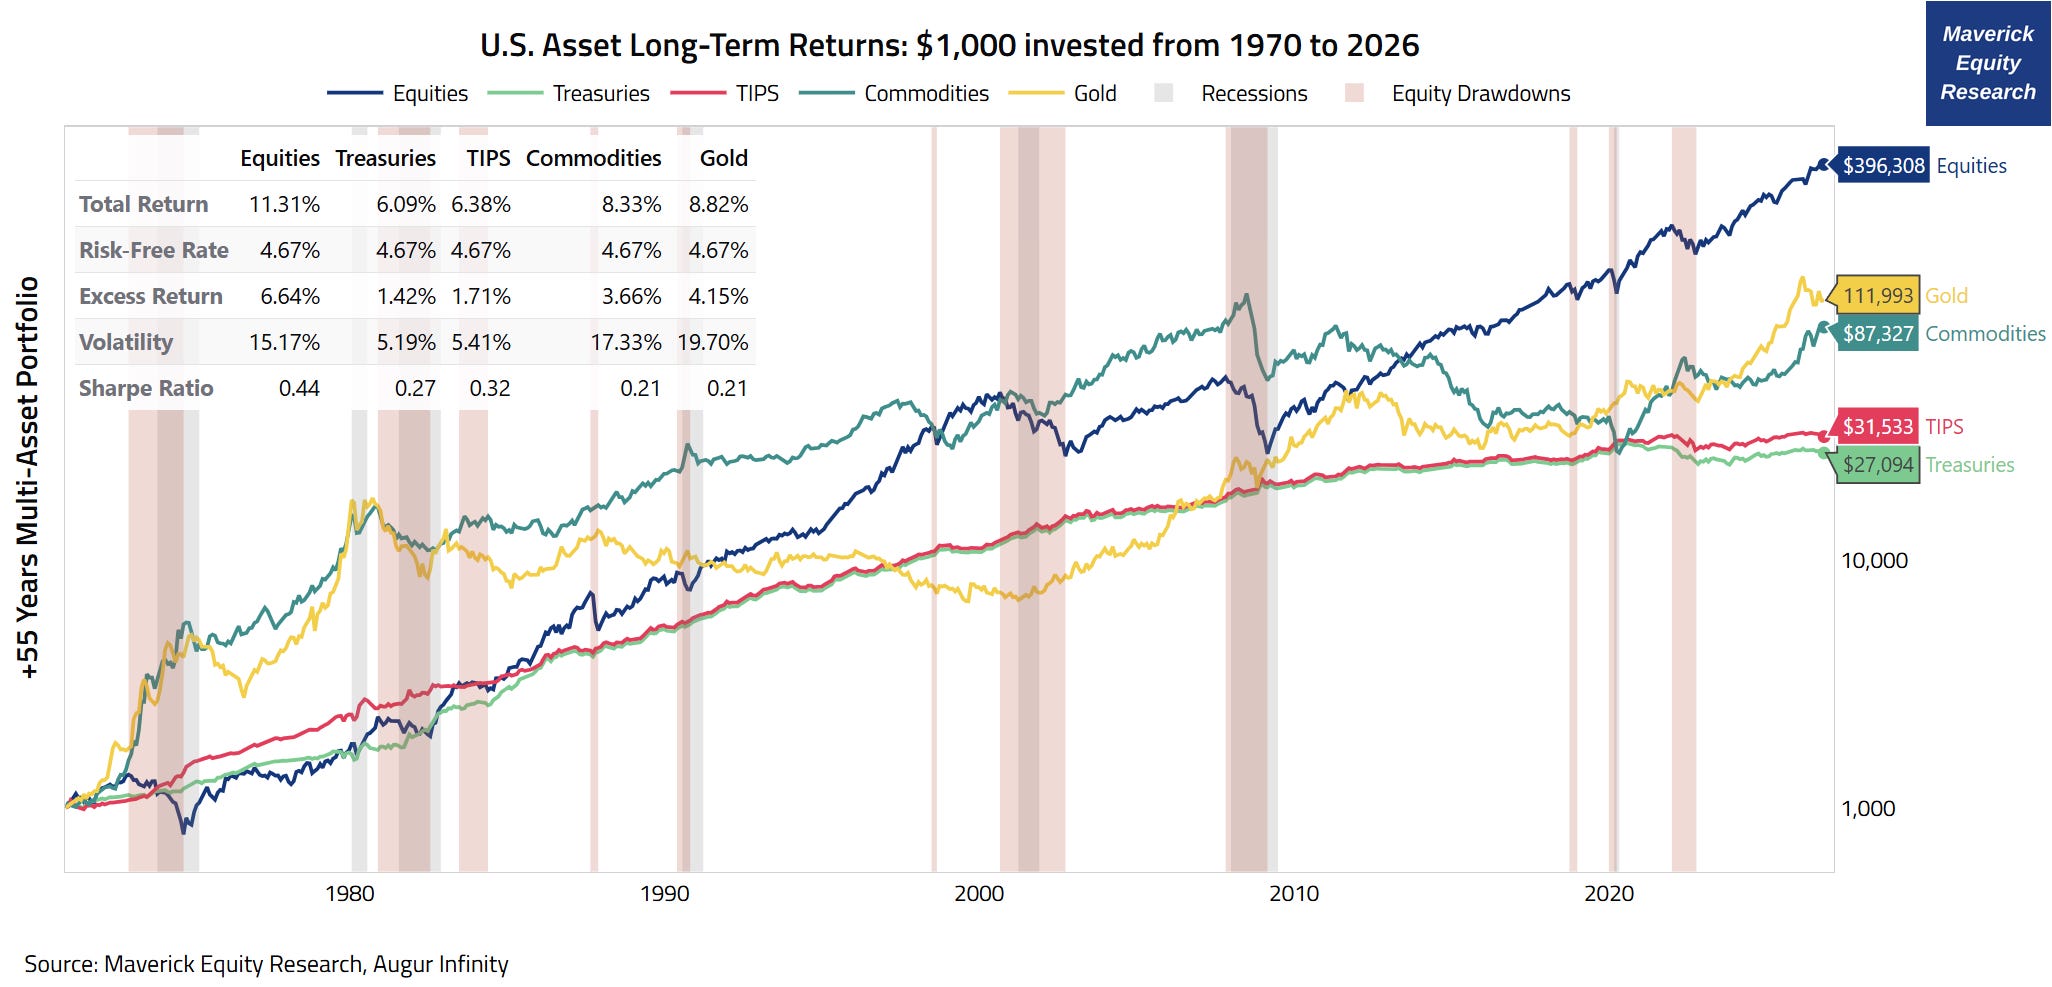
The visual covering both Recessions (grey) and Equity Drawdowns (red) since 1970:
👉 Total count: 11 drawdowns with 7 recessions
👉 bear markets do not necessarily come with an economic recession as a package, and the other way around, yet the overlap is substantial in both directions — to be noted that bear markets are more frequent than recessions
📊 U.S. Asset Long-Term Returns: $1,000 invested from 1995 to 2026 📊
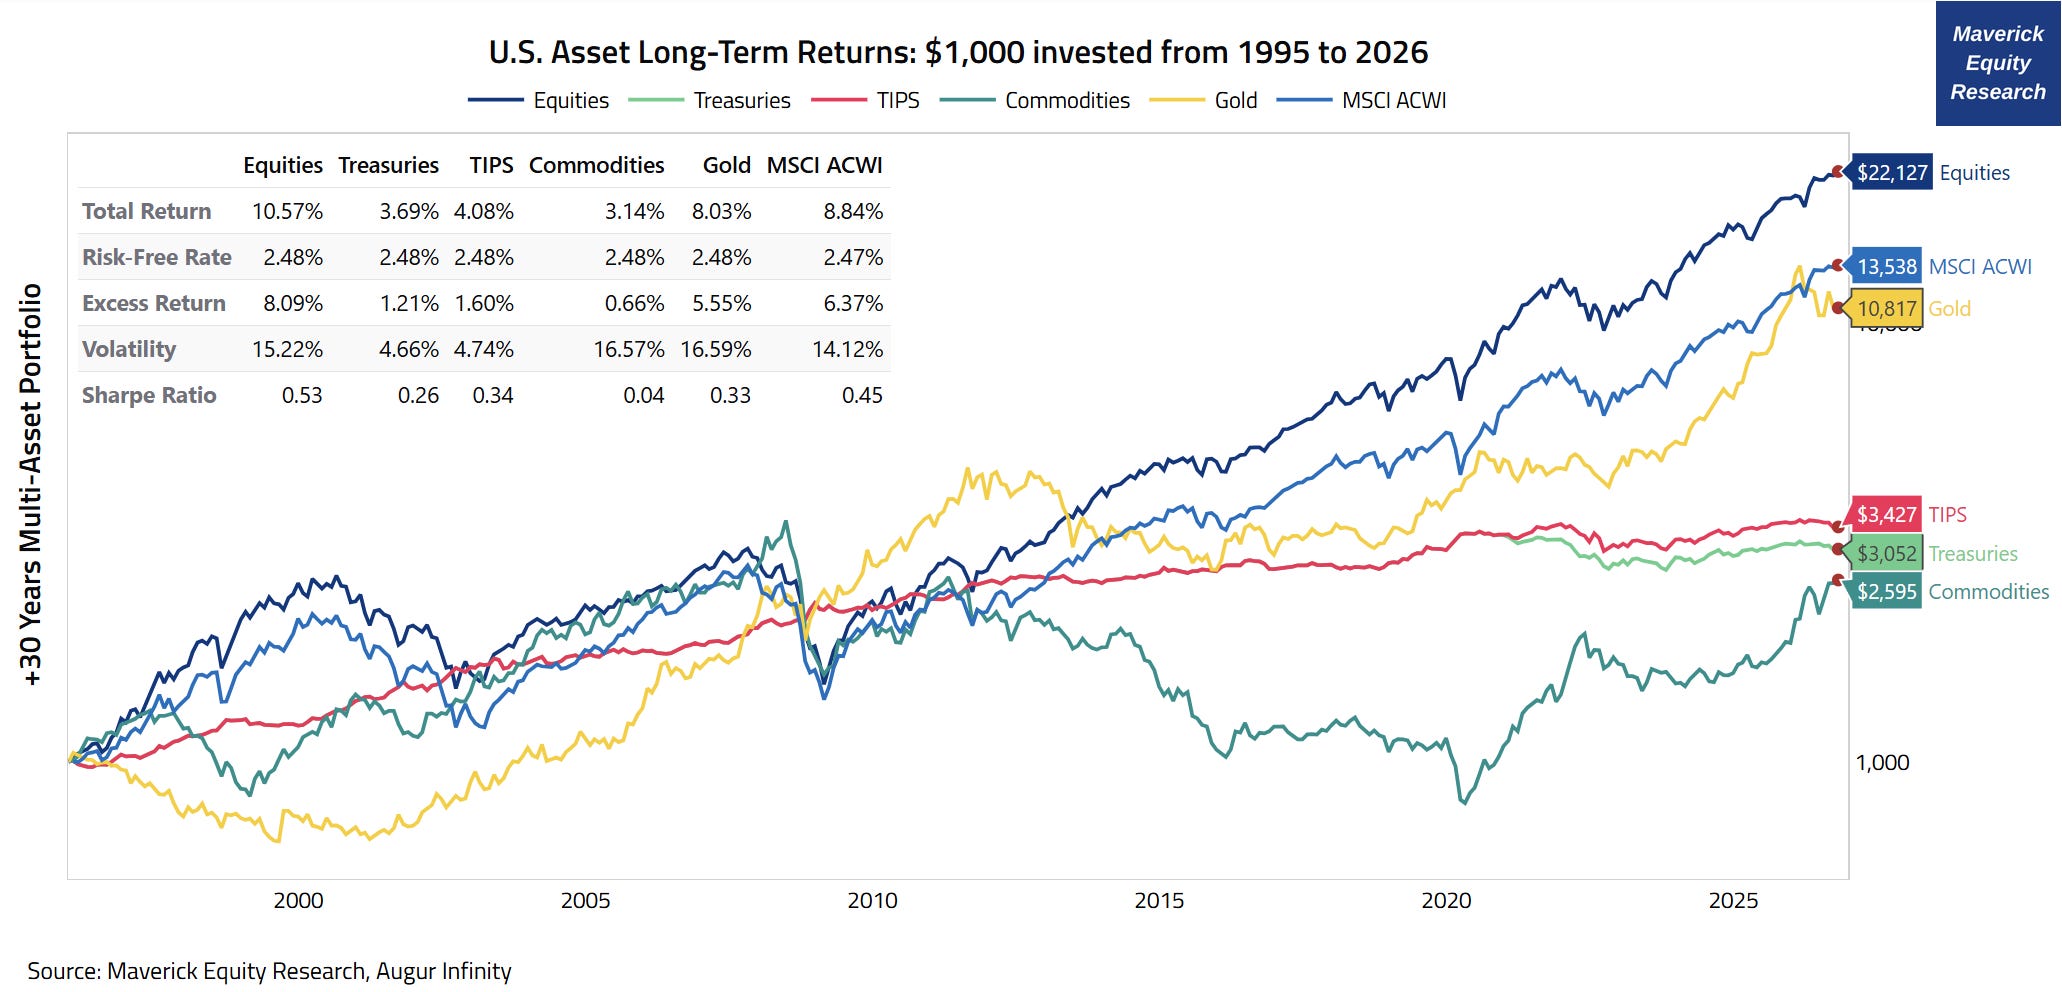
$1,000 invested in Stocks, Treasuries, TIPS, Commodities, Gold + Global Equities (MSCI ACWI) 1995 to 2026 + key statistics — note, further added Global Equities:
👉 Equities (S&P 500):
+10.57% average annualized return with a 15.22% annualised volatility = similar returns mixed with similar volatility compared to since 1970
0.53 Sharp Ratio with a 8.09% excess return = quite good
$1,000 turned into 22,127 = very good as well!
👉 Commodities:
+3.14% return with a 16.57% volatility = low returns mixed with high volatility
0.04 Sharp Ratio with a 0.66% excess return = low, you did likely expect more
$1,000 turned into $2,595 = not much
👉 Treasury Inflation-Protected Securities (TIPS):
+4.08% return with a 4.74% volatility = a bit higher than treasuries
0.34 Sharp Ratio which is higher than Treasuries, and with a 1.6% excess return
$1,000 turned into $3,427 = risk free (nominal & real) but also quite low returns
👉 Treasuries:
+3.69% return with a lower 4.66% volatility = quite low returns for this period
0.26 Sharp Ratio with a 1.21% excess return
$1,000 turned into $3,052 = risk free (nominal), but also quite low returns
👉 Gold:
+8..03% return with a 16.59% volatility = sweet returns mixed with high volatility
0.33 Sharp Ratio with a 5.55% excess return
$1,000 turned into $10,817 = very decent!
👉 Global Equities (MSCI ACWI) = DM + EM including US with a big 63.5% weight:
+8.84% average annualized return with a 14.12% annualised volatility = a bit lower returns than US Equities, but also lower volatility
0.45 Sharp Ratio with a 6.37% excess return
$1,000 turned into $13,538 = very good as well!
You might wonder, what was my economic rationale for choosing since 1995?
👉 recent 3 decades are even more representative for today’s economy & as well going forward — e.g. tech is even way deeper part of the economy, it’s everywhere
👉 there are people that invest with a +50 years investment horizon (for kids etc), but more realistically, 30 years matches most people’s investment horizon
well, jokingly or not, when I talk with some people and when I look online, it seems people’s horizon is rather the next 3 months or 1 week, or 1 day? 😉
and their ‘strategy’ is anything but to just be better than their neighbor, colleague or strangers online — is that funny because it is true? 😉
= top 2 biggest mistakes investors do and also why they will not do well — a topic which I will address and also offer solutions with a future dedicated post
👉 1995 the World Trade Organisation (WTO) was founded and replaced the General Agreement on Tariffs & Trade (GATT) which governed international trade since 1948
📊 U.S. Recessions, Stocks Bear Markets and Drawdowns since 1995 📊
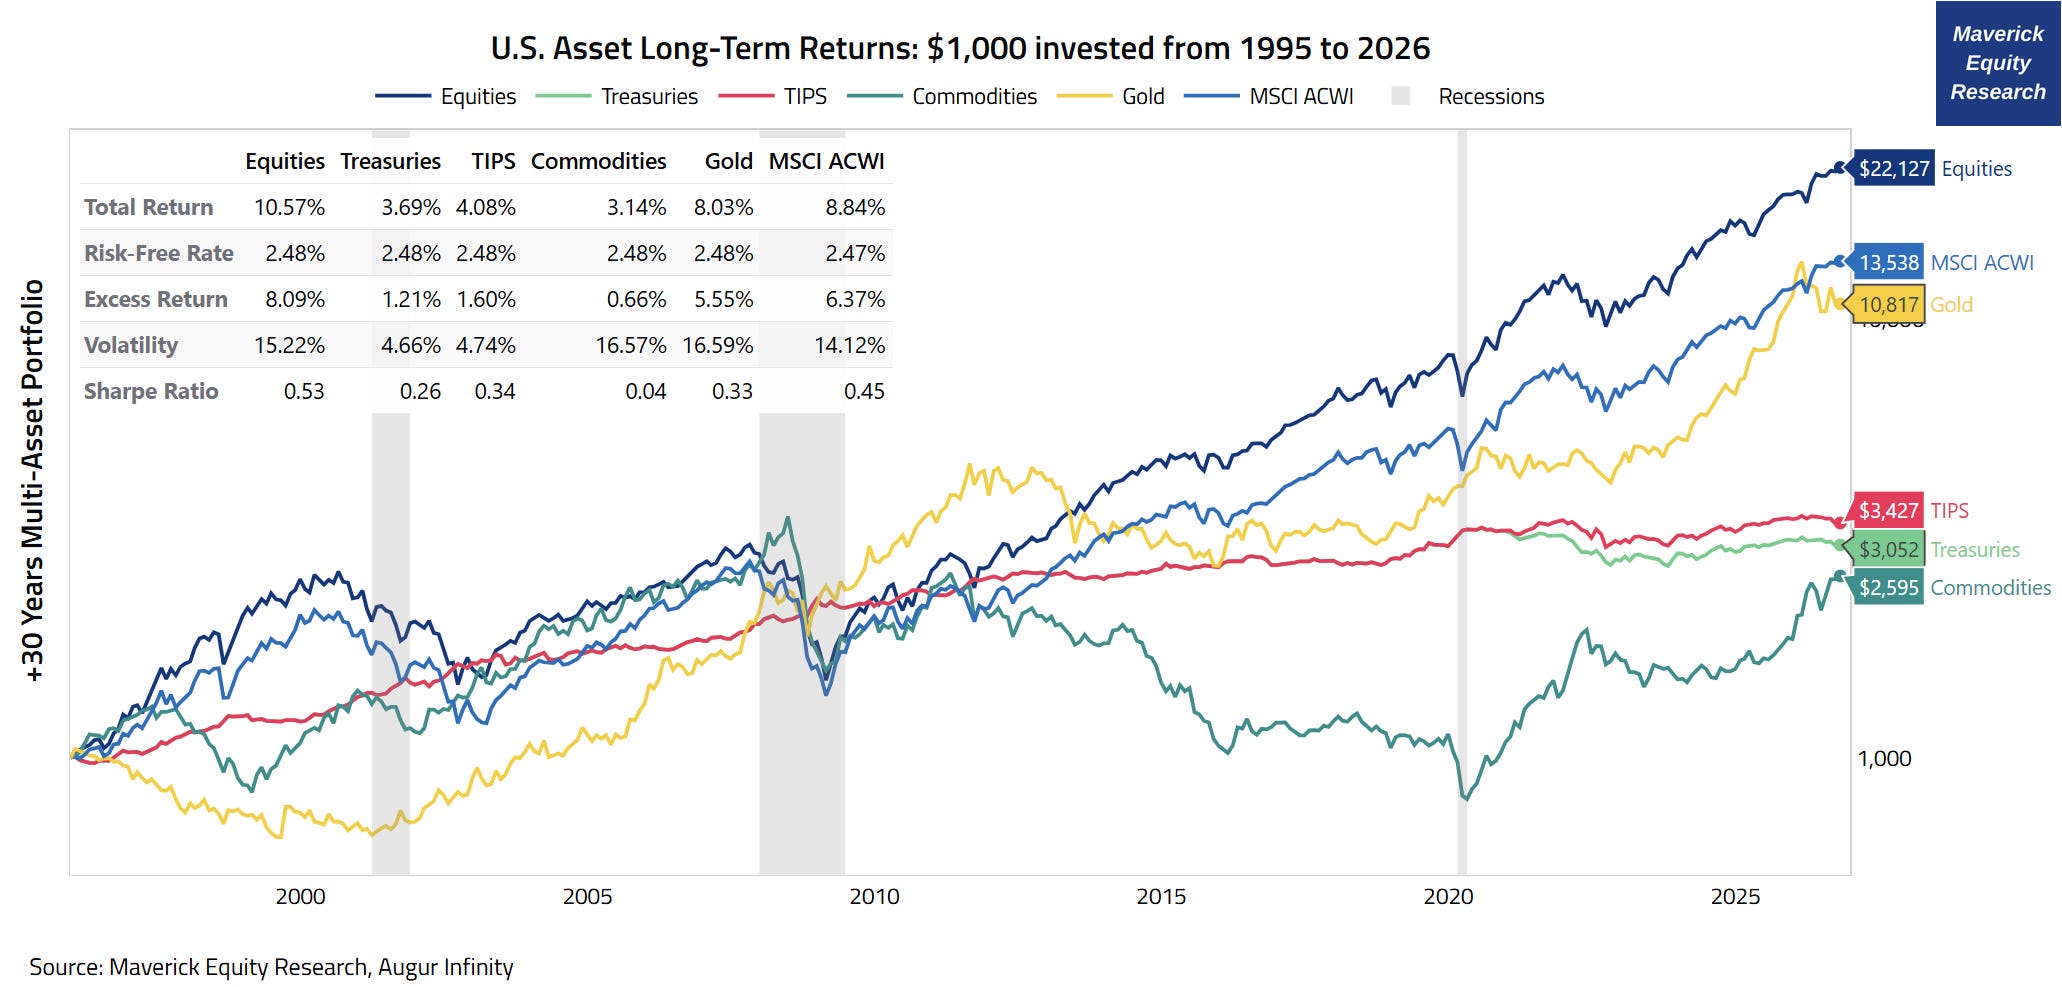
How many recessions since 1995?
👉 3 occurrences, a huge one, a medium one, and a quickie:
2001 Recession/Dot-com bubble: Mar 2001 → Nov 2001, 8 months duration
2008 Great Recession/GFC/Lehman: Dec 2007 → Jun 2009, 18 months duration
2020 COVID-19 Recession: Feb 2020 → Apr 2020, 2 months duration
What was the duration on average?
👉 9.3 months (28 total months divided by 3), hence less than a year = very good!
Below the chart where I added extra the Recessions = shaded grey areas:
“Recessions are nice to see, but Mav, can you show us stock market drawdowns”?
Yes, I can! Check the same chart where I added drawdowns as red shaded areas.
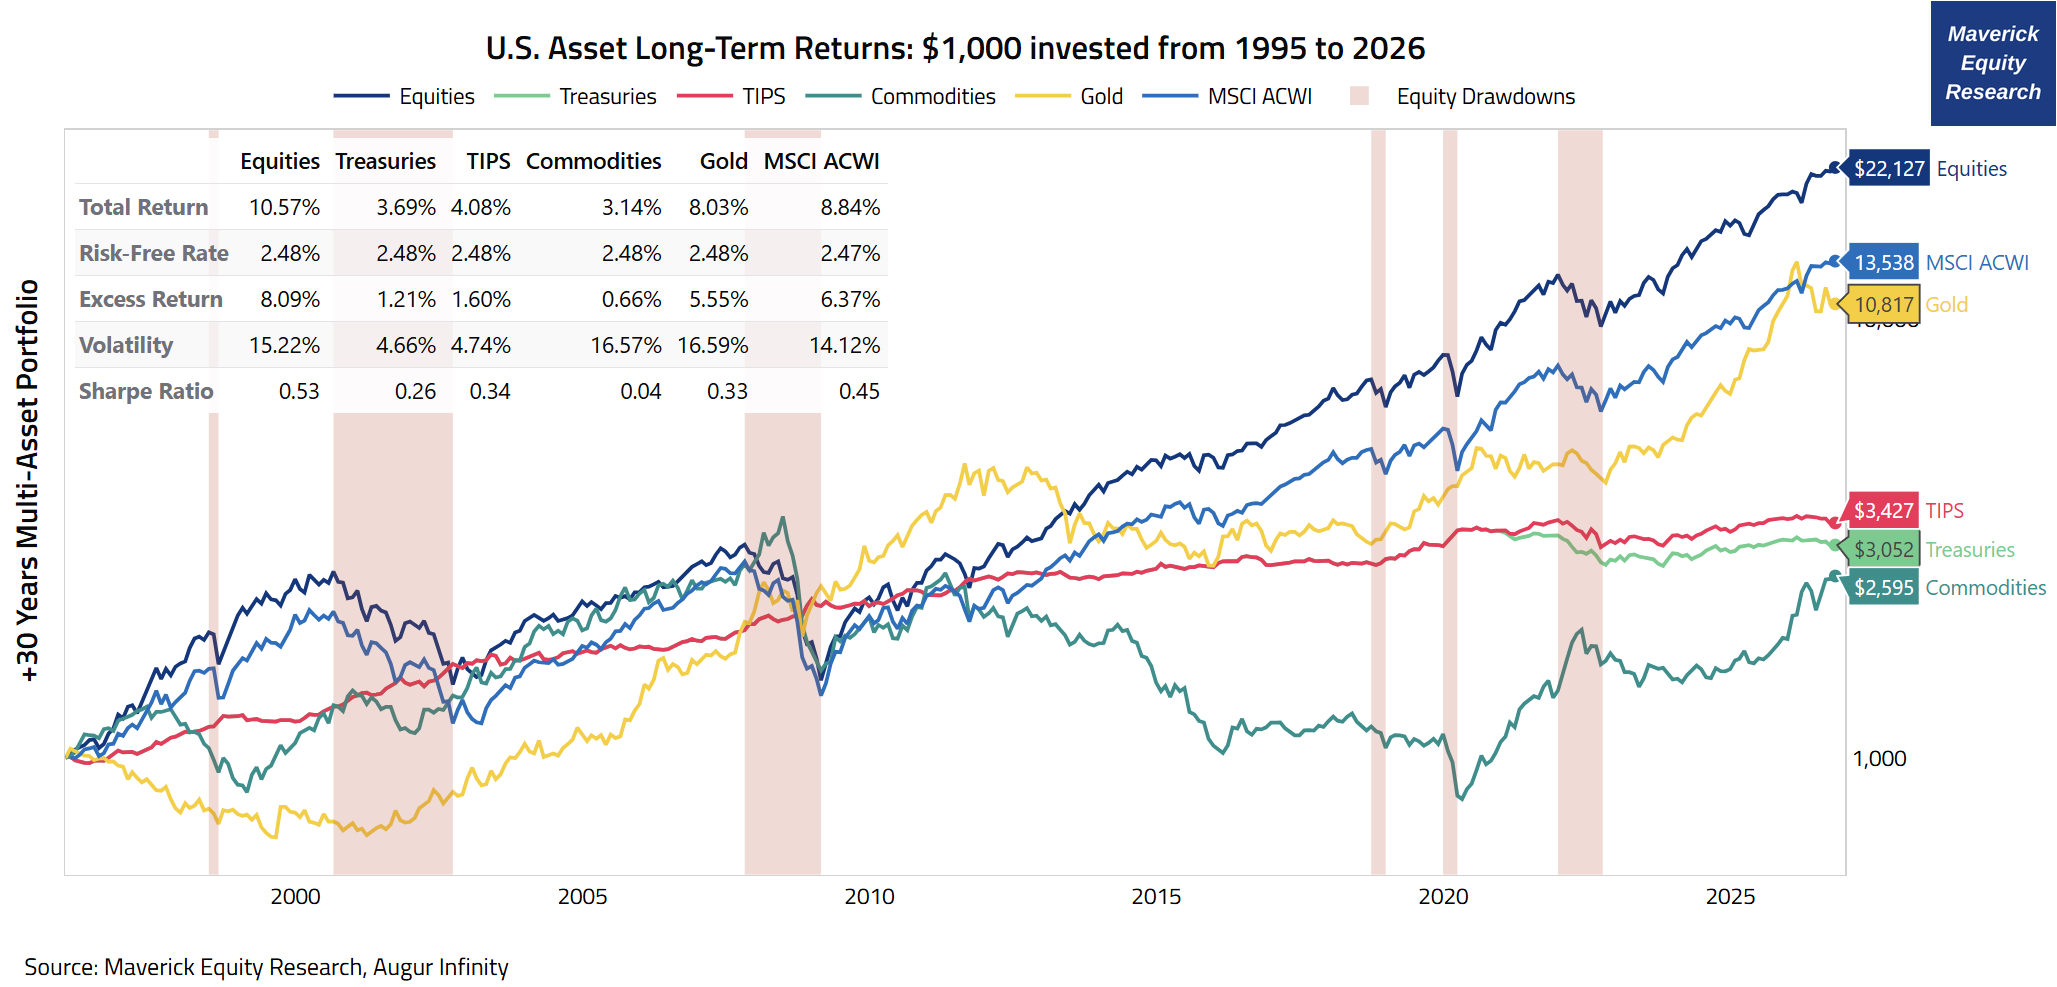
How many stock market drawdowns since 1995?
👉 6 times (double than recessions), some bigger & longer, some smaller & shorter:
1998 Russia/LTCM crisis
−19.3% drop with 45 days time to trough
4.2 months to recover
2000 Dot-com bust
−49.1% drop, 929 days time to trough = 2½ years as the longest one
7.2 years to recover
2008 Great Recession/GFC/Lehman
−56.8% drop with 517 days time to trough
5.5 years to recover
hence, the deepest and a very long one — I was present, also down more than 50%, hence the best investing lesson and experience I could ever get
food for thought: could you handle a 56.7% drop? more on that in a dedicated post
2018 rate-hike, QT, trade-war selloff
−20% drop with 95 days time to trough
7 months to recover
2020 COVID-19 crash
−33.9% drop with just 33 days time to trough = fastest bear market in history
6 months to recover
2022 Inflation & Fed ultra fast interest rates tightening
−25.4% with 282 days time to trough
2 years to recover with new highs by early 2024
👉 Maverick key forward looking note = with a 20-30 years investment horizon:
you should expect to digest about 6-10 bear markets
out of which 2-4 big ones — let that one sink in … more on that in a future post
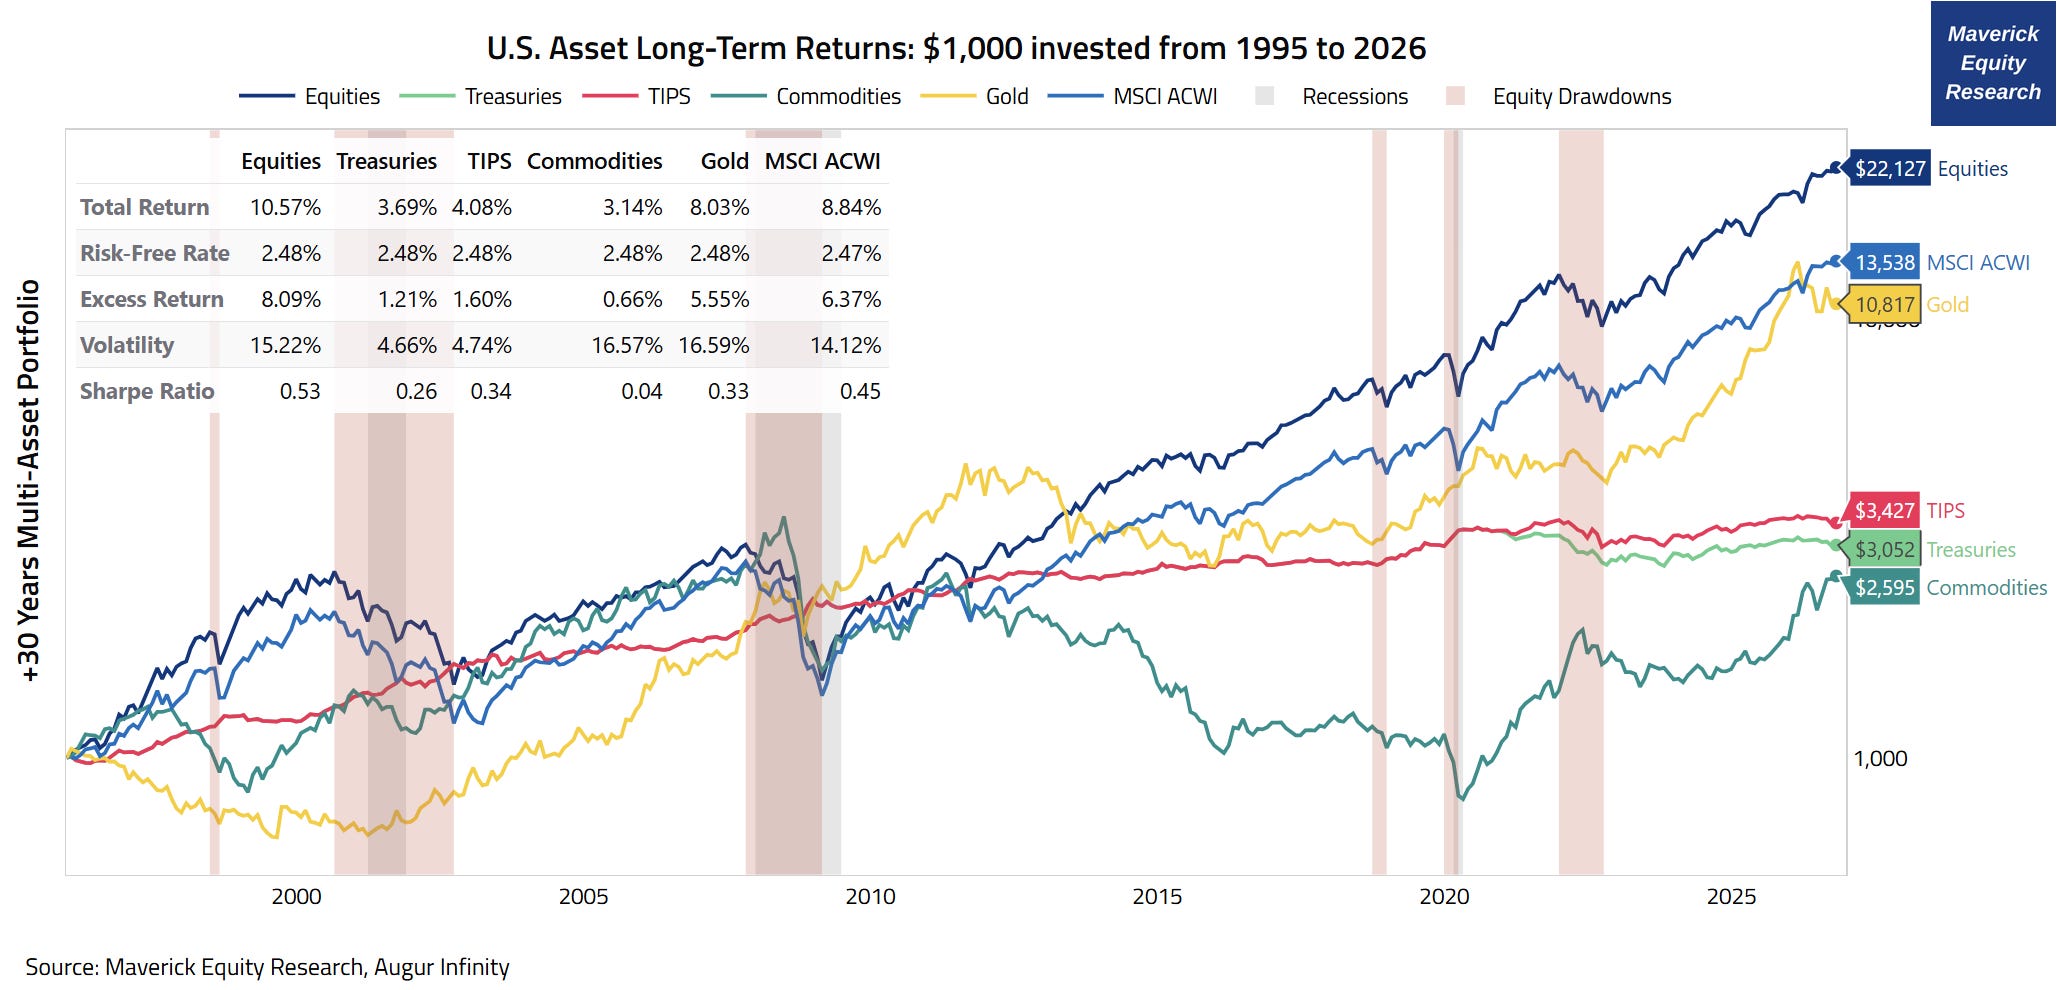
The visual covering both Recessions (grey) and Equity Drawdowns (red) since 1995:
👉 Total count: 6 drawdowns with 3 recessions = 2x more drawdowns
👉 one pattern across this period:
only 2000-2002 and 2007-2009 drawdowns coincided with NBER recessions, but it took them by far the longest to recover — 7.2 and 5.5 years to recover, not months
1998, 2018, and 2022 happened without a recession
2020 was the very odd case — a recession so brief it barely registered before the market had already bottomed
📊 Model Portfolios preview: All-Weather, Core-Satellites and All-Equities 📊
‘‘So, what’s next after all these cool visuals, key stats & insights, Mav?‘‘
We covered:
👉 U.S. Stocks (S&P 500 large caps)
👉 Treasuries
👉 Treasury Inflation-Protected Securities (TIPS)
👉 Commodities
👉 Gold &
👉 Global Stocks (MSCI ACWI large & mid caps)
across +100, +55 and +30 years: both how they perform and how they behave across the many recessions and bear markets.
Yet, there is more out there that I look into and focus:
👉 U.S. and International small and mid caps — Swiss ones especially
👉 U.S. and International Real Estate (REITs)
👉 U.S. and International corporate and municipal bonds — HY and IG
👉 Private Equity via public vehicles in order to access very high barriers to entry: real assets like infrastructure & digitalization real assets, renewable power & energy transition, real estate & credit — with a long-term, buy-and-operate investing strategy
And then, among others, we have various investment styles and strategies:
👉 factor investing: both classic and style premia / alternative risk premia
👉 trend-following, managed futures
👉 market neutral, long-short
👉 value, growth, quality, momentum
👉 tail-risk hedging: crisis alpha
All right, so what is "Maverick’s mission“ here?
The mission is taking all of the above and construct with them portfolios that:
weather all the economic & financial markets storms presented initially above +
generate returns and compound over time + in the same time
experience lower drawdowns, lower stress, hence good sleep
In essence, it is about constructing solid and optimized portfolios:
Higher returns and/or lower risks — very good risk-adjusted returns
Diversification, I mean Real Diversification because diversification is the only free lunch in investing we’ll ever get — more on that in future dedicated research
“Why are you bringing now these portfolios, Mav?“
Simple 2 big reasons, Execution and Delivery:
nowadays, it is possible for anybody to implement such portfolios:
without needing a high minimum investment amount — like 10, 20 or 30 years ago
without an expensive ‘prime broker’ for market access
without the related high transaction costs
without high management fees (% AUM model) and/or without high retainer fees
add on top of the above, also tax efficient
In essence, we have never had it better in terms of investing than we do now!
I will have the required time, focus, energy & resources (tech, tools & data costs) to invest in, hence dedicate to this big project — before, that was not the case as time, attention and resources carry opportunity costs, hence related trade-offs
Hence, soon coming to town, Maverick Model Portfolios (MMPs)! Specifically:
full solutions, ready to invest fully constructed portfolios
dedicated posts about each portfolio will follow: you will receive both historical stress tested results, and once launched, ongoing/live behaviour and performance
✍️ Maverick All-Weather Portfolio (MAWP) ✍️
✍️ Maverick Core-Satellites Portfolio (MCSP) ✍️
✍️ Maverick All-Equities Portfolio (MAEP) ✍️
4th one is possible also as a Thematic: ✍️ Maverick AI Hedge Portfolio (MAIHP) ✍️
Going forward, you will also get insightful posts that cover key portfolio management ‘hard’ topics, and also ‘soft’ ones covering investing psychology and mindset — why? one needs both the ‘HARD’ portfolio + the ‘SOFT’ mindset part in order to win!
You will receive 10 complimentary research posts which will:
answer many questions you haven't yet considered
alongside those you should really be asking
and all that regardless of your current or future portfolio!
Which articles are next in this series?
✍️ The One Mandatory Feature Every Portfolio Must Include (Not Just Should!)
✍️ The Route to $1 Million or $10 Millions: Starting, Contributing & Compounding!
✍️ 7 Green Signs You’ll Reach $1 or $10 Millions in 10-15 Years Instead Of 30-40
✍️ Investing Returns vs Salary Returns: You Will Earn More From Investing Than From Working
✍️ Why You Must Diversify & Also Go International (Not Just Should!)
✍️ How Do I Add Value to You? Qualitative: ‘Behavioural, Baby’!
✍️ How Do Maverick Model Portfolios (MMPs) Add Value? ‘Numbers, Baby!’
Wrapping this one up: did you enjoy this by finding it interesting, saving you time and getting valuable insights? What would be appreciated?
Just sharing this around with like-minded people, and hitting the 🔄 & ❤️ buttons!
That’ll definitely support bringing in more & more independent investment research!
Like this, the big positive externalities become the name of the game! Thank you!
Sharing = 3x win: you + your close ones + me!
Have a great day! And never forget, keep compounding: family, friends, community, capital, knowledge, research and mindset!
With respect,
Mav 👋 🤝
“Compound interest is both the ultimate and biggest natural hedge!”
Maverick Equity Research