
✍️ S&P 500 Valuation, AI Big Tech FCF Yield & Performance + Interest Rates = Maverick Equities Charts of the Week #47
7 Maverick Charts that say 10,000 words

Dear all,
7 cherry picked Maverick Charts of the week say 10,000 words or more = the ‘How’!
Table of contents = the ‘What’ with the aim for a high density of ideas because the best respect the reader’s time:
📊 Maverick Charts: S&P 500 Valuation, AI Big Tech FCF Yield & Performance, Interest Rates as ‘everything in valuation gets back to interest rates’
📊 Bonus: One to buy during a sell-off, preparing the shopping list
Objective: both data-driven insights + valuable food for thought = the ‘Why’!
📊 Maverick Charts: S&P 500 Valuation, AI Big Tech FCF Yield & Performance, Interest Rates as ‘everything in valuation gets back to interest rates’ 📊
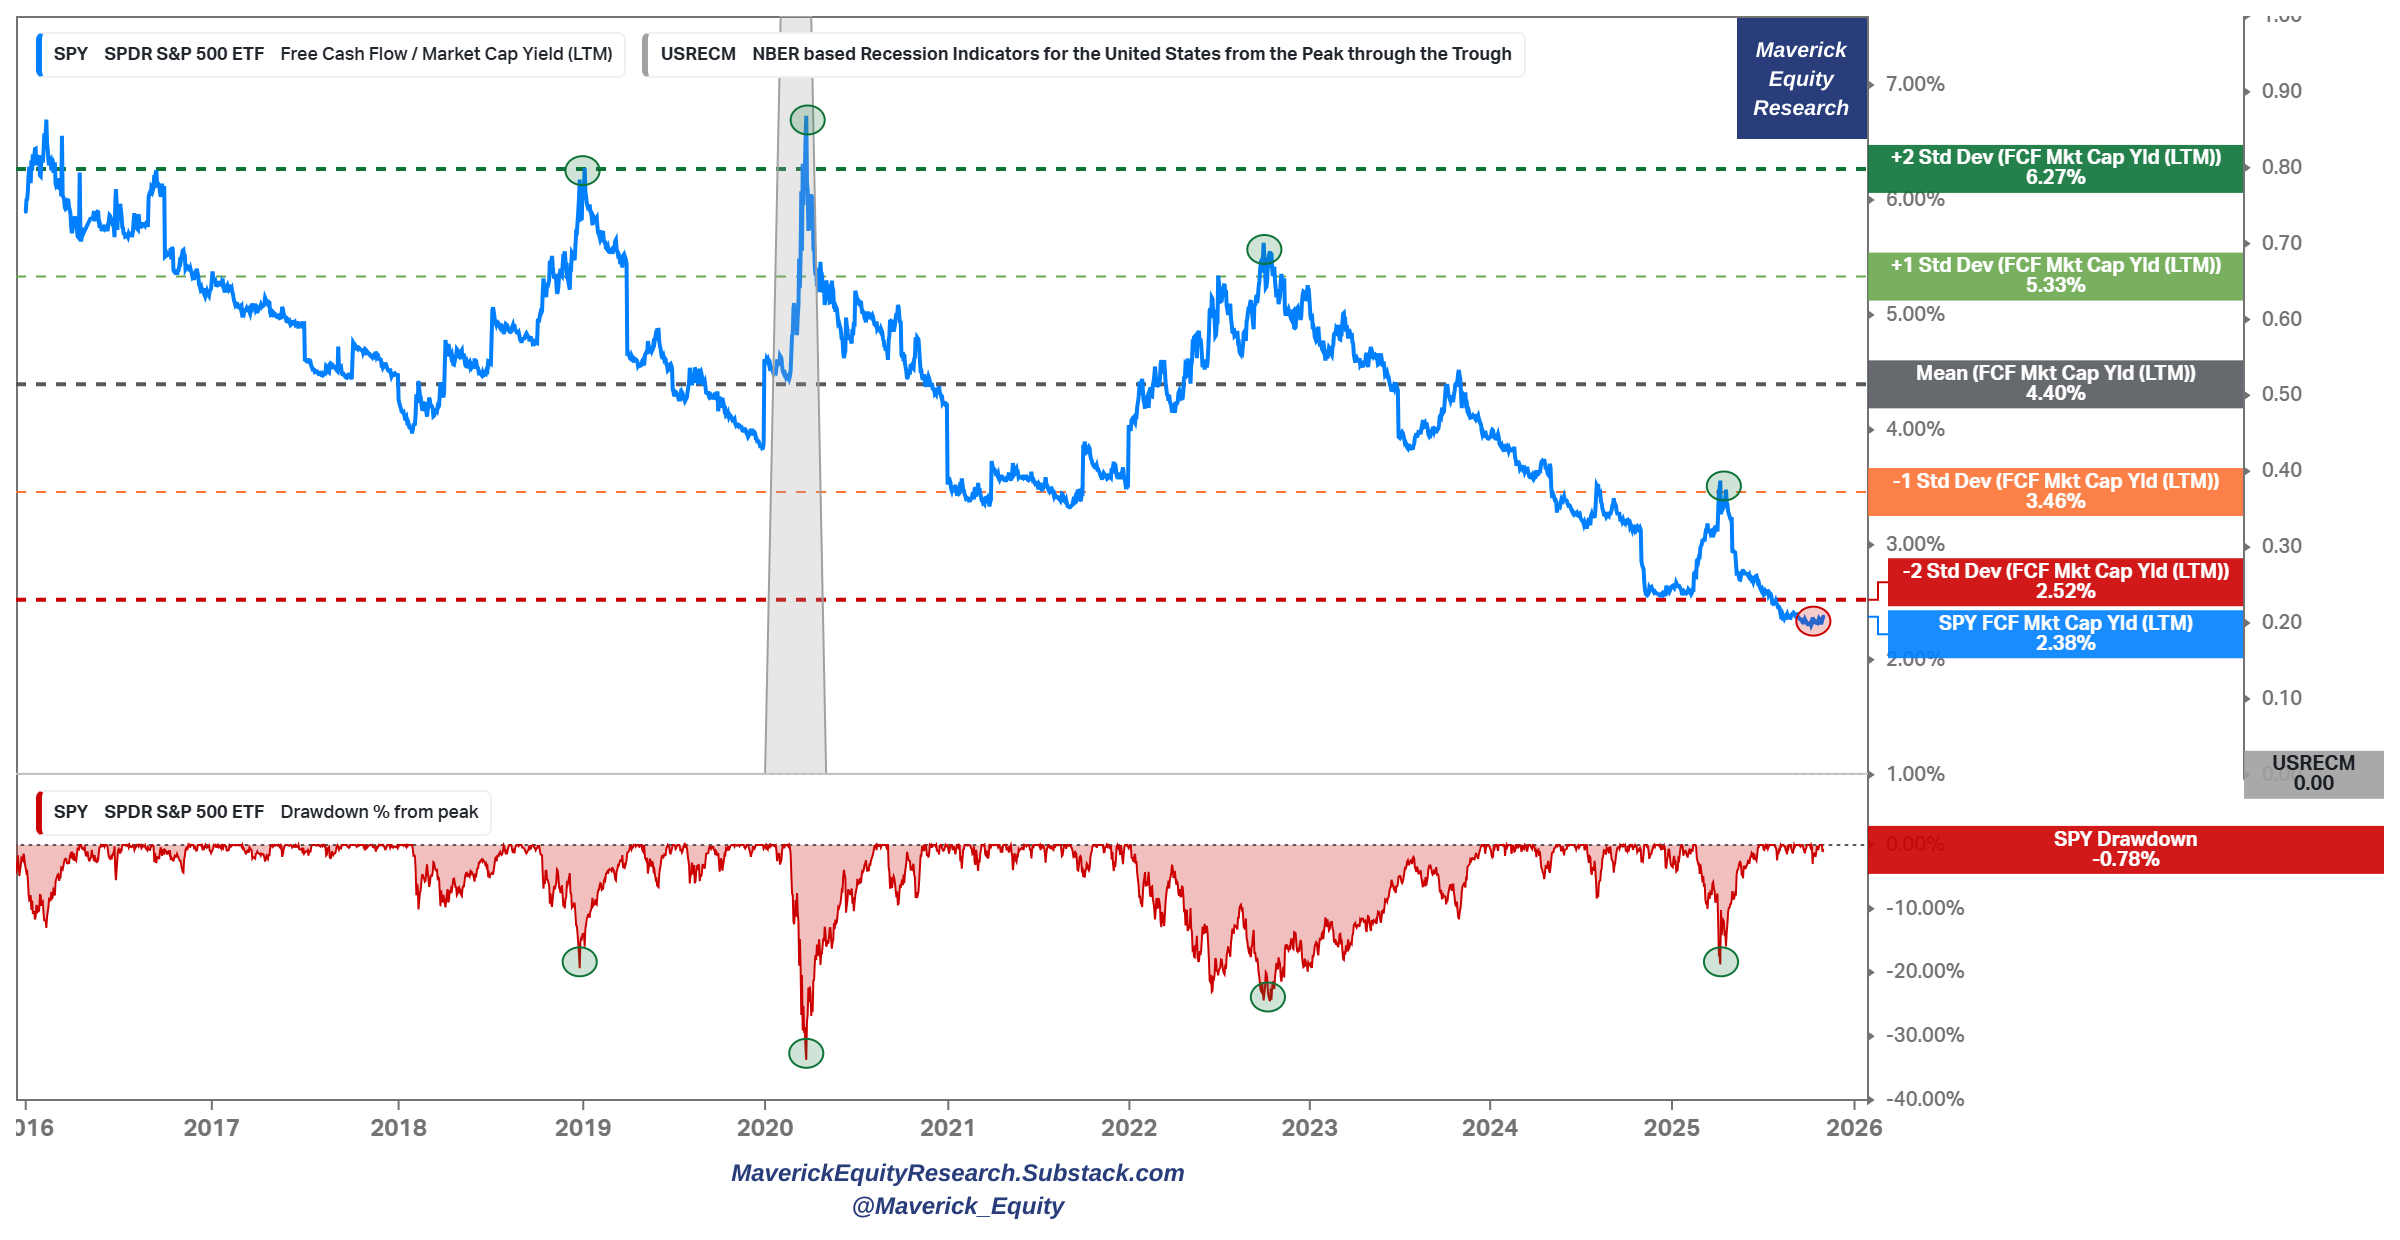
S&P 500 valuation via Free Cash Flow (FCF) Yield (most requested for update):
👉 S&P 500 (blue) trades at 2.38% which is even below -2 Standard Deviations (SD) which is not surprising given the 3-year mega bull market we have since 2022
👉 back in the 2022 bear market, FCF Yield was at +5%, hence more than 2x higher!
👉 just like usual, bear markets is the time to buy in order to make that fresh invested capital compound way faster: easy to say, hard to do? yes, but that is what is required!
Maverick net takeaways:
👉 I am not a buyer these days even though plenty of great companies in the S&P 500, plenty other opportunities, and as always: “Price is what you pay, value is what you get!”
👉 an inverted metric a’ la Maverick in Top Gun 😉, meaning this shall be seen as a “Buy High, Sell Low” ... & ... “Sell Low, Buy High”
👉 buying zone = rather within the 4-6% FCF yield range ... for example see when at +1 SD (2022 bear market), and even more so at +2 SD (Covid crash, 2018 bear market)

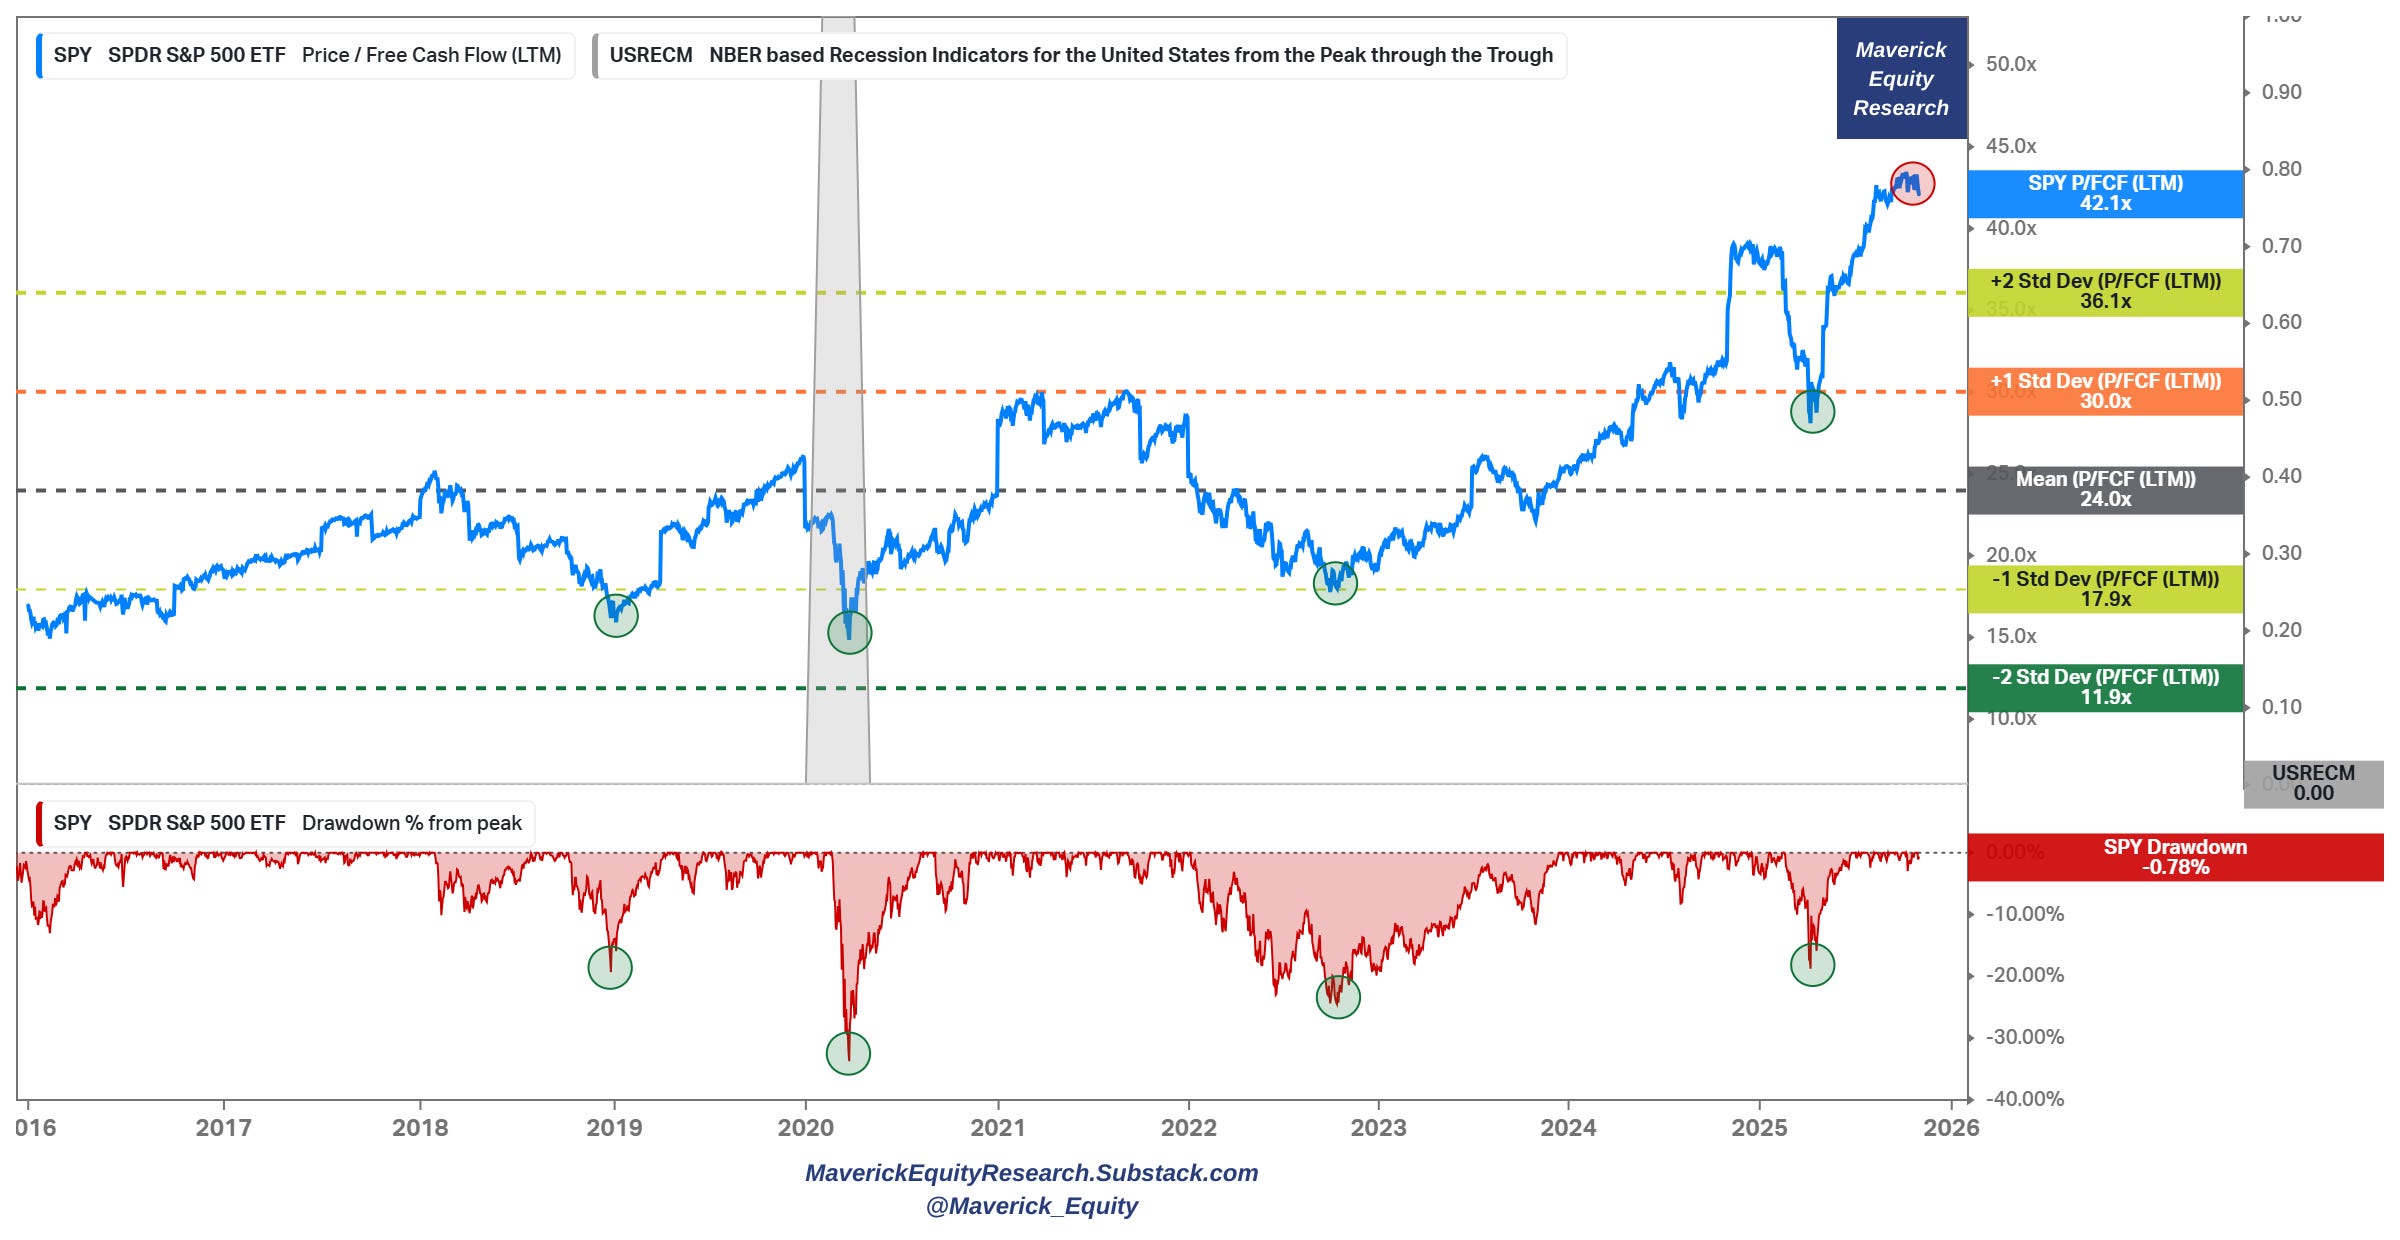
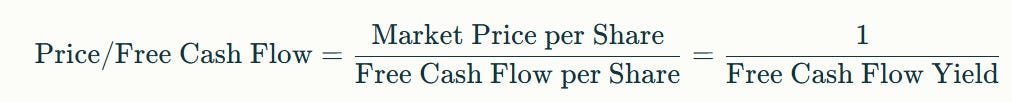
S&P 500 valuation via Price/Free Cash Flow (the inverse of the FCF/Yield):
👉 at 42.1x, way above even the +2 Standard Deviations (SD)
👉 at it is the highest since the 2000s Dot-com peak
For way more on the S&P 500, the 2 recurrent and improved S&P 500 reports will cover a lot of ground, and it will also answer ‘how overvalued or not the market is?’:
✍️ S&P 500 Report: Valuation, Fundamentals, Special Metrics & Leading Indicators
✍️ S&P 500 Report: Performance, Sentiment, Seasonality & Technical Analysis
N.B. inside you will find also proprietary/custom metrics & indicators! Stay tuned!
The big headline is about the Mega Tech with AI, wondering their FCF yield?
• Apple = 2.4%, and if we adjust for stock-based compensation (SBC) = 2.09%
• Netflix = 1.92% with 1.85% after SBC
• Meta = 2.66% and 1.73% after SBC
• Microsoft = 1.78% with 1.48% after SBC
• Nvidia = 1.43% and 1.32% after SBC
• Google = 2.01% with 1.31% after SBC
• Tesla = 0.45% and 0.29% after SBC
• Amazon = 0.55% with (0.3%), yes, negative after SBC

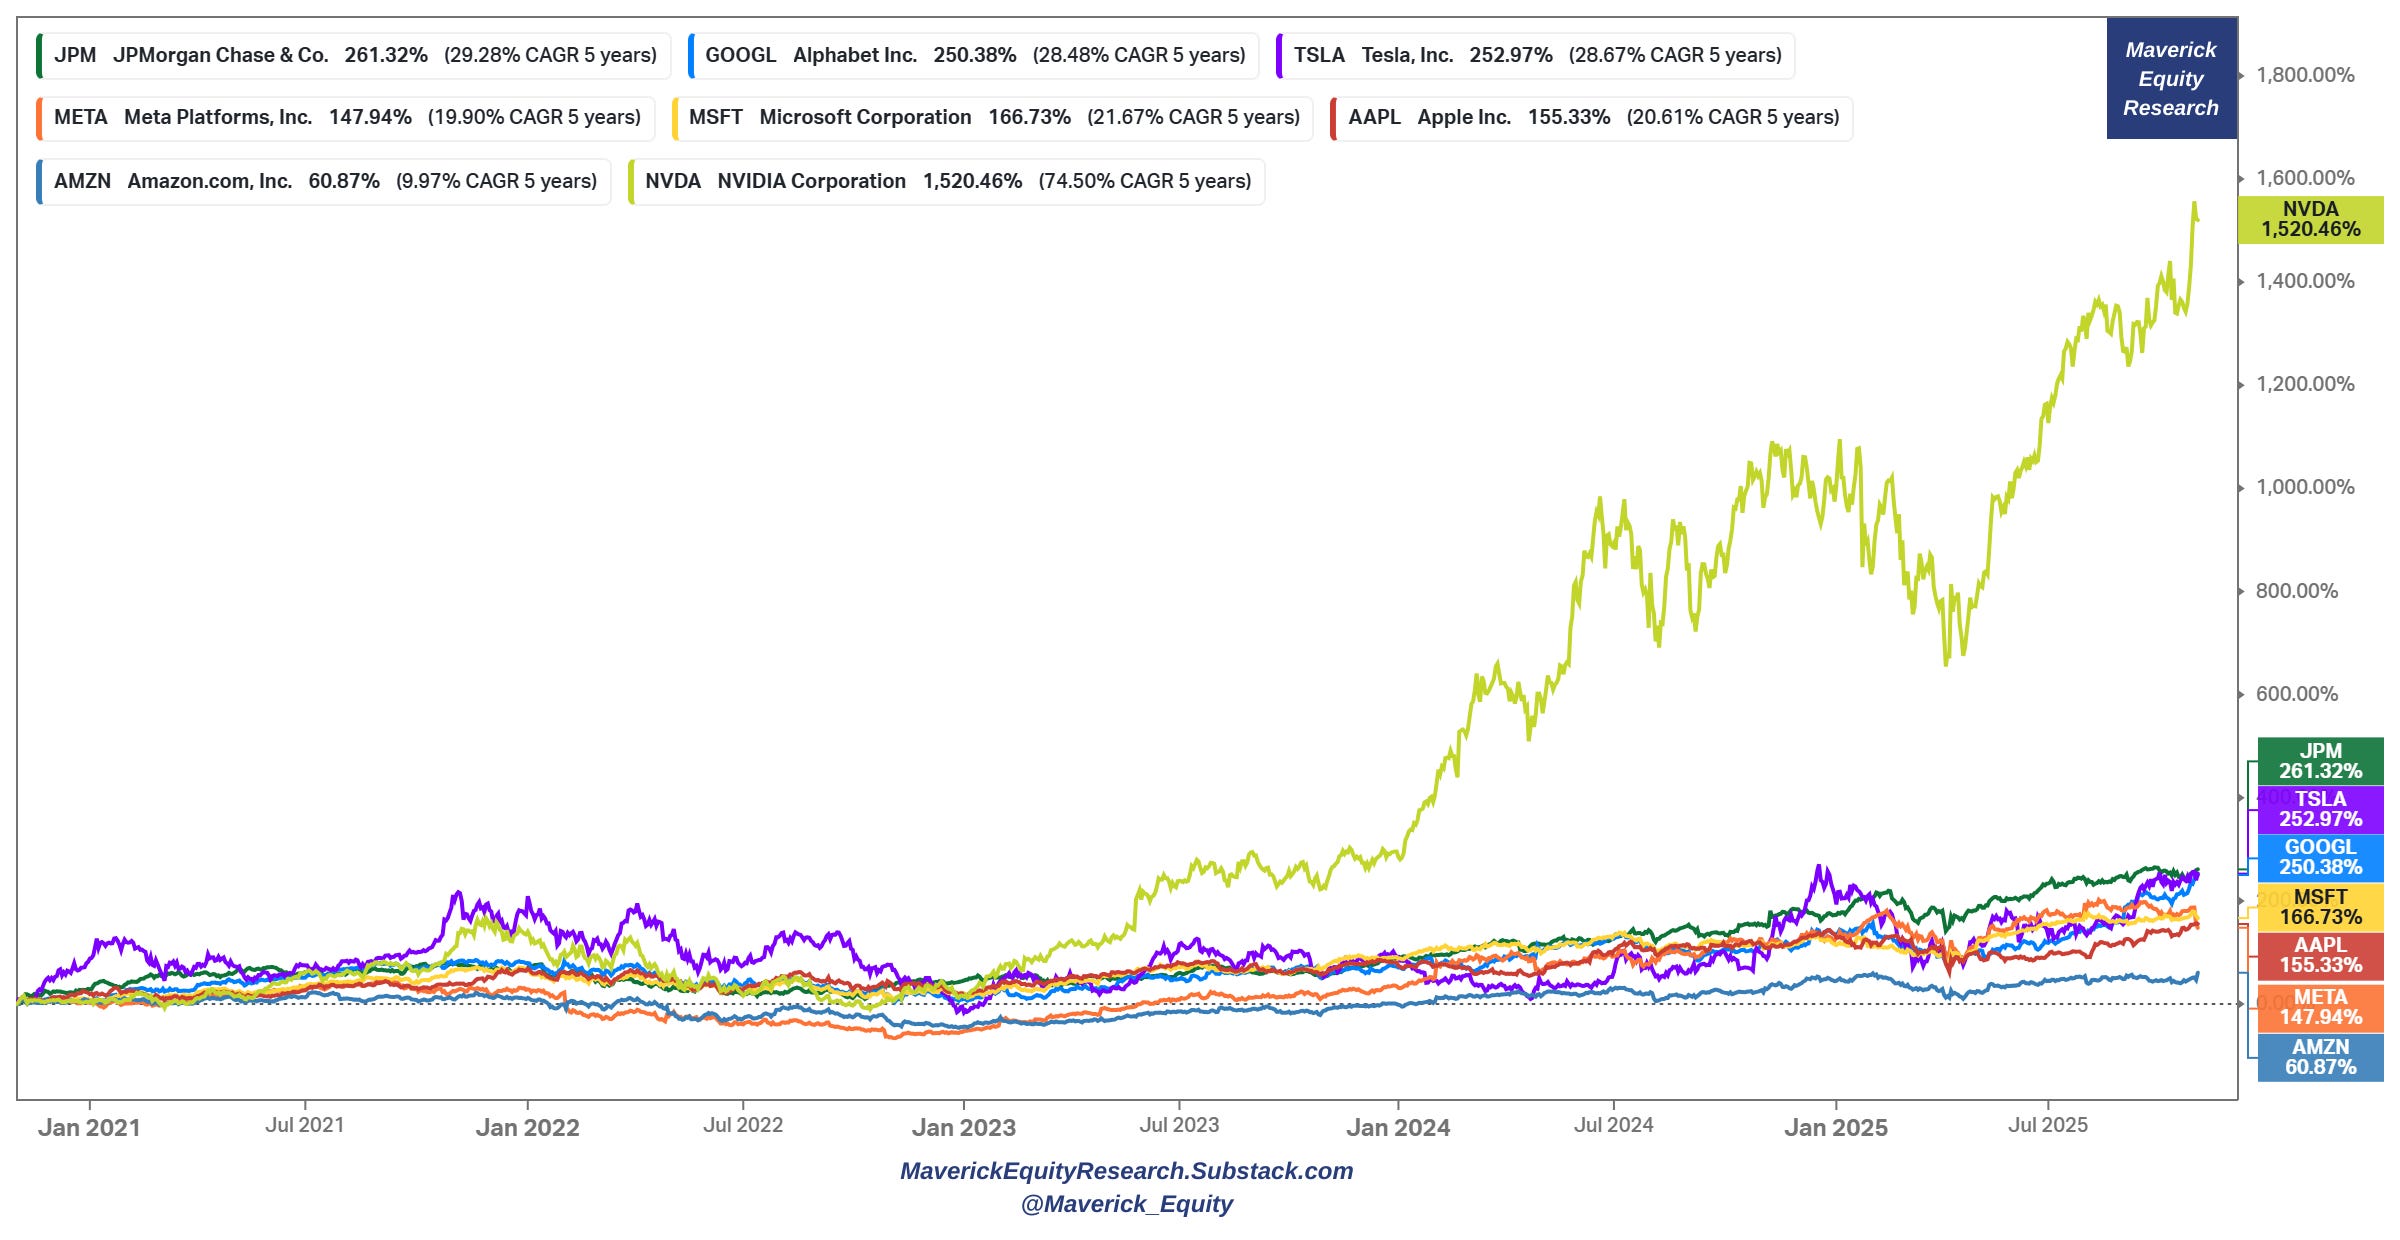
The Mag 7 U.S. Big Tech are naturally the talk in the town, though check this one:
👉 JPMorgan (JPM) has outperformed 6 of the Magnificent 7 over the last 5 years
👉 Nvidia (NVDA) the mega outlier which makes this chart ‘off the charts’ basically
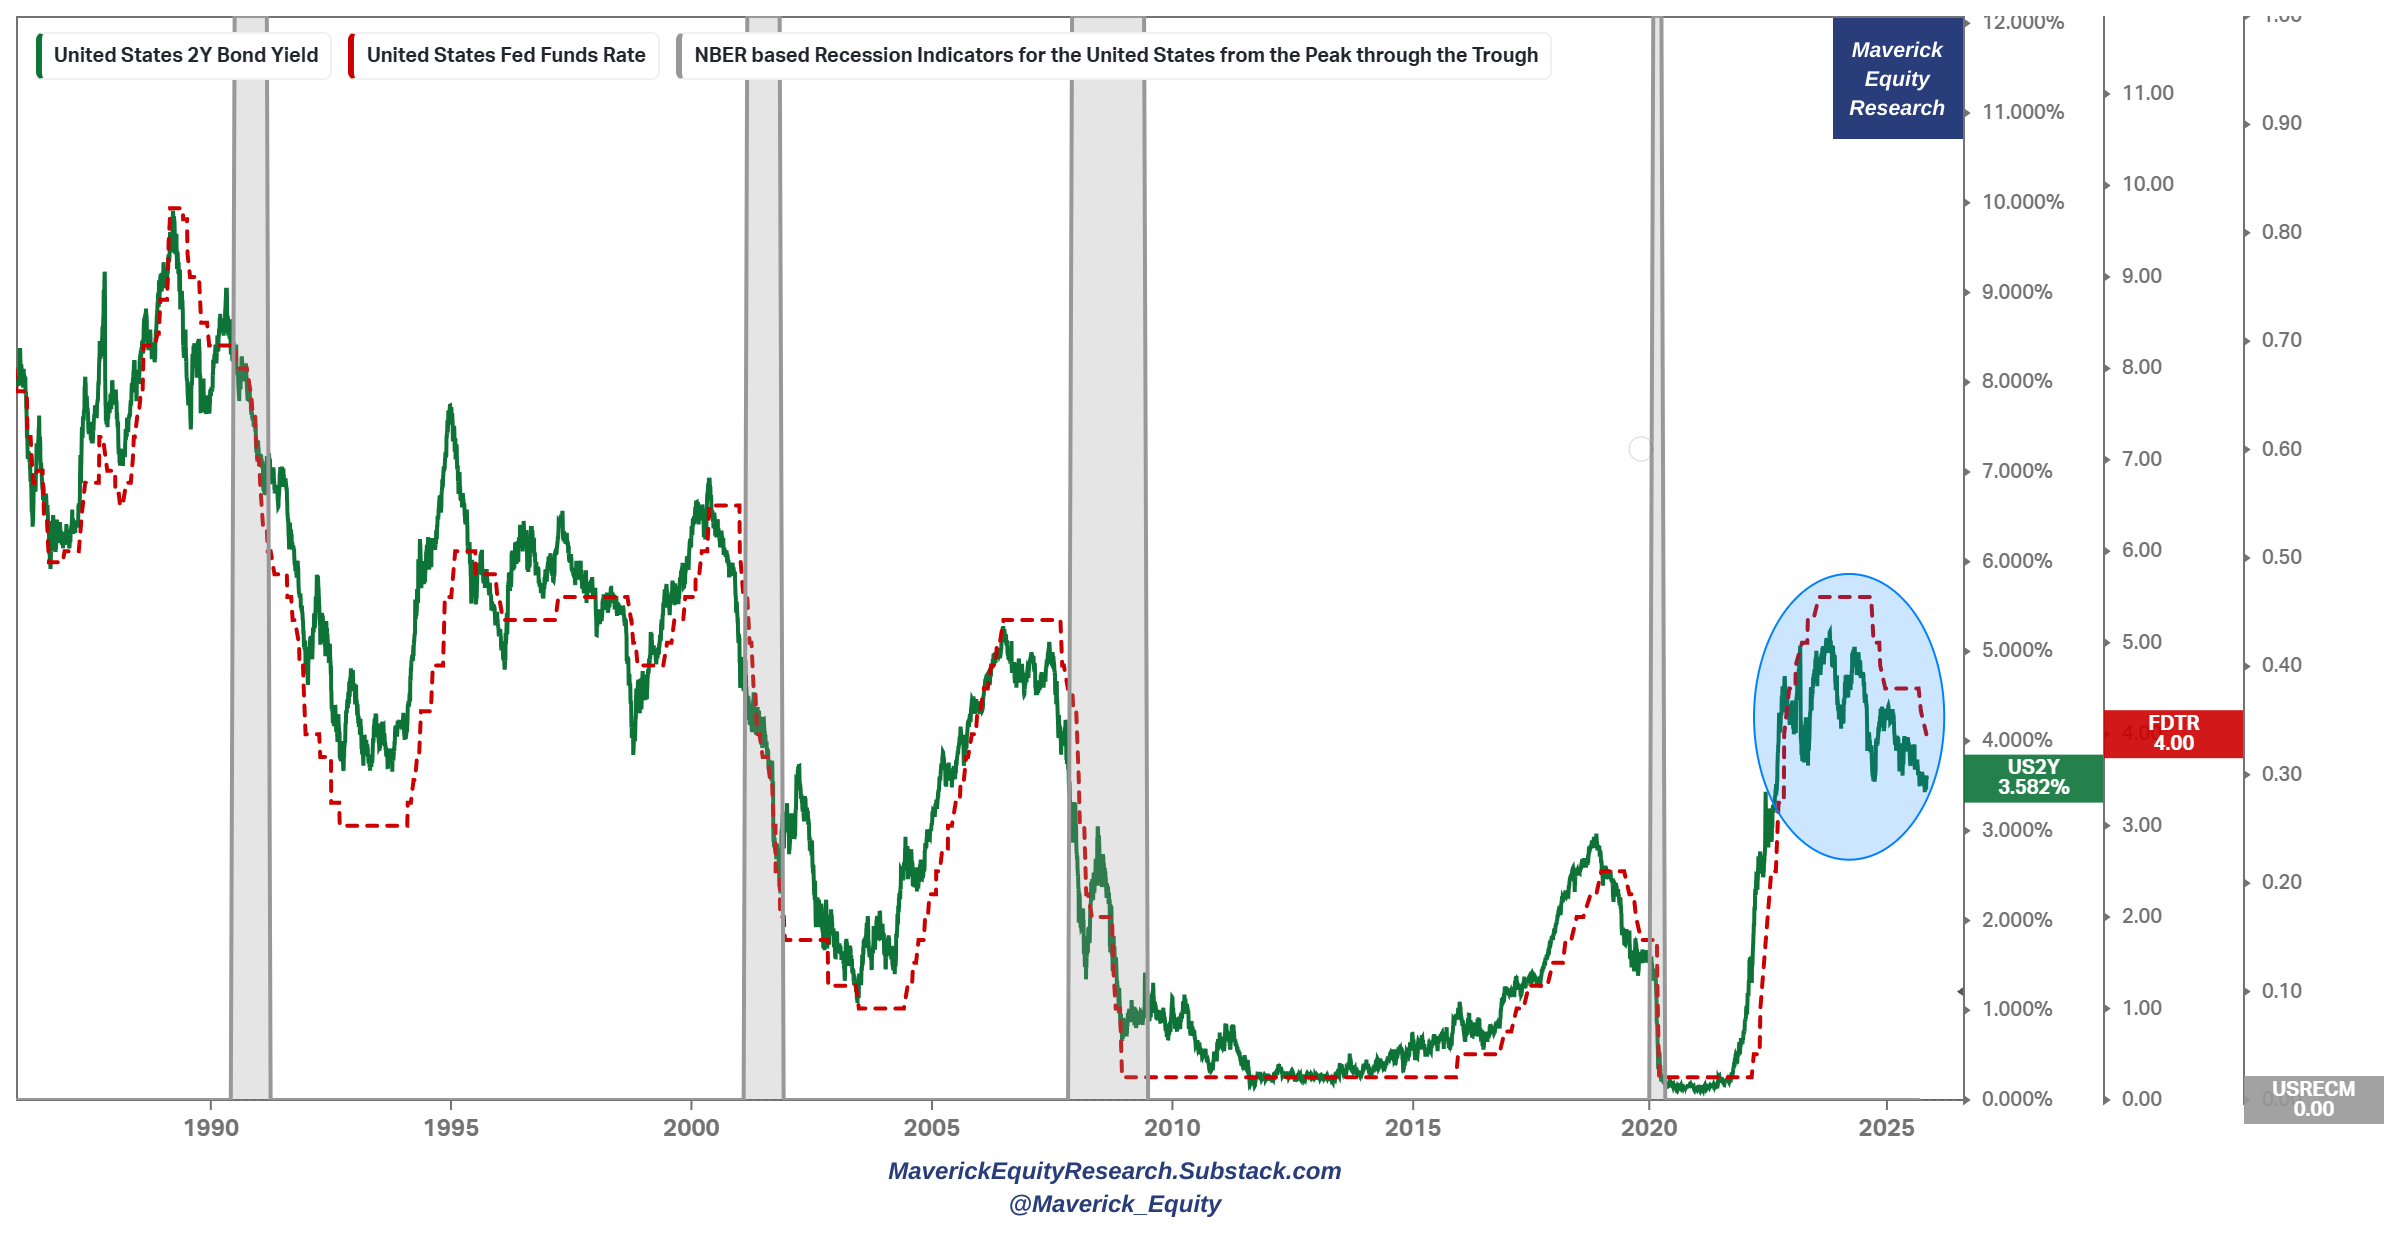
While AI is the big headliner with the current big market rally, not many told you that a material factor are the falling interest rates (discount rates/cost of capital):
👉 FED lowered rates for the second time this year (by a 10-2 FOMC vote), and is now sitting in the range of 3.75% to 4.00%
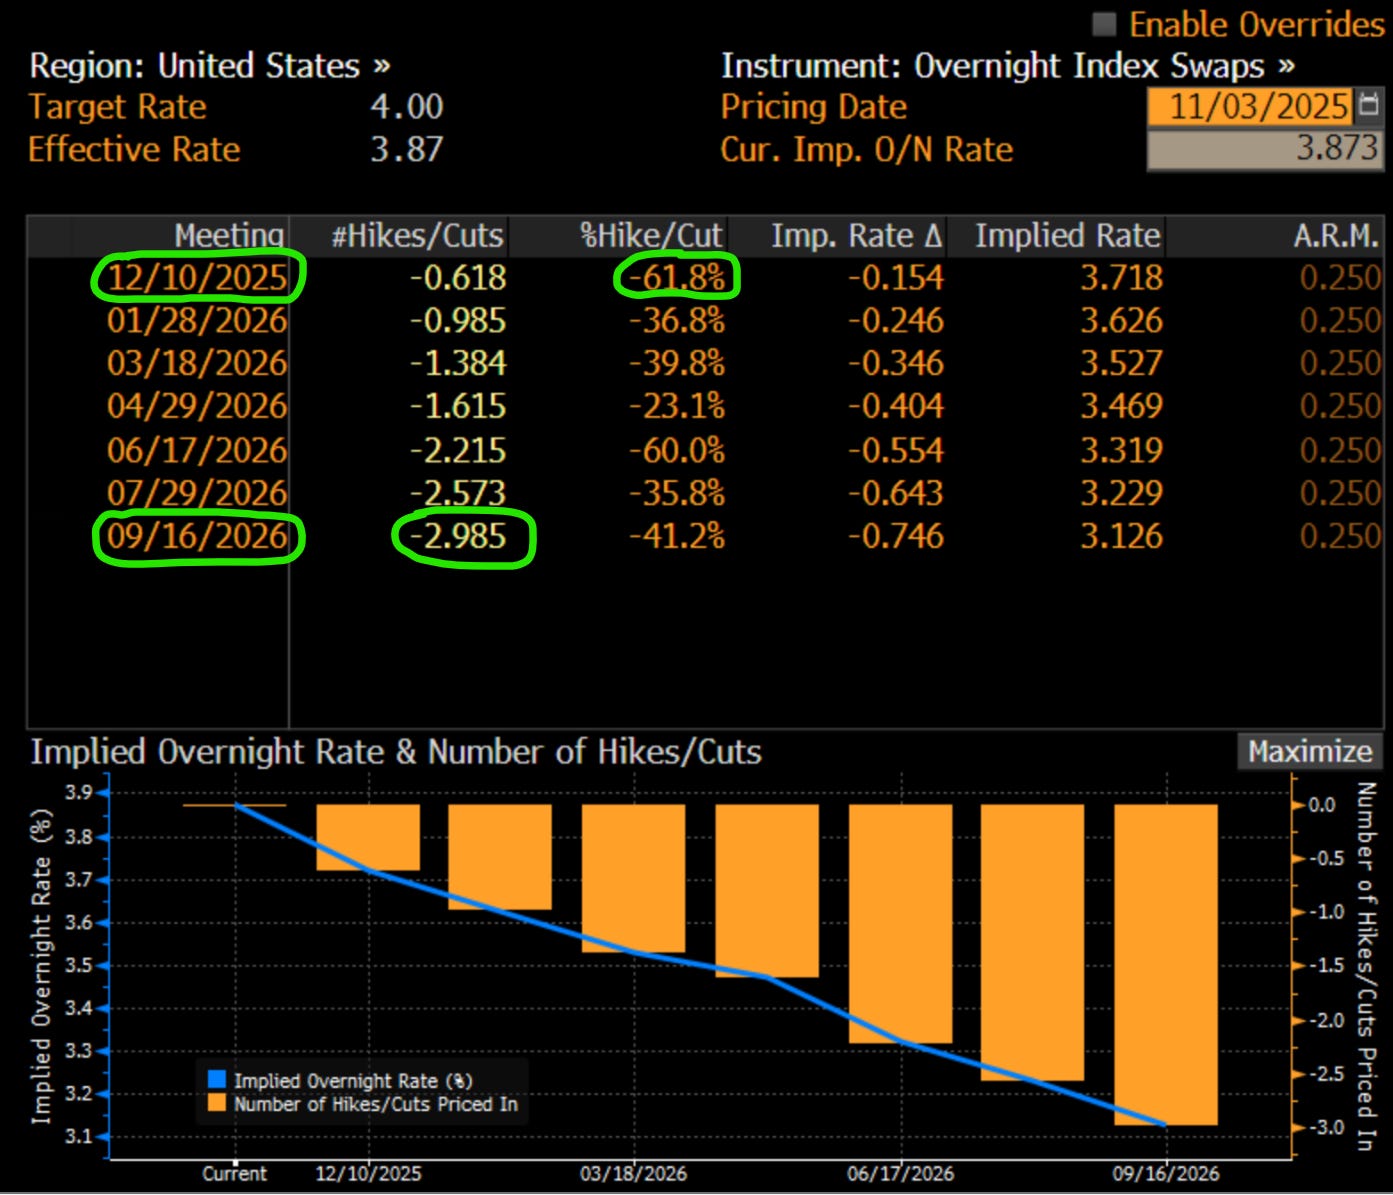
Interest rates expectations/priced in via Fed Funds Futures:
👉 2025 expectations wise: another 0.25% (25 b.p.) cut is in the cards with a 63% probability at the December FOMC (in 38 days to be precise)
👉 2026 expectations wise: 3 rate cuts are priced in by September
Recall Buffett on interest rates: “everything in valuation gets back to interest rates”, … & … “interest rates are ‘gravity’ on stock prices”, “The most important thing is future interest rates”.
Given that, I am also working on a Maverick Special report dedicated to this key topic:
✍️ Maverick Special: The Top 5 Charts You Need to Know About the FED and Interest Rates
Complementary, to unpack way more these key topics via solid rationale, data, nuances and insights, I will also do 2 dedicated Maverick Special reports:
✍️ Is the U.S. Stock Market in a Bubble? (Part II), you can read Part I here
✍️ Market Pockets of Overvaluation, Animal Spirits Behaviour and Bubbly Territory
📊 Bonus: One to buy during a sell-off, preparing the shopping list 📊
With the great on-going bull market, all is easy, we all have it good. Yet, this is the time when many start thinking they are geniuses, some start saying they are better than Buffett, the indices, this fund, that professional.
Some also start showing off how well they did do their neighbors & colleagues, posting online for all to see as they crave attention & clout online. All that while YOLO-ing MEME stocks, leveraged and/or riding a high beta/momentum wave.
One should not fall for that trap, no FOMO. Treating investing as a pi*sing contest is a top mistake investors do, and it happens often when one is not disciplined, and does not have a solid plan. The essence of investing is not to get wiped out (like many will) + to do well no matter what, hence keep compounding long-term.
Therefore, I strongly believe what makes a great investor is his plan, how he reacts and how he does during a bear market and a recession. One part of that is having a shopping list ready to be bought during a bear market. Recall Warren Buffett:

7. Hence, capital deployed at occasionally bargain prices to compound beautifully for the years to come as the recovery happens, and good times come back.
👉 Chart 1 = 3,440% return with a 12.36% yearly return / CAGR (green line) since 1995 VS S&P 500 great also but 2,227% return with a 10.83% CAGR (blue line)

👉 Chart 2 dividend overview = yield + payments:
4.9% = current dividend yield
8% = yield during the 2000s bear market
13% = yield during the 2008 Lehman/GFC crisis
19% = yield during the 2020 Covid crisis
dividend payments stream = recurring and increasing across time, and both during the bad and good periods of the business cycle
Locking-in that dividend stream looks quite juicy during bear markets.

I will cover this stock in detail (business model, management, outlook) in the future via the dedicated single stocks section ✍️ Full Equity Research
P.S. reminder for income/dividend investors:
total returns + after-tax returns = what matters
there is nothing special about dividends per se = that is because you can always sell parts of your investment & create your own dividend at wish
hence very likely more tax efficient (unless in a jurisdiction where income is taxed less than capital gains, and you want income / to sell parts recurrently)
Maverick Charts 47th edition done, 7 key charts with many insights!
You can check all the previous 46 editions in the Maverick Charts section!
Mission accomplished for me if the following resonates with you:
‘Hmm I never thought it that way’, ‘now that chart said a whole lot’, ‘now that chart was really interesting’, ‘now that is something new’, ‘now I got it!’, ‘you managed to turn something complex into something actually simple’
hence, if you got to see something differently, my approach gave you a different angle, it did help you connect your key dots, then here we all do well!
Research is NOT behind a paywall and NO pesky ads here unlike most other places!
Did you enjoy this by finding it interesting, saving you time and getting valuable insights? What would be appreciated?
Just sharing this around with like-minded people, and hitting the 🔄 & ❤️ buttons!
That’ll definitely support bringing in more & more independent investment research: from a single individual … not a corporate, bank, fund, click-baity media or so … !
Like this, the big positive externalities become the name of the game! Thank you!
Have a great day! And never forget, keep compounding: family, friends, hobbies, community, work, independence, capital, knowledge, research and mindset!
With respect,
Your Maverick 👋 🤝
