
✍️ S&P 500 Valuation and Fundamentals + Global Stocks Valuation + S&P 500 and Inflation = Maverick Equities Charts of the Week #52
10 Maverick Charts that say 10,000 words

Dear all,
10 cherry picked Maverick Charts of the week say 10,000 words or more = the ‘How’!
Table of contents = the ‘What’ with the aim for a high density of ideas because the best respect the reader’s time:
📊 Maverick Charts: S&P 500 Valuation and Fundamentals + Global Stocks Valuation
📊 Bonus: S&P 500 and Inflation Symbiosis
Objective: both data-driven insights + valuable food for thought = the ‘Why’!
📊 Maverick Charts: S&P 500 Valuation and Fundamentals + Global Stocks Valuation
S&P 500 Valuation via the forward P/E ratio — path in 2025:
👉 = 22.6x now, and we begun 2025 with 22.6x also — with a 14.5% return!
👉 ‘What happened Mav’? It has gone nowhere in 2025! ‘Why? What’s going on?’
👉 14.5% solid rally in 2025 can be attributed to Earnings growth (the ‘E’ denominator in the P/E ratio), hence not a price/multiple expansion this time (the ‘P’ numerator in the P/E ratio) = a very good development!
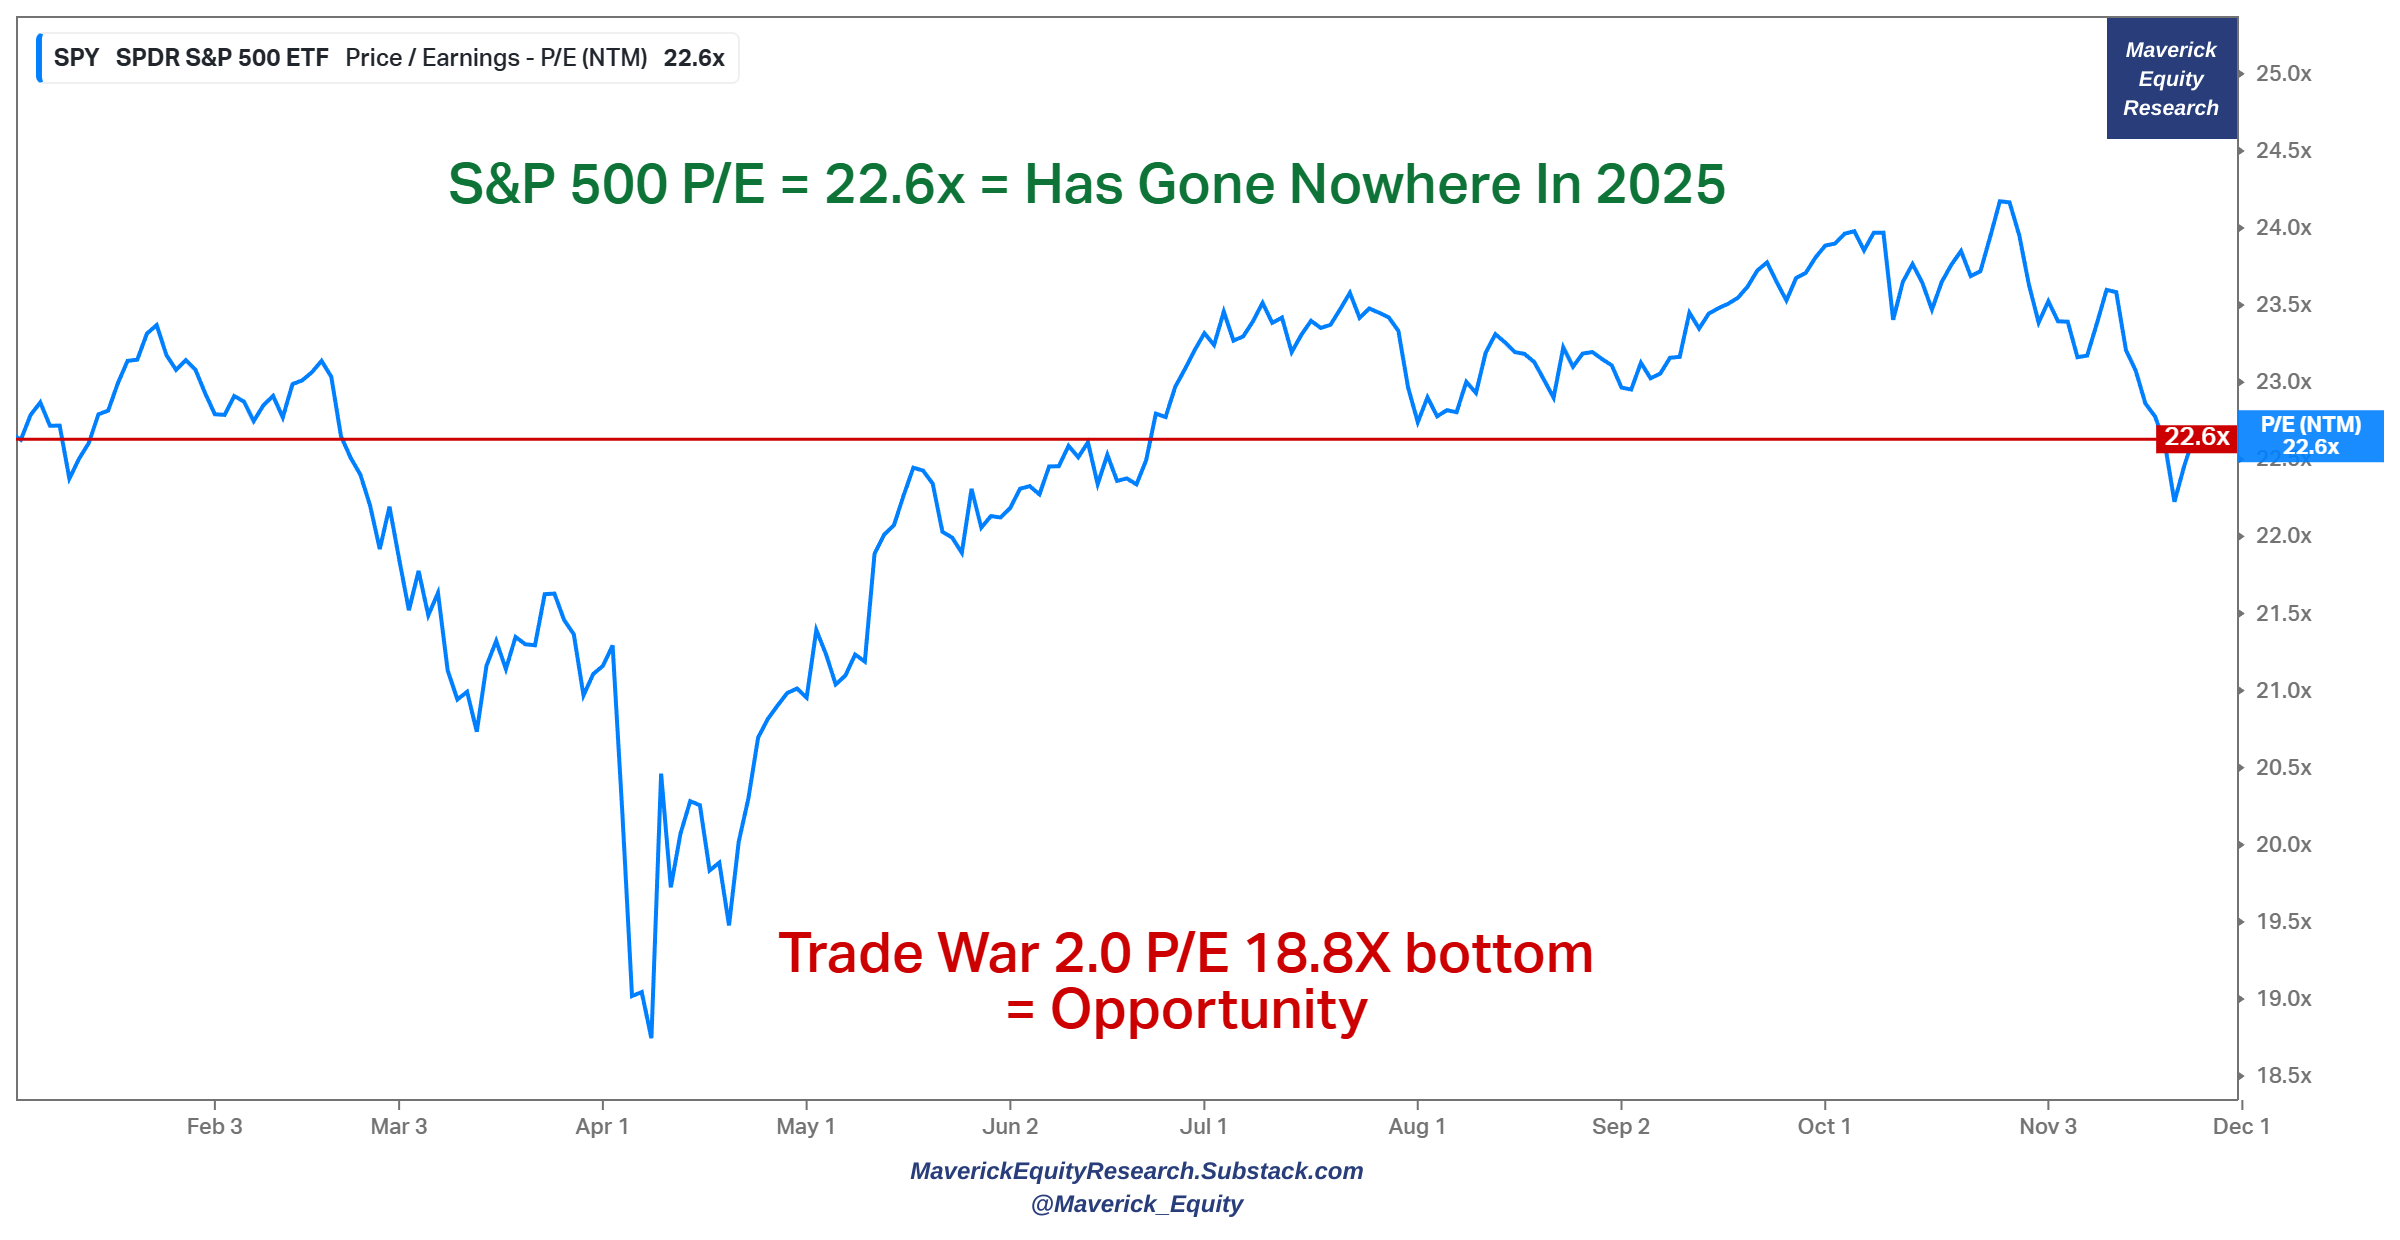
N.B. note the April Tariff War 2.0 / Liberation day saw a 18.8x P/E bottom as the market was tanking like there is no tomorrow = yet that was actually an opportunity!
Hence, I will make 2 Maverick Special reports on that which shall be ‘evergreen’, and serve via being recalled anytime it is needed in the years and decades ahead:
✍️ Big Volatility & Drawdowns = Juicy Returns
✍️ Harvesting Geopolitical Risk Premium Through the Financial Markets and Economic Storms
Complementary, I’m also working also on a live proprietary index covering the often Geopolitical risk premium which should actually be seen as an opportunity.
✍️ Maverick Geopolitical Risk Harvesting Index (MGRH-I)
One to improve materially the medium-long term returns, hence make that compounding machine and effect kick in faster — at the end of the day, as investors we are rewarded to stomach and digest drawdowns and volatility!
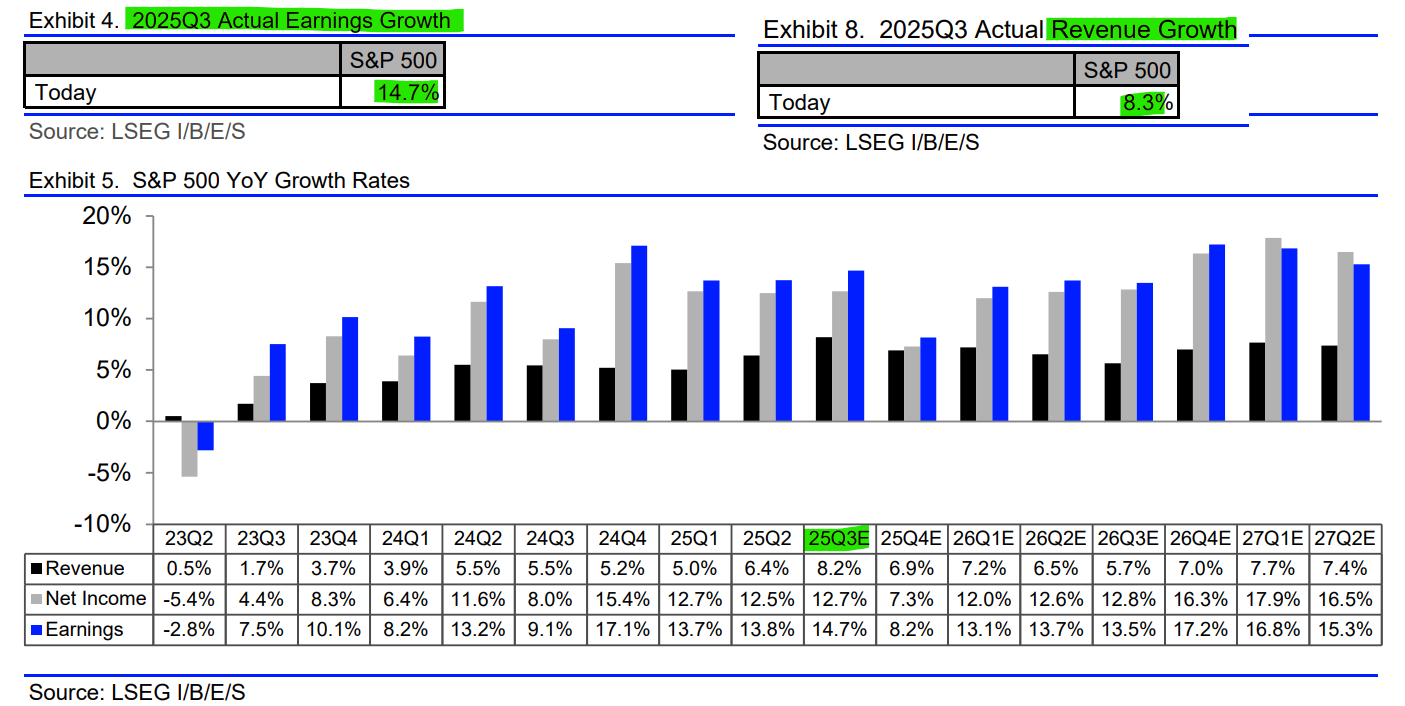
So, how good do those Earnings look like? Q3 Earnings & Revenue scorecard (freshly updated November 21st) with 472 companies in:
👉 earnings growth = +14.7% (solid ... )
👉 revenue growth = +8.3% (very solid also ...)
👉 4th straight quarter with double-digit earnings growth — last time was Q1 2021 through Q4 2021
👉 at the sector level: 4 sectors are reporting double-digit earnings growth for the quarter: Information Technology, Utilities, Financials, and Materials
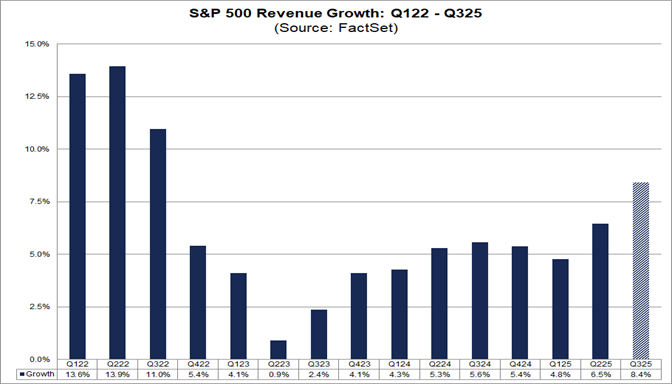
Revenues/Top-line wise, Highest Revenue Growth in 3 Years:
👉 8.3% = it will mark the highest revenue growth rate since Q3 2022 — 11.0% then
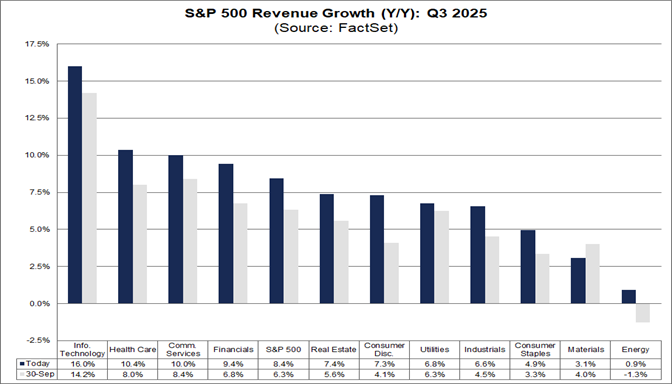
At the sectors level:
👉 all 11 sectors with Year-over-Year revenue growth
👉 3 sectors with double-digit revenue growth: Information Technology, Health Care, and Communication Services
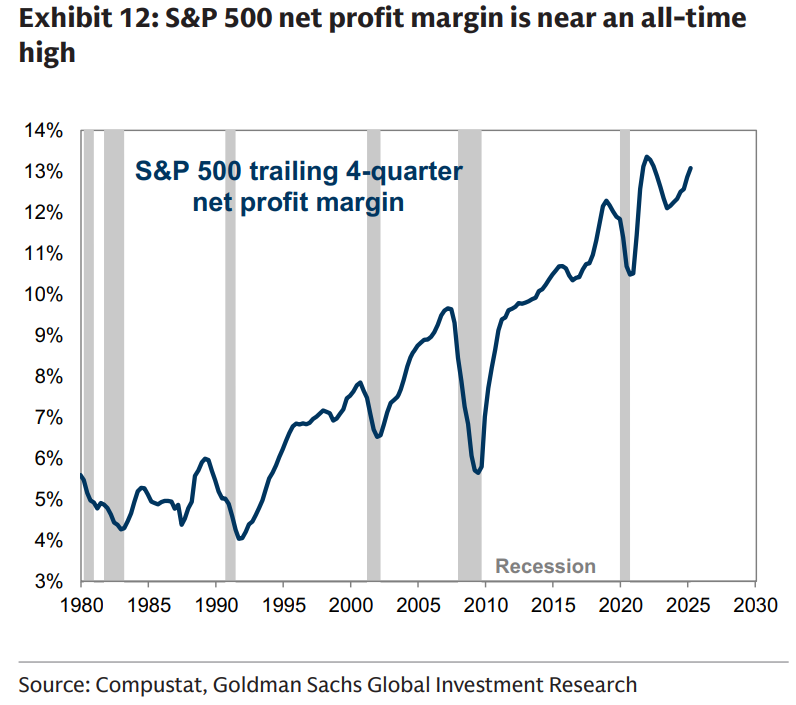
S&P 500 Net Profit Margin (NPM) = 13% = near the all-time highs also!
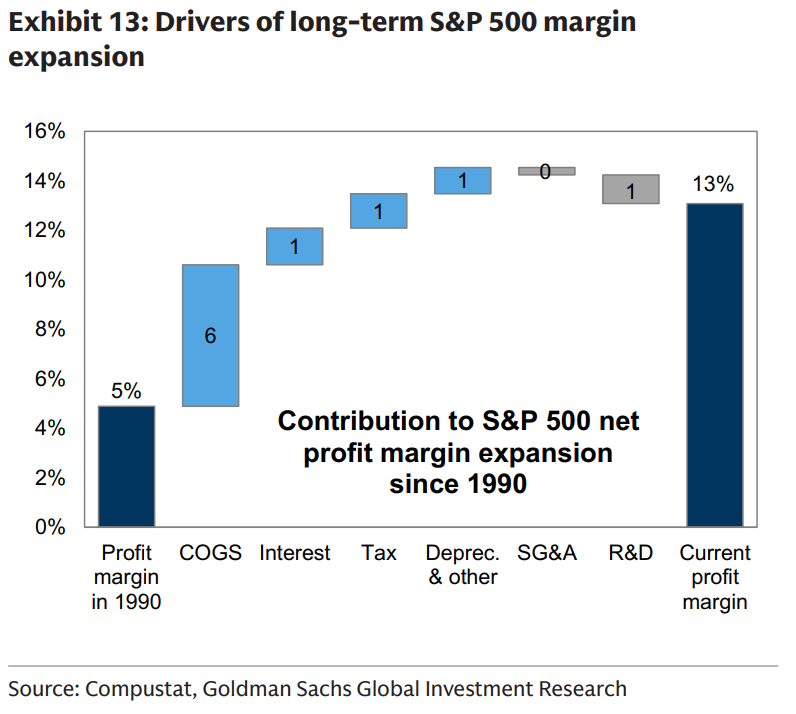
Key question - what variables drove the Net Profit Margins in the last 35 years? Which ones are the tailwinds that drove the NPM from 5% in 1990 to 13% in 2025?
👉 5.7% as the big chunk via lower COGS (Cost of Goods Sold), hence way higher gross margins: partially a consequence of the integration of global supply chains + type of businesses, meaning sector composition: more tech (carrying more intangible assets, very scalable, ‘light’ type of businesses)
👉 2.9% via lower interest rates & corporate tax rates — note, going forward these two neither appear likely to decline as much during the next decade: tax rates fell big time and while interest rates rose recently, overall it was a big trend down since 1990
👉 this also explains why we have enjoyed lately (especially in the last 15 years) way higher returns than the 10% historical average
Hence, on the NPM: let that one sink in … and … bring the sink if you wish like! 😉

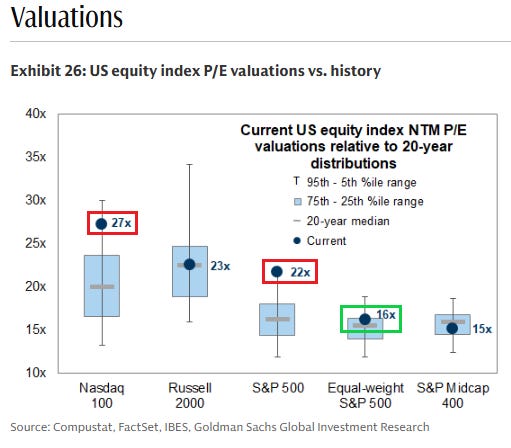
U.S. Stocks Valuation overview via forward P/E - last 20 years distributions:
👉 Nasdaq 100: from a mega 30x, cooled off a bit at 27x, up high in the 95th-5th percentile range
👉 S&P 500: at 22x and up there very high in the 95th-5th percentile range
👉 S&P 500 equal-weight: at 16x cooler than the weighted S&P 500, touching also the 75th-25th percentile range
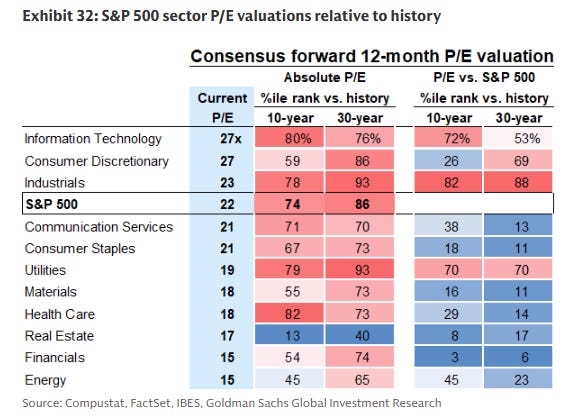
11 Sectors Valuations shaping the S&P 500 via forward P/E relative to history (absolute to sector itself and relative to the S&P 500 index) — a great overview:
👉 Technology = 27x, high relative to history
👉 Utilities = 19x, quite high relative to history
👉 Financials = 15x, very low relative to the S&P 500
👉 Energy = 15x also
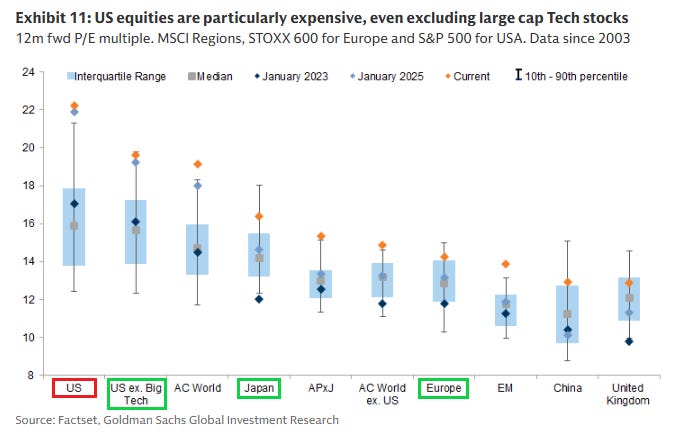
Zooming out: US & Global Stocks Valuations overview via forward P/E:
👉 US = 22x = pricey, quite pricey: way outside the interquartile range, and also outside the 10th-90th percentile
👉 US excluding Big Tech = 19x = less pricey, but still pricey: outside the interquartile range, and also outside the 10th-90th percentile
👉 Japan, Europe = more decent despite the recent very solid performances
P.S. way more via my quarterly two distinct S&P 500 reports & materially improved in all areas: structure, flow, insights and special metrics you rarely see:
✍️ S&P 500 Report: Valuation, Fundamentals, Special Metrics & Leading Indicators
✍️ S&P 500 Report: Performance, Sentiment, Seasonality, Technical Analysis
For Top-down & Bottom-up approaches, connecting the Macro-Finance bridge also:
✍️ The State of the U.S. Economy in 75 Charts
The reports aim to break down the key aspects of the stock market and the economy. Ultimately, they aim to answer the 2 biggest question in Finance and Economics:
“Is the stock market = highly undervalued (very cheap), undervalued (cheap), fairly valued, overvalued (expensive), or highly overvalued (very expensive)?”
“What is the state of the U.S. economy, and what is the current probability of a recession?”
📊 Bonus: S&P 500 and Inflation Symbiosis 📊
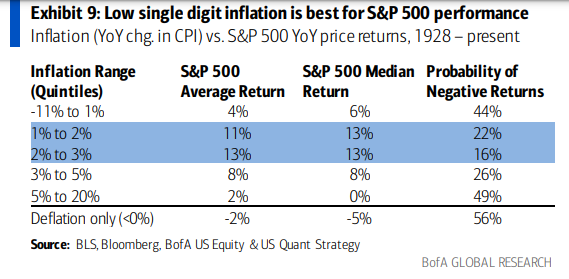
S&P 500 Performance & Inflation Rates — almost 100 years of it since 1928:
👉 low single digits 1-3% inflation = the best for the S&P 500: 11-13% average and median returns
👉 even 3-5% inflation is not bad at all: 8% average and median returns
👉 deflation when <0% inflation sucks: -2 to -5% average and median returns
Complementary, incoming 2 Maverick Special reports on Inflation overall:
✍️ Inflation - Nuts & Bolts, Ins & Outs
✍️ Inflation - Pricing, Expectations & Leading Indicators
Maverick Charts 52nd edition done, 10 key charts with many insights + Bonus!
You can check all the previous 51 editions in the Maverick Charts section!
Mission accomplished for me if the following resonates with you:
‘Hmm I never thought it that way’, ‘now that chart said a whole lot’, ‘now that chart was really interesting’, ‘now that is something new’, ‘now I got it!’, ‘you managed to turn something complex into something actually simple’
hence, if you got to see something differently, my approach gave you a different angle, it did help you connect your key dots, then here we all do well!
Research is NOT behind a paywall and NO pesky ads here unlike most other places!
Did you enjoy this by finding it interesting, saving you time and getting valuable insights? What would be appreciated?
Just sharing this around with like-minded people, and hitting the 🔄 & ❤️ buttons!
That’ll definitely support bringing in more & more independent investment research: from a single individual … not a corporate, bank, fund, click-baity media or so … !
Like this, the big positive externalities become the name of the game! Thank you!
Have a great day! And never forget, keep compounding: family, friends, hobbies, community, work, independence, capital, knowledge, research and mindset!
With respect,
Your Maverick 👋 🤝

Great point about pe and earnings growth.