
✍️ The Yield Curve, AI and Productivity, Wealth, U.S. Debt & USD + Happiness Bonus = Maverick Macro Charts of the Week #48
7 Maverick Charts that say 10,000 words

Dear all,
7 cherry picked Maverick Charts of the week say 10,000 words or more = the ‘How’!
Table of contents = the ‘What’ with the aim for a high density of ideas because the best respect the reader’s time:
📊 Maverick Charts: The Yield Curve, Recessions & Bear Markets, AI and Productivity, Wealth by Generations, U.S. Debt & USD, Consumer Sentiment
📊 Bonus: Happiness = Gratitude - Expectations - Envy
Objective: both data-driven insights + valuable food for thought = the ‘Why’!
📊 Maverick Charts: The Yield Curve, Recessions & Bear Markets, AI and Productivity, Wealth by Generations, U.S. Debt & USD, Consumer Sentiment 📊
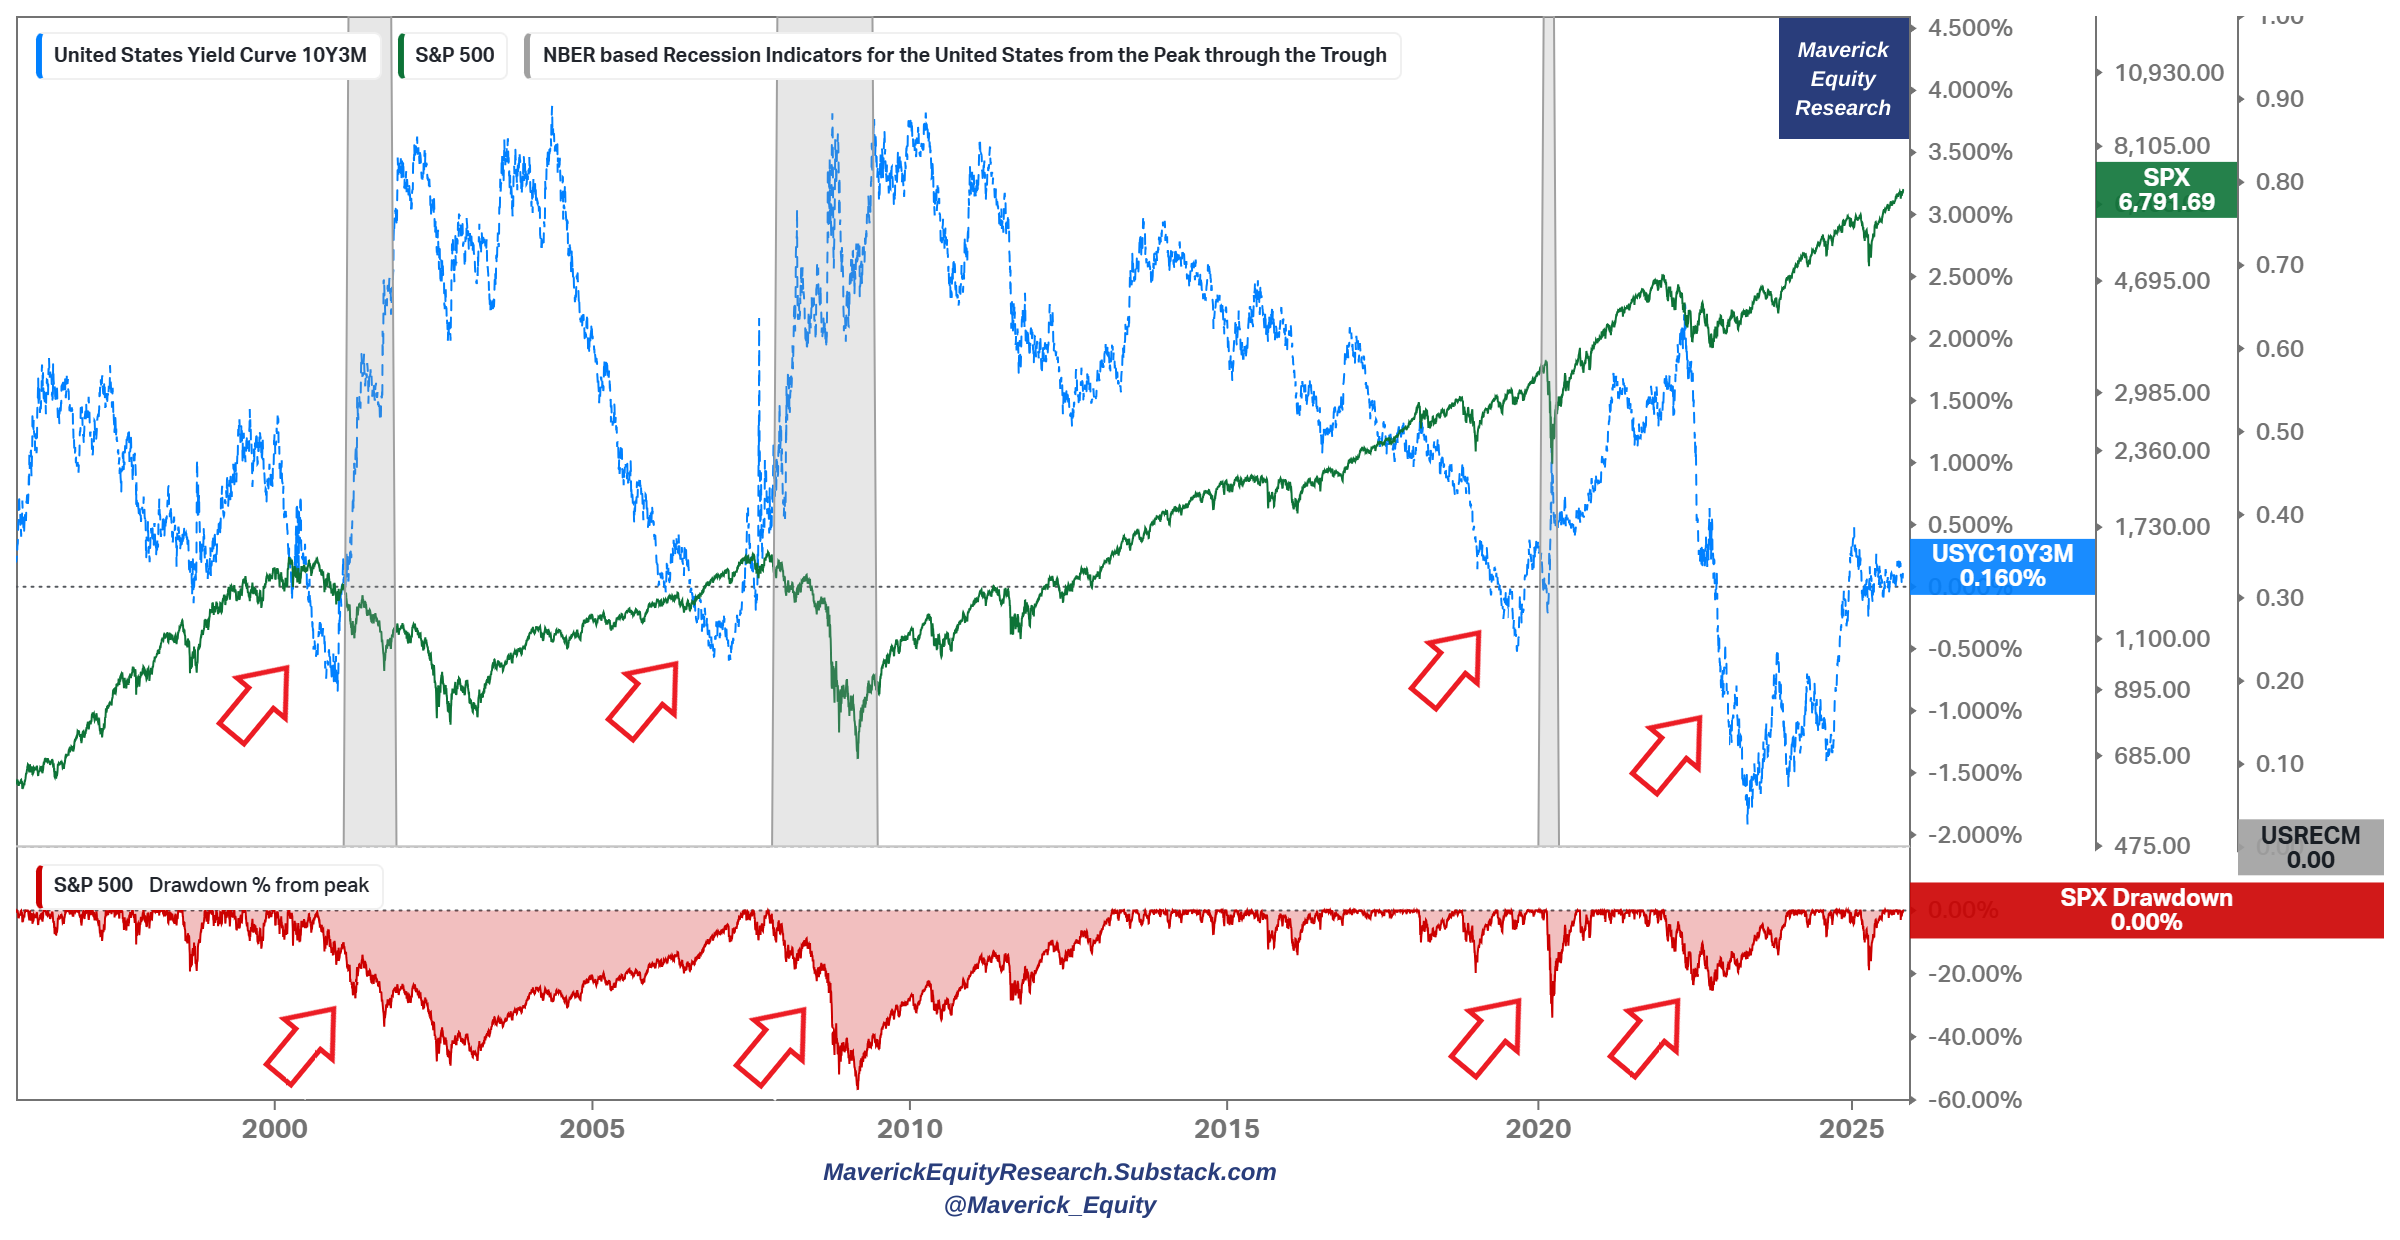
Connecting monetary policy, the bond market via the Yield Curve with the stock market via the S&P 500 (Macro-Finance) — let’s check them all out with one chart:
Yield Curve 10Y-3M (blue) = 0.16% is back again positive — chart shows the last 30 years of inversions/un-inversions and the S&P 500 (green) for the famous markets/economics mantra ‘Is This Time Different?’
👉 2022: recession wise (grey), yield curve inversions most of the time signals an incoming recession, though most recently it gave us the head fake (false signal) in 2022 as the most anticipated recession never came = ‘It Was Different This Time’
👉 2022: stock market wise (green) though, the positive signal was still valid also for the 2022 bear market (drawdown in red) = ‘It Was Not Different This Time Either’
Therefore:
👉 Recessions wise:
Yield Curve inversions are to be watched for likely incoming tough periods
note that the exact inversion points are not the real/true signal for an incoming recession, but it’s the uninversion period coming right after — in other words, it is the steepening post-uninversion that is when things start to happen
given that we did not have a solid uninversion so far (YC is only a bit positive), technically the YC could still foresee a recession should it go higher / steepen
on the other side, this inversion and un-inversion period has been going on for +3 years which is quite atypical … in any case, a steepening is to be watched!
👉 Stock Bear Markets wise:
just like Maverick in Top Gun going inverted, it very likely DOES show us the birdie, hence the incoming bear market - fair & nice guy, no? 😉
each of the past 4 big bear markets since 1995 were preceded by YC inversions
Hence, the yield curve is still one to be watched!
N.B. there is for sure a lot more about the Yield Curve special topic:
more yield curve types, context, nuances, other variables, hence still judgement calls to be made on a case by case (regime by regime) basis
that is why in 2026 I will also do a Maverick Special dedicated report covering: longer history, more key stats, more intricacies, more insights and takeaways
✍️ Maverick Special: Yield Curves, Recessions and Bear Markets, a Deep Dive
AI & Productivity = connecting the AI thematic with the real economy via a historical chart from 1894 on the U.S. business sector labor productivity:
👉 early industry gains drove the largest productivity booms ...
👉 current productivity (the base) is still pretty low ...
👉 hence, is AI the next productivity train everybody embarks on?

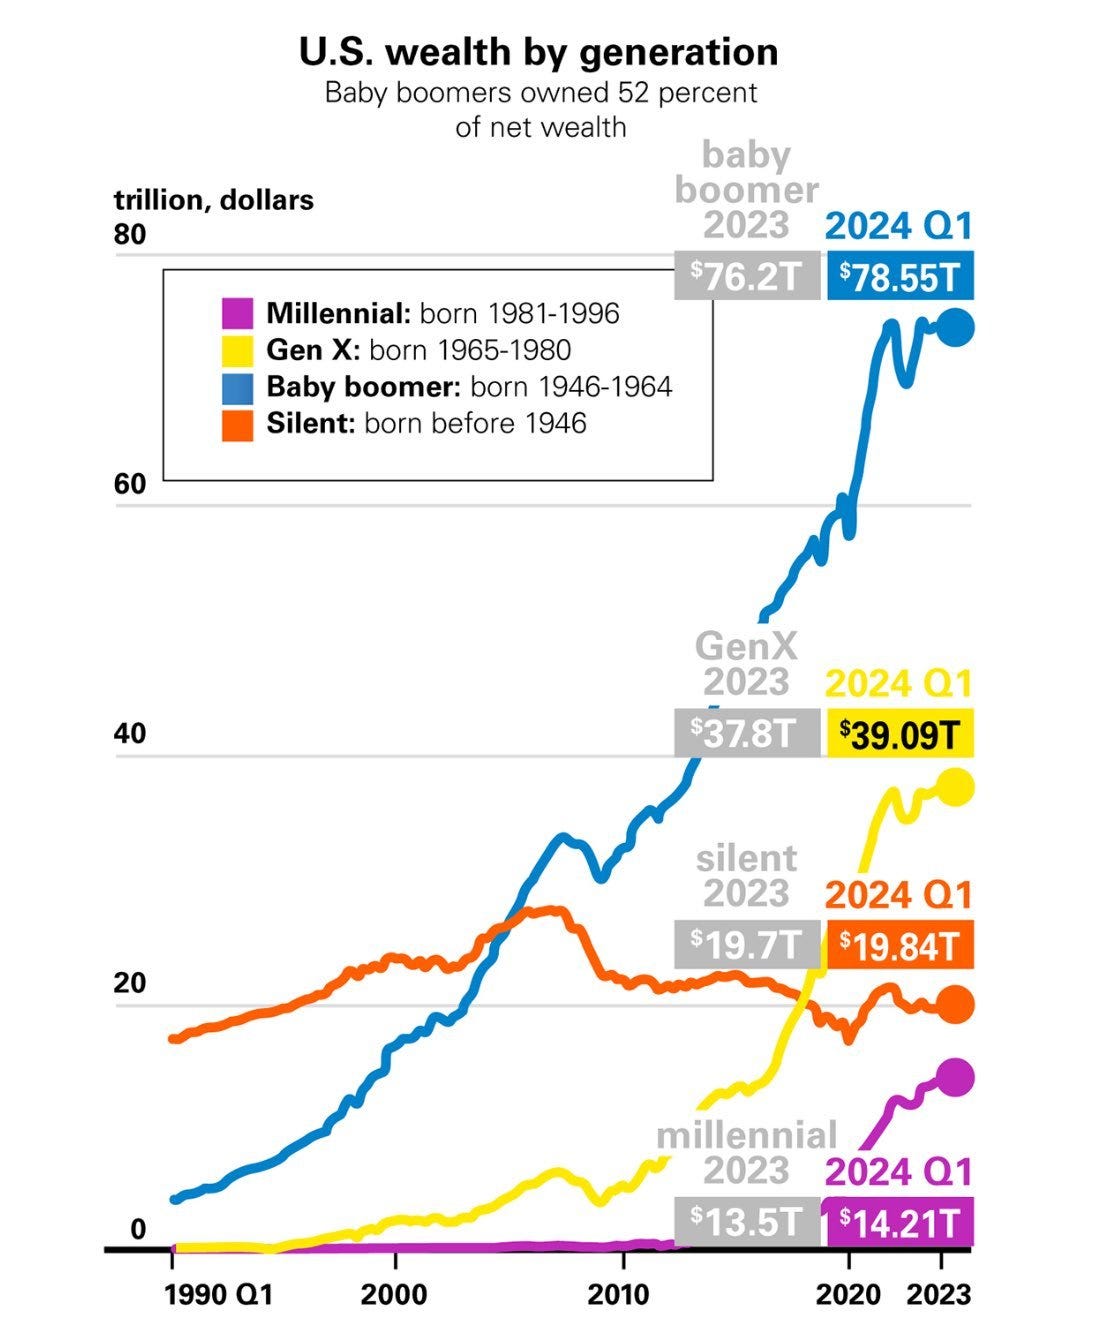
U.S. Wealth by Generation = +150 trillion total (2024 Q1), let that one sink in!
👉 Baby boomers (born 1946-1964) own 52% of the entire net wealth = 78.5 trillion
👉 Gen X (born 1965-1980) own 26% = 39.1 trillion
👉 Silent Gen (born before 1946) own 13% = 19.8 trillion
👉 Millennials (born 1981-1996) own 9% = 14.2 trillion
How is that distributed deeper among the population? Well, quite a story, a different and way deeper story … I will also do a Maverick Special report on that …:
✍️ Inequality, Wealth Concentration, Taxation, Equity and More
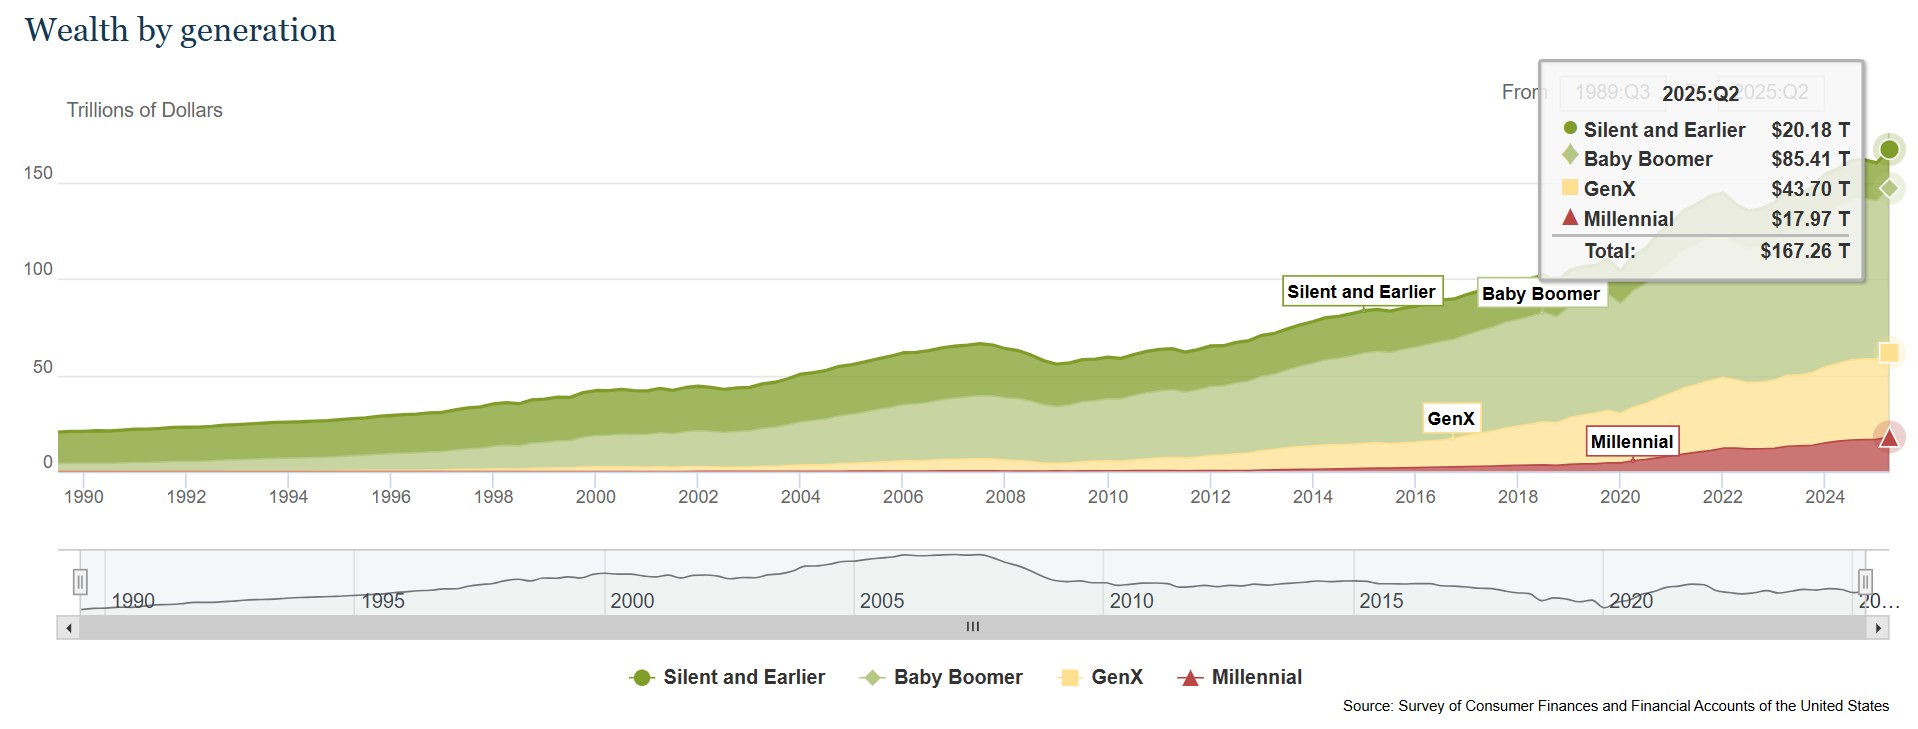
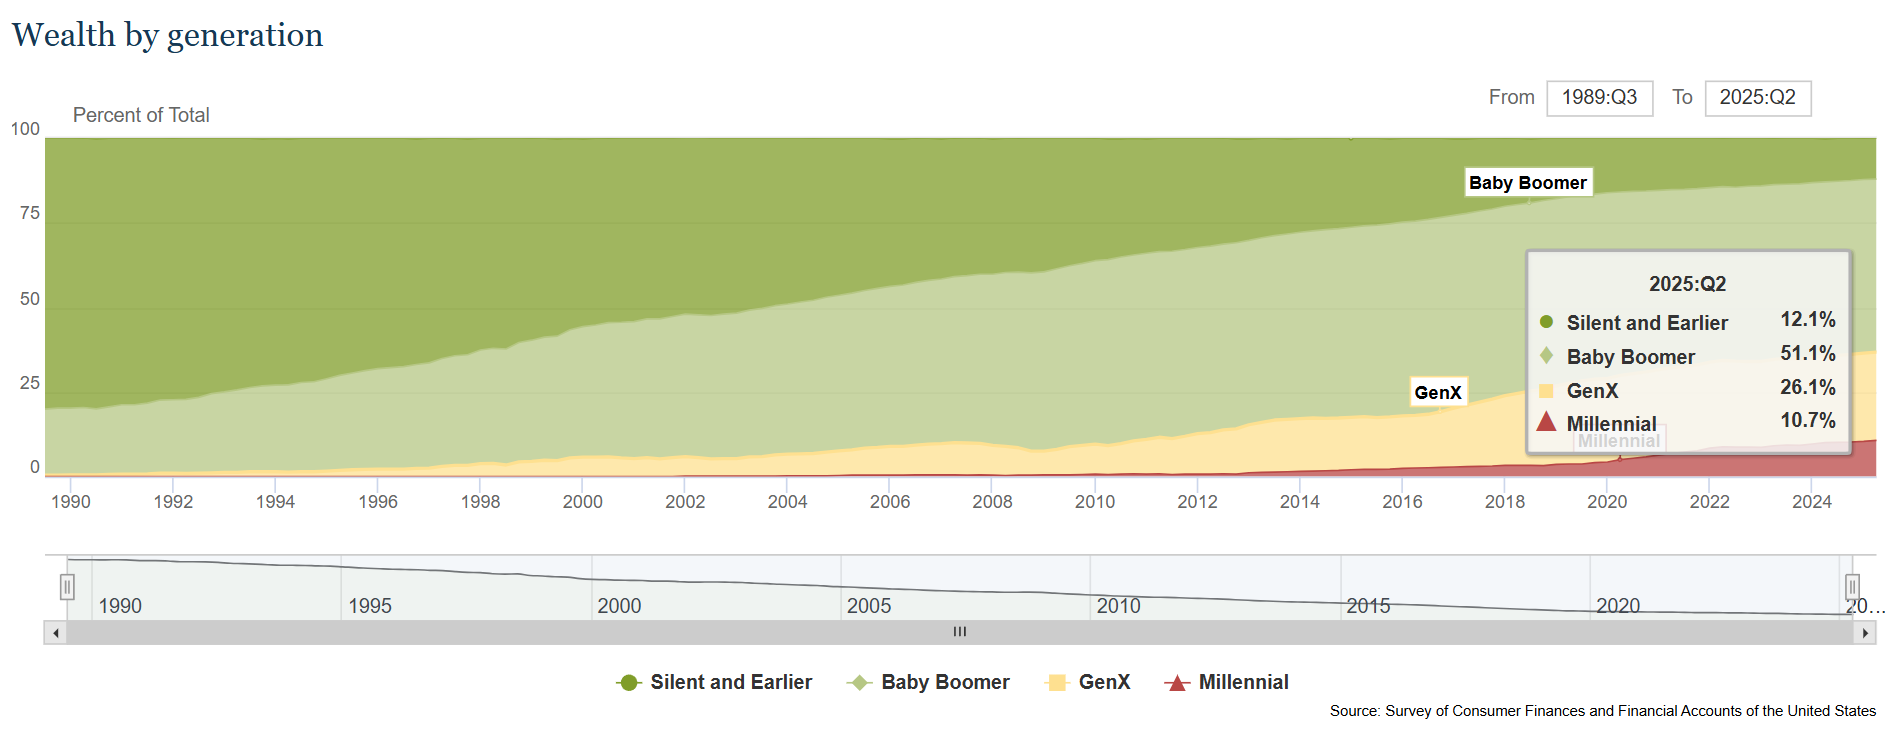
Complementary bonus views updated as of Q2 2025 (latest available): total & share %:
From the +150 trillion in wealth, what about the U.S. government debt?
👉 surpassed $38 trillion, an all-time high
👉 +10 trillion in less than 5 years
👉 +$500 billions jump in the last month
👉 +$16 billion per day
Current fiscal path isn’t good:
125% debt-to-GDP ratio, +7% deficits annually (highest among advanced economies), and IMF projecting a 143.4% debt-to-GDP by 2030
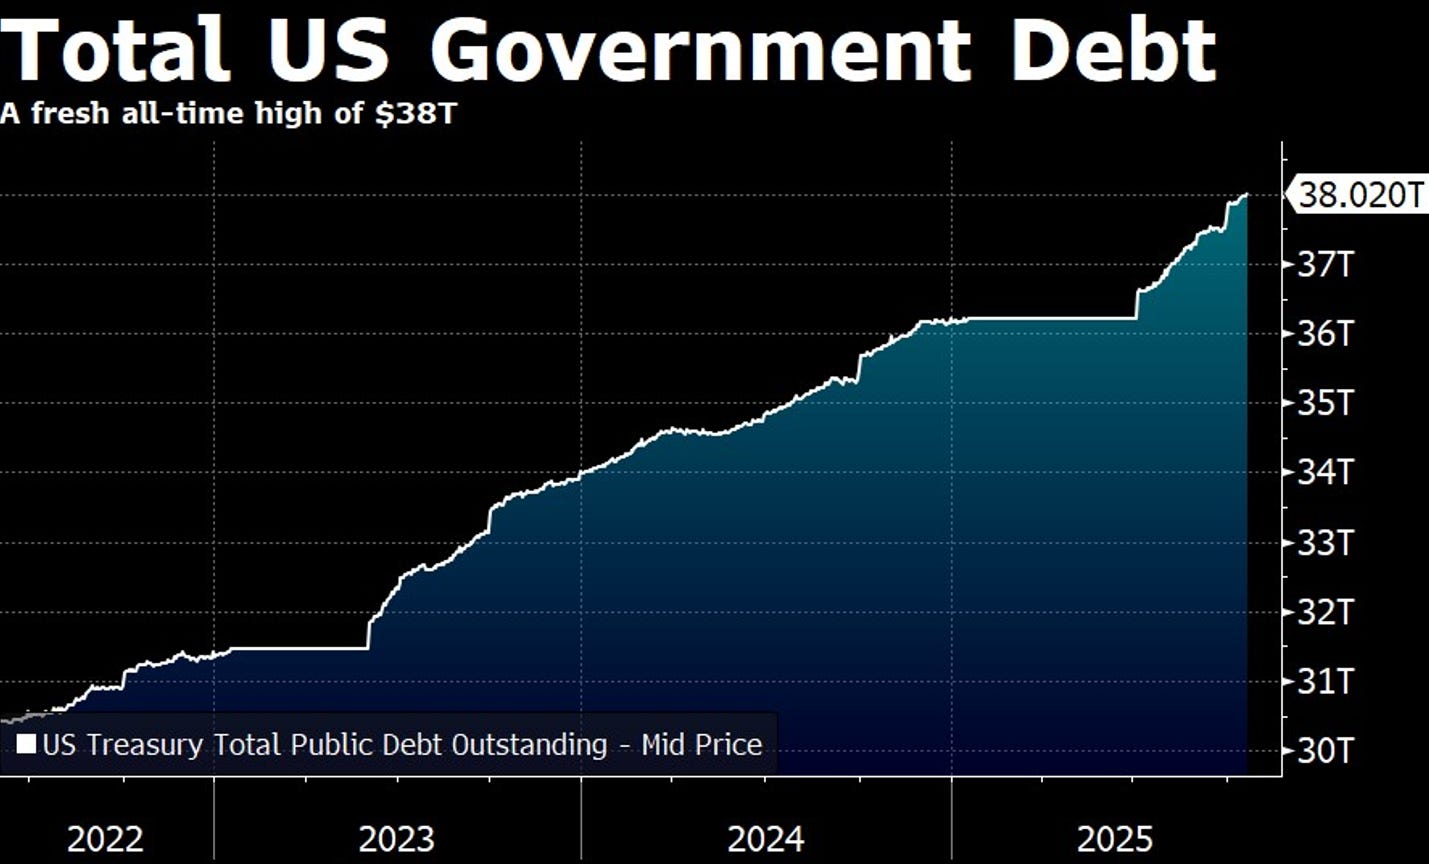
No wonder the USD is having one of the worst years in decades

N.B. in case you missed the Maverick Special dedicated report on the topic, there you go below. Given the importance of the topic, there will be future updated editions:
✍️ U.S. Public Debt Reduction = Hard but Feasible. Maverick Special #6
Understanding fiscal policy, politics in general is important:
👉 yet partisan investing views is not a good idea — actually, investors who cannot separate their political views/bias from their investing are destined to lose money
👉 your own hard earned capital does not care about your politics, only where it is deployed to grow — political bias is free, but very costly to follow! (I saw this happen so much that I could write a book with the use cases)
Nonetheless, politics clearly plays a role in people’s perception of the economy, and for that we just have to look at Consumer Sentiment by Party Affiliation:
👉 the gap between Republicans and Democrats’ sentiment hit a record high in October via the University of Michigan Consumer Sentiment Index
👉 check the spread (bottom blue/red) and see how ‘consistent’ the spread is across election cycles, yet that is for the wrong reasons … watch out how people’s political views distort how they perceive economic realities VS what it truly is
👉 in short, the real economy isn’t what people have it, but what team they’re on - everyone likes to be on the winning team … even if overall it is not the best team …

N.B. in case you missed the Maverick Special dedicated report on the topic, there you go below. Given the importance of the topic, there will be future updated editions:
✍️ U.S. Presidency - Does It Really & Deeply Matter? Maverick Special #3
From partisan investing views, to personal political views: not only that it’s best to leave politics out of investing, but also daily personal consumption and debate should not be too high: spending too much time on politics carries a big opportunity cost!
👉 10h/week makes for 520h/year, and 2,080 hours for just one 4-year political cycle
👉 make that 4 times, for 16 years, and it is 8,320 hours spent …
👉 not saying to ignore politics, just that to understand what is going on and know whom to vote for, does not require spending thousandths of hours on — going beyond emotions, be it I/we like it or not, there is not much control over it …
👉 how many better things one could do with those hours? read a book, make a new course, work more … invest more = compound faster … exercise, sleep, relax more!
Usually when I say this to people, they are usually bothered by it. Some of them follow ‘the advice’ and some I meet randomly years after, and they tell me: ‘thanks a lot man, I am a different person now, better, more balanced, I focus on what matters, and I have more things under control. I have changed my mindset and my life!’.
And that is one of the easiest and most reliable forecasts I can make! That is because Politics are prone to polarisation, and together with News in general are a big part of ‘The Rise of Negative Media’ for clicks & views for advertising money. Algos are just made like that, because that is what attracts views!
As always, I have empirical data on that not just some empty or random opinion:
👉 there is a huge negative news positive bias, and a big positive news negative bias.
👉 since 2010, the media massively increased headlines that use fear, anger, disgust, and sadness. Correspondingly, it has also decreased articles of neutrality and joy.
Hence, it’s not surprising when I see people that go from obsessed about politics to a more balanced consumption, that they feel better, they use their time and skills on things they can actually control directly, hence just become way better individuals.

N.B. overall economy wise, way more via the next comprehensive & improved report:
✍️ The State of the U.S. Economy in 75 Charts, Edition #4
📊 Bonus: Happiness = Gratitude - Expectations - Envy 📊
As you got used to, this section is usually also for charts, but this time around it is way more than that. We all have the topic of happiness around our thinking, and while it is very subjective and impossible to quantify, actually I always had a ‘formula’ for it:
Happiness = Gratitude - Expectations - Envy
gratitude and expectations are more internal while envy can be seen external
if expectations are too high, even if we do achieve a lot, yet it is below our (maybe unrealistic) expectations, then expectations is a negative actually — other than that, all great with having high expectations and achieving them!
envy, goes without saying is not helpful, except when seen via a positive spin as a catalyst: ‘I can do a lot and achieve that also!’ , ‘if he/she can do it, then I can also!’
Going forward, I just suggest you watch this segment from CNBC’s Squawk Box: Arthur Brooks on Mood of Nation - enjoy!
tech is great, but take breaks from it, used in excess it becomes detrimental
less news, less politics, less polarisation, less ‘inside the algo’, more outdoors
switching from the ‘The Pursuit of Happiness’ by inverting it and having a run with ‘The Happiness of the Pursuit!’
Arthur Brooks podcast (I am not affiliated, I was not paid for via an ad placement):
Takeaway:
👉 you reading this, it is very likely you are doing just fine or even great: you did your best, ups and down, just take a moment to pause & self-reflect, give it a go on being grateful for all your successes, failures from which you learned, all your trial and errors … and from there, keep enjoying your journey, keep it rocking!
Maverick Charts 48th edition done, 7 key charts with many insights!
You can check all the previous 47 editions in the Maverick Charts section!
Mission accomplished for me if the following resonates with you:
‘Hmm I never thought it that way’, ‘now that chart said a whole lot’, ‘now that chart was really interesting’, ‘now that is something new’, ‘now I got it!’, ‘you managed to turn something complex into something actually simple’
hence, if you got to see something differently, my approach gave you a different angle, it did help you connect your key dots, then here we all do well
Research is NOT behind a paywall and NO pesky ads here unlike most other places!
Did you enjoy this by finding it interesting, saving you time and getting valuable insights? What would be appreciated?
Just sharing this around with like-minded people, and hitting the 🔄 & ❤️ buttons!
That’ll definitely support bringing in more & more independent investment research: from a single individual … not a corporate, bank, fund, click-baity media or so … !
Like this, the big positive externalities become the name of the game! Thank you!
Have a great day! And never forget, keep compounding: family, friends, hobbies, community, work, independence, capital, knowledge, research and mindset!
With respect,
Mav 👋 🤝

I can always learn much more than just financial knowledge from you. It's more about life philosophy or the attitude towards life and dealing with people.
Hey Mav, thanks for your time and the education you provide, great touch at the end of the post