Dear all,
5 + 1 cherry picked Maverick Charts of the week say 10,000 words or more = the ‘How’!
Table of contents = the ‘What’! Executed in a succinct manner with the aim of a high density of ideas, because great research respects the reader’s time:
📊 Maverick Charts: GDP, FOMC Outlook & Financial Conditions
📊 Bonus: ‘POTUS’ Job Approval Rating
Objective: both data-driven insights + valuable food for thought = the ‘Why’!
📊 Maverick Charts: GDP, FOMC Outlook & Financial Conditions 📊
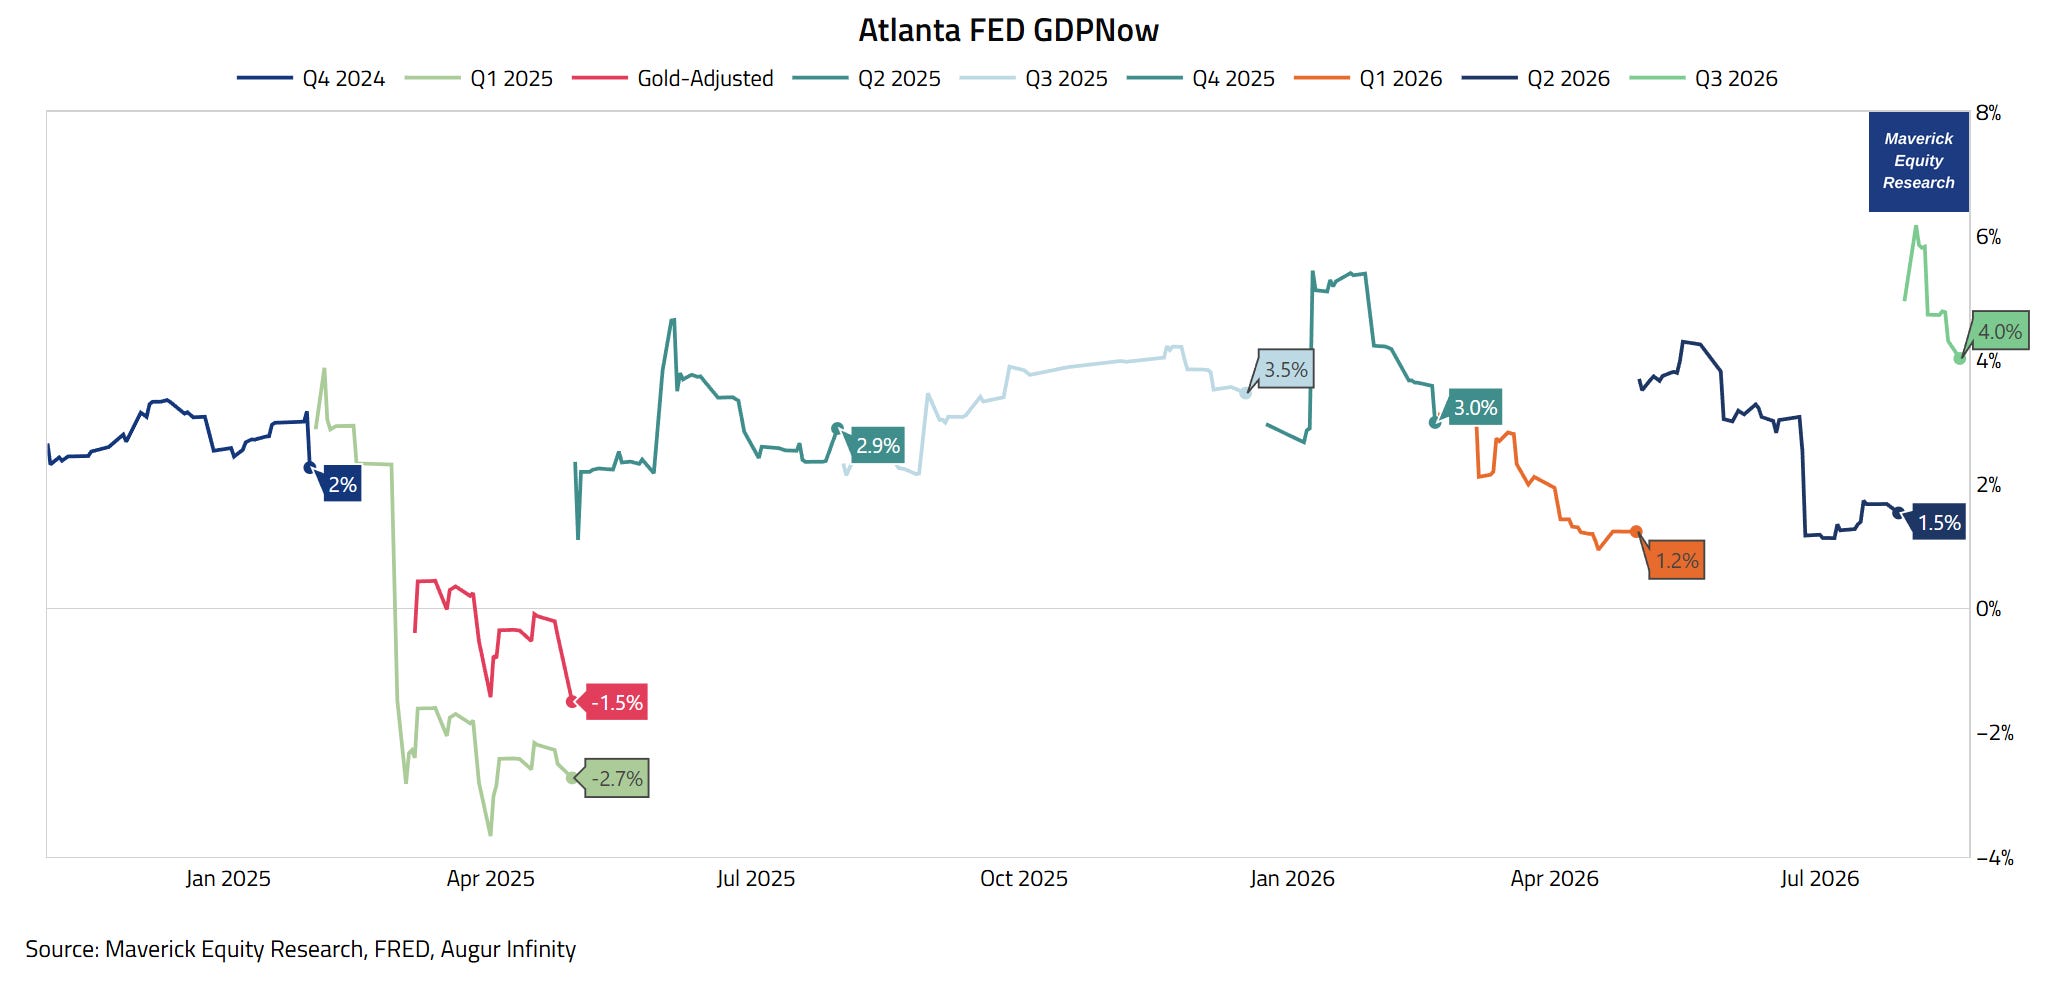
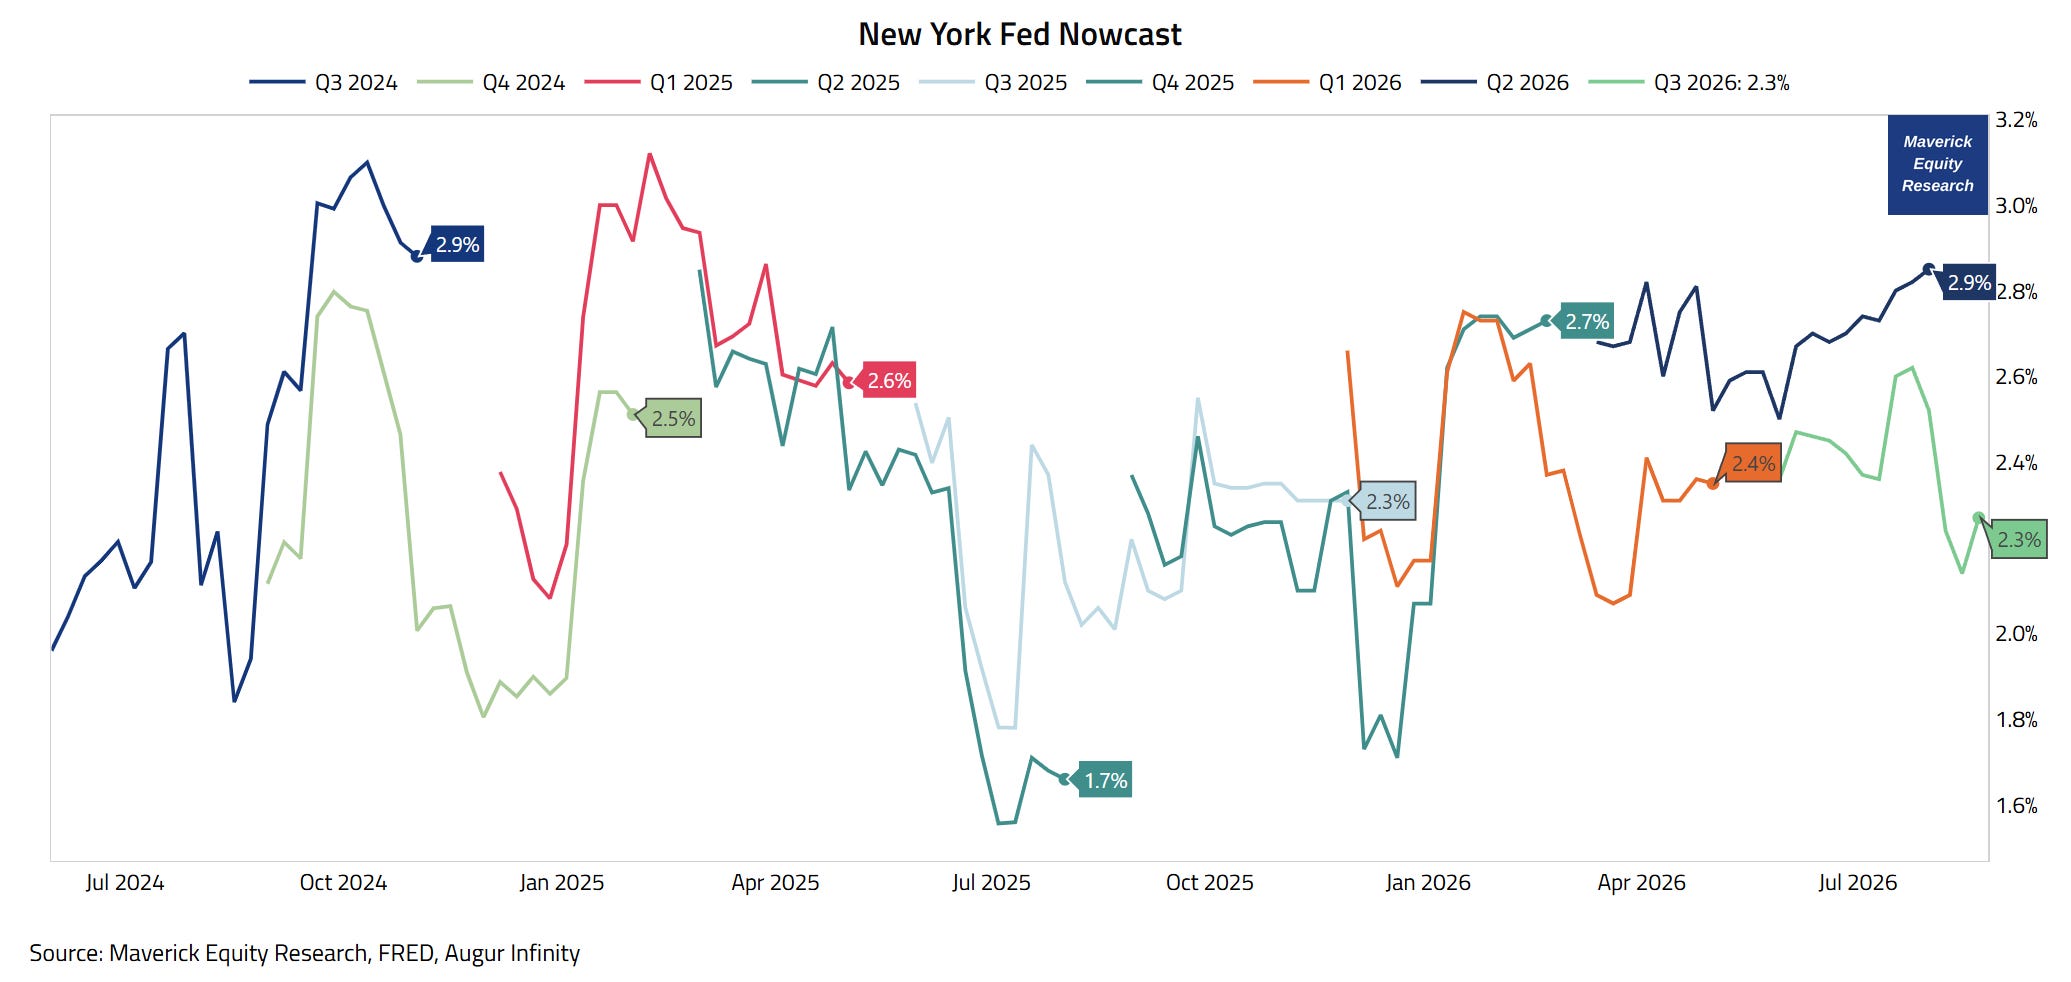
U.S. Q3 GDP latest estimates from the Atlanta FED & New York FED:
Atlanta Fed GDPNow real GDP latest estimate from August 18th:
👉 +4.0% = a very solid reading — note how it was +6% when the quarter begun
New York FED Nowcast latest and fresh estimate from August 21st:
👉 +2.3% = a very solid reading also — note, it is a smoother / more compact estimate
"What is the FED’s latest view on the economy, Mav? Can you do that in one single chart? You the master chartist out there with those Maverick Charts for 10,000 words!"
Yes, there you go:
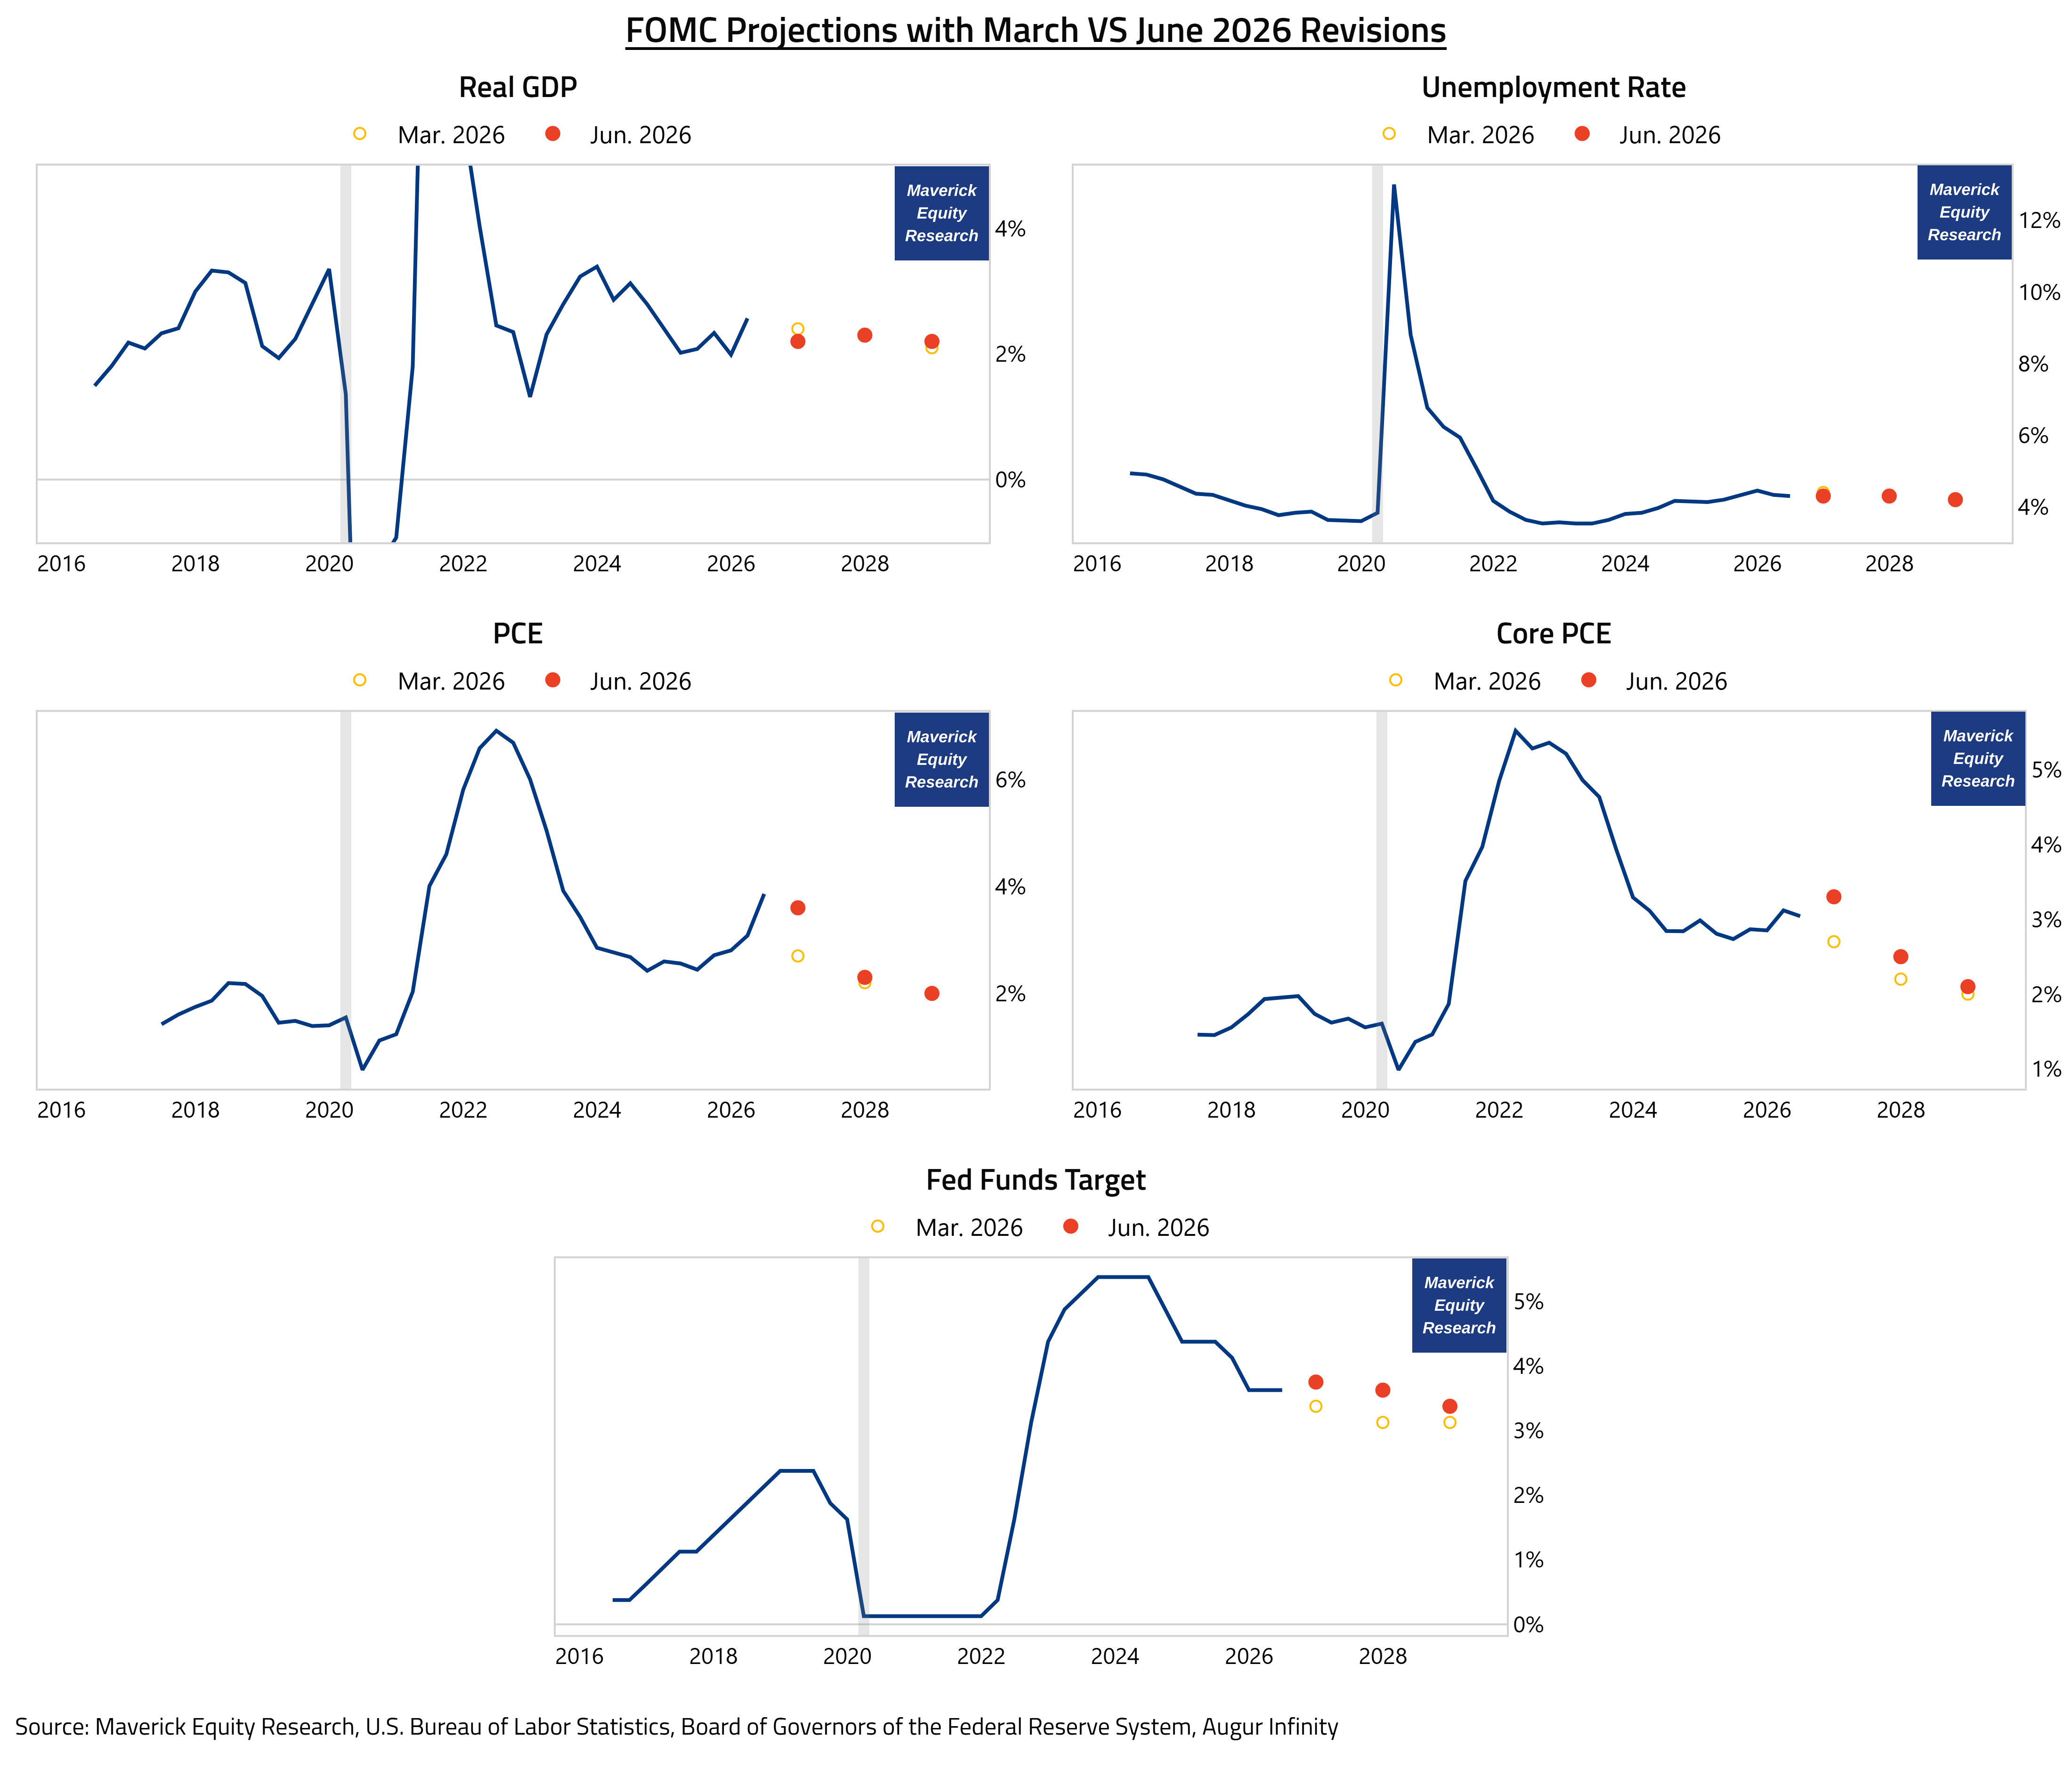
FOMC projections including March VS June 2026 revisions:
👉 Real GDP: revised downwards from 2.4% to 2.2% for YE 2026 = lower growth
👉 Unemployment: down from 4.4% to 4.3% for YE 2026 = lower unemployment
👉 Inflation:
PCE revised upwards from 2.7% to 3.6% = higher inflation
Core PCE revised upwards from 2.7% to 3.3% for YE 2026 = higher inflation
👉 Fed Funds Rate (FFR): on hold with Kevin Warsh as new Chair with the target range at 3.5% to 3.75% — he held rates steady at both of his meetings so far
revised upwards from 3.375% to 3.750% for YE 2026
2026 rates anticipation = 50% hiking in 2026 with notably, 9 of 18 members anticipate a rate hike in 2026
For 2027 and 2028 outlooks, just check the further nice yellow and red dots.
“How are financial conditions these days, Mav?“
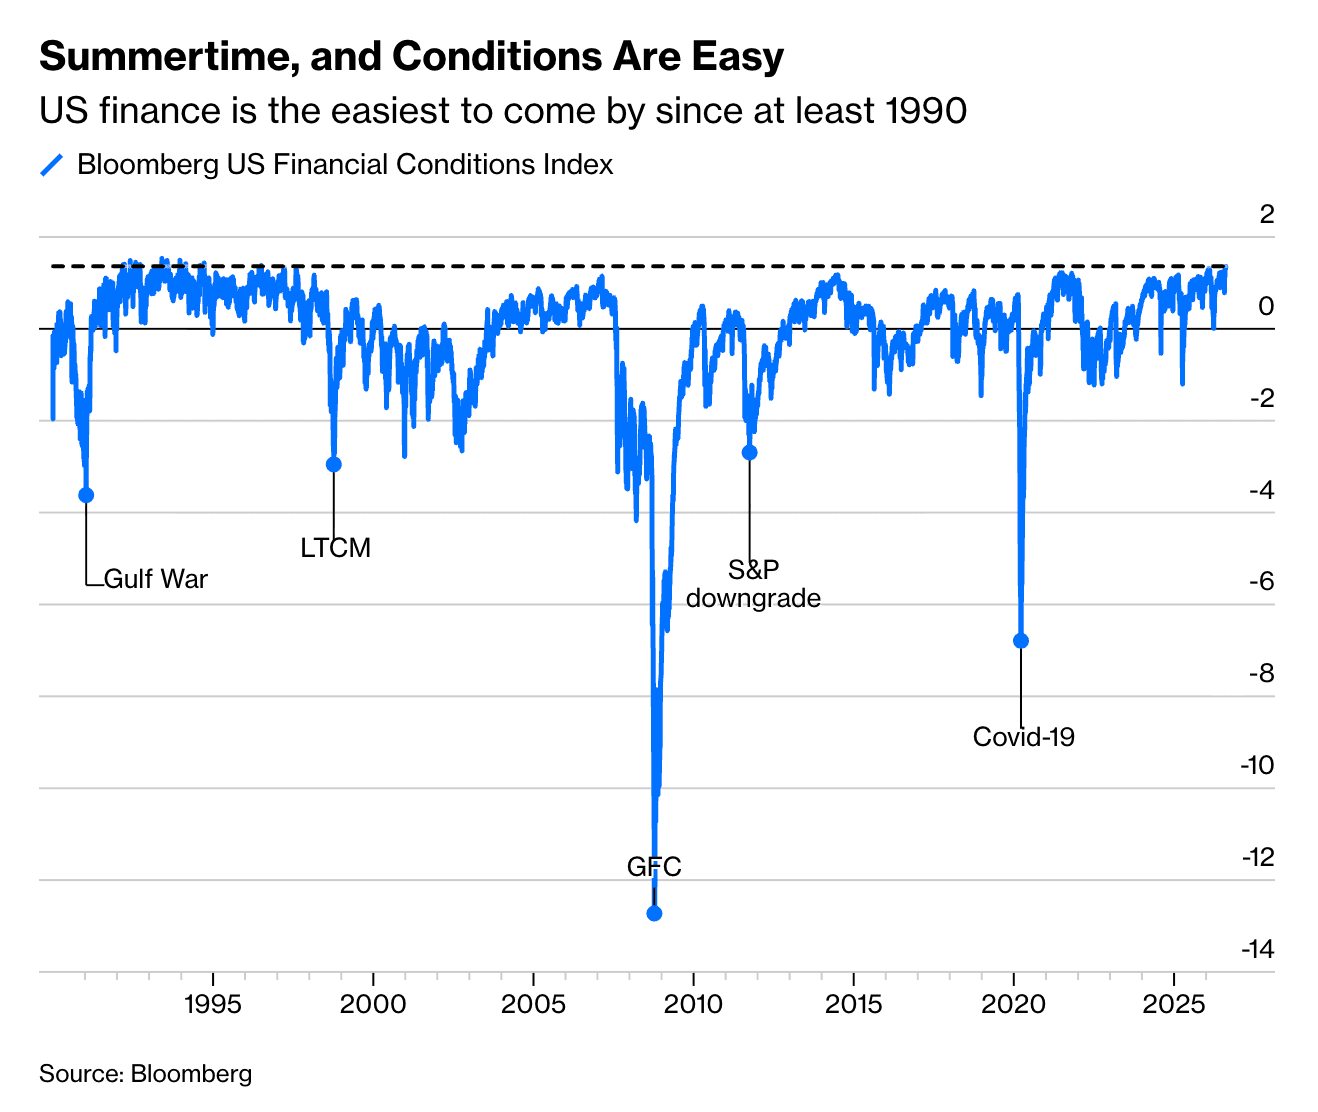
Bloomberg’s Financial Conditions Index:
👉 it has never shown easier conditions since its inception back in 1990
👉 hence, ‘Summertime and Conditions are Easy’ buddy
Going further with a leading view: what about Financial Conditions and their expected contribution to future real GDP growth over the coming year?
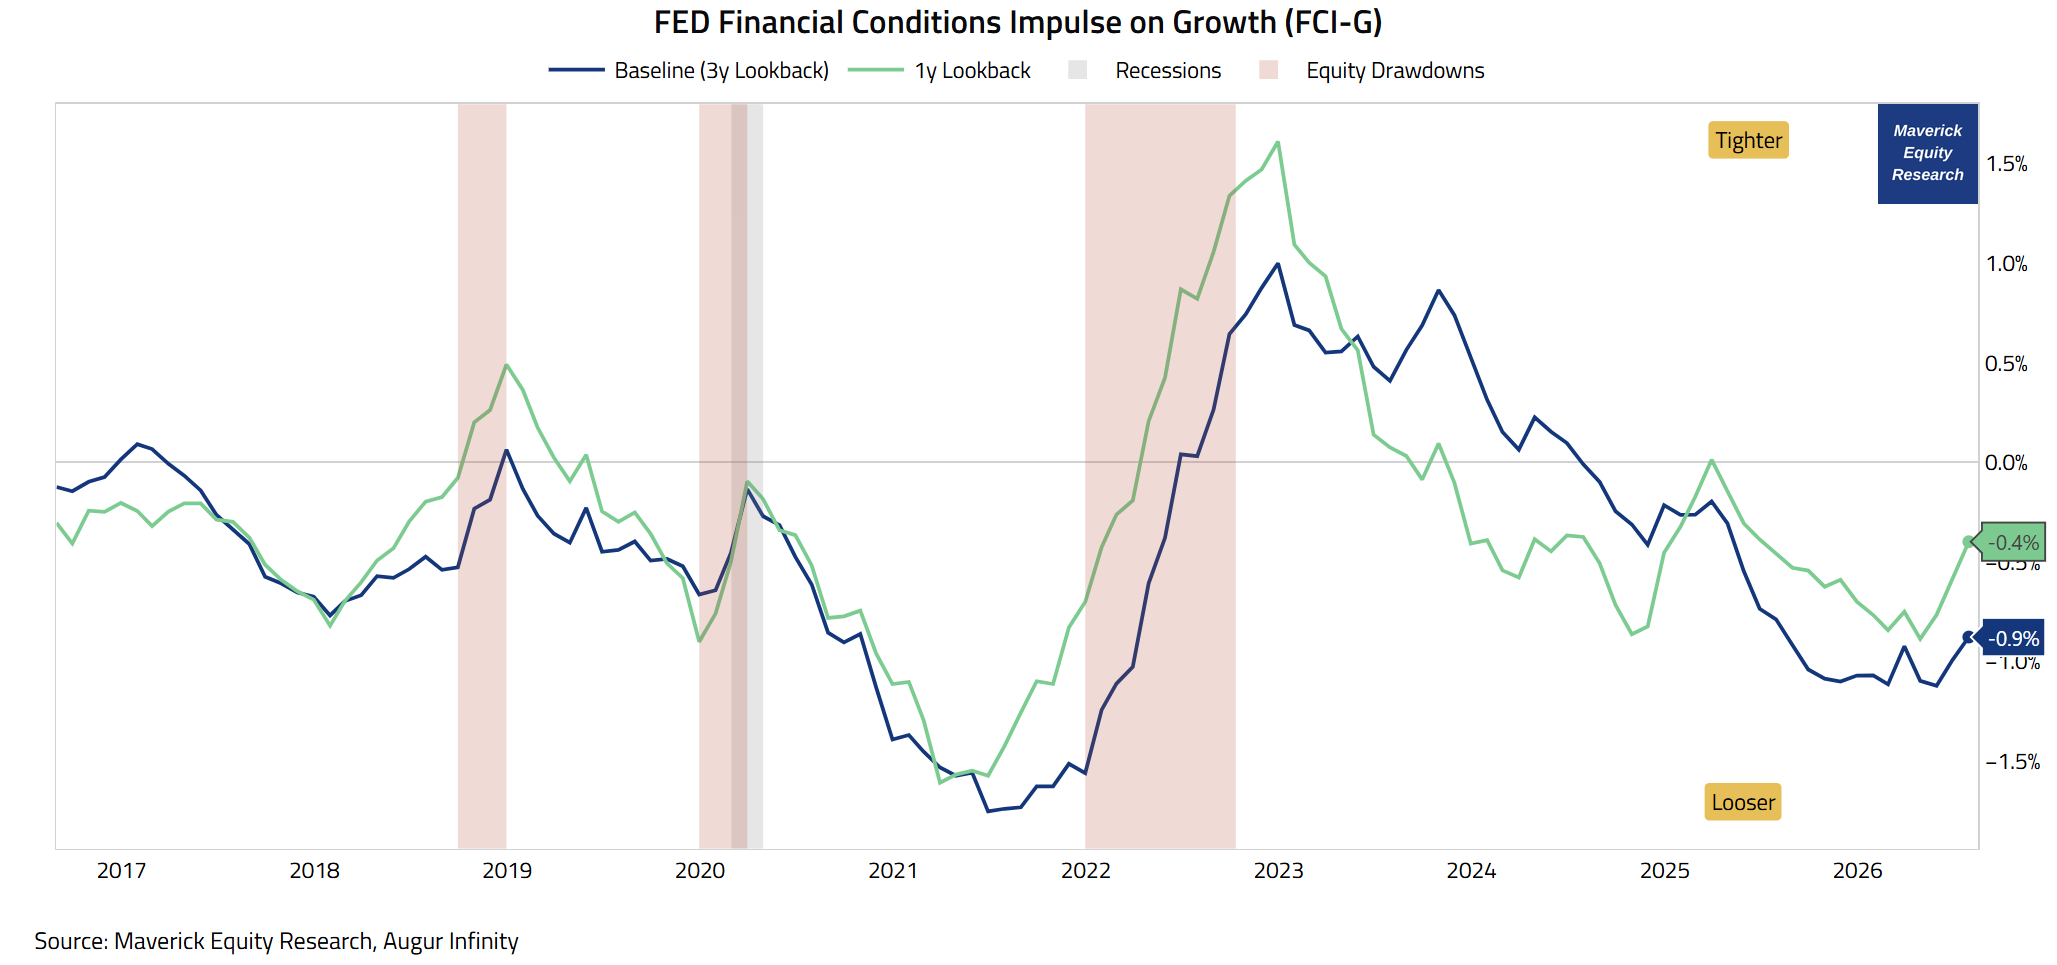
FED Financial Conditions Impulse on Growth (FCI-G):
👉 positive contributions going forward (negative values are good)
👉 both on a 3-year lookback with -0.9%, and on a 1-year lookback with -0.4%
N.B. the 7 Indicators inside this metric: it aggregates changes in the FED Funds Rate, 10-year Treasury yield, 30-year fixed mortgage rate, BBB corporate bond yield, Dow Jones Stock Index, Zillow House Price Index, and the nominal broad dollar index
📊 Bonus: ‘POTUS’ Job Approval Rating 📊
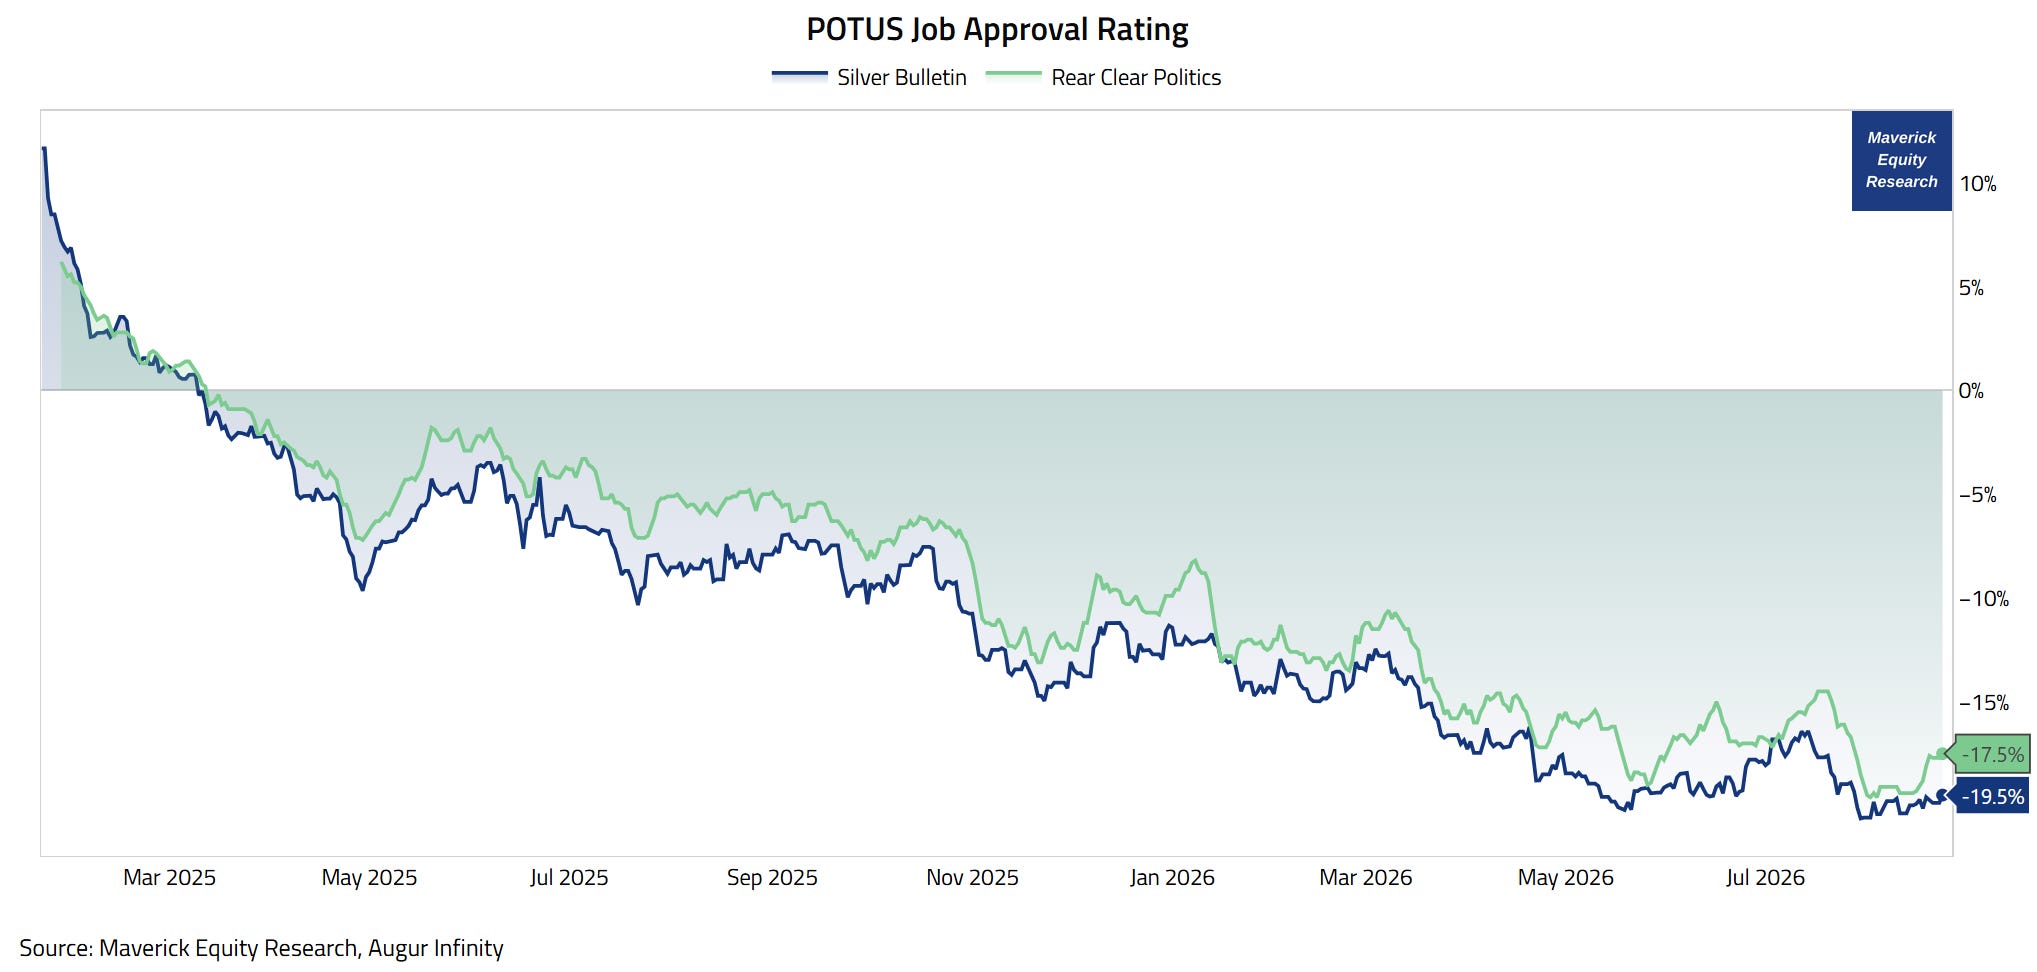
“What is the latest Job Approval Rating for the current ‘POTUS’, Mav?“
👉 Silver Bulletin with a -19.5% drop
👉 RCP with a -17.5% drop
Takeaway:
The economy is doing well (overall), hence imagine if the economy was doing bad how much even bigger of a drop this would have been.
N.B. this is not a pro or against POTUS take:
agnostic politics given independent research, hence apolitical is my A-Game
the key is to know the facts, separate our investing & wallets from (desired) politics, being pragmatic to shape a solid forward outlook, and act accordingly
more on that will be covered in a future dedicated Maverick Special report
P.S. way more on the U.S. Economy via my 2 key deep dives for both Top-Down & Bottom-Up approaches, in essence connecting the mighty Macro-Finance bridge:
✍️ The State of the U.S. Economy in 75 Charts = A Deep Dive! ✍️
The report breaks down the U.S. economy and ultimately aims to answer two of the biggest questions in Finance and Economics:
“How are the Fundamentals of the U.S. Economy?“
“What is the Ongoing Probability of a Recession?”
✍️ Decoding the U.S. Economy in Real-Time
Through Sleek High Frequency & Alternative Data ✍️
decoding the U.S. Economy by looking way beyond the traditional economic metrics, namely, through the lens of real-time, high frequency & alternative data!
in essence, a ‘live’ view on the state of the U.S. Economy, and quite a unique report which you do not see elsewhere!
a sharper and timely way to understand the macro forces shaping investing and overall financial markets!
Maverick Charts 62th edition done, 5 key charts with many insights + 1 Bonus!
You can check all the previous 61 editions in the Maverick Charts section!
Mission accomplished for me if the following resonates with you:
‘Hmm I never thought it that way’, ‘now that chart said a whole lot’, ‘now that chart was really interesting’, ‘now that is something new’, ‘now I got it!’, ‘you managed to turn something complex into something actually simple’
hence, if you got to see something differently, my approach gave you a different angle, it did help you connect your key dots, then we all do well here!
Research is NOT behind a paywall and NO pesky ads here unlike most other places!
Did you enjoy this by finding it interesting, saving you time and getting valuable insights? What would be appreciated?
Just sharing this around with like-minded people, and hitting the 🔄 & ❤️ buttons!
That’ll definitely support bringing in more & more independent investment research: from a single individual … not a corporate, bank, fund, click-baity media or so … !
Like this, the big positive externalities become the name of the game! Thank you!
Sharing = 3x win: you + your close ones + me!
Have a great day! And never forget, keep compounding: family, friends, community, capital, knowledge, research and mindset!
With respect,
Mav 👋 🤝
“Compound interest is both the ultimate and biggest natural hedge!”
Maverick Equity Research