
✍️ U.S. GDP, Housing, FED Watchers, Swiss Interest Rates, Most Innovative Countries = Maverick Macro Charts of the Week #45
10 Maverick Charts that say 10,000 words

Dear all,
10 cherry picked Maverick Charts of the week say 10,000 words or more = the ‘How’!
Table of contents = the ‘What’ with the aim for a high density of ideas because the best respect the reader’s time:
📊 Maverick Charts: U.S. Q3 GDP, FED Watchers, U.S. Housing, Switzerland Interest Rates, GDP/Capita & Life Satisfaction, Most Innovative Countries
📊 Bonus: Gold special
Objective: both data-driven insights + valuable food for thought = the ‘Why’!
📊 Maverick Charts: U.S. Q3 GDP, FED Watchers, U.S. Housing, Switzerland Interest Rates, GDP/Capita & Life Satisfaction, Most Innovative Countries 📊
U.S. economy: +3.9% real GDP estimate for the 3rd quarter via Atlanta FED
👉 way above the range of the top 10 and bottom 10 average forecasts
👉 the U.S. economy has been surprising many especially coming out of 2020 Covid
👉 so many for years on and on fear mongering saying ‘it is all over’, ‘the economy is collapsing’ - idk about you, but for me for an economy to collapse, it first has to slow down - and actually an economy never collapses, at maximum it strongly contracts and then recovers = Business Cycle 101 = Economics 101
👉 for now NO slowing down + recall also Buffett saying “Never Bet Against America“
👉 it is very hard to bet against the U.S. consumer, though this is in the same time a place where a key nuance is to be found, namely the K-shaped economy … I will cover that Special topic via the next improved edition of the U.S. Economy coverage:
✍️ The State of the U.S. Economy in 75 Charts, Edition #4

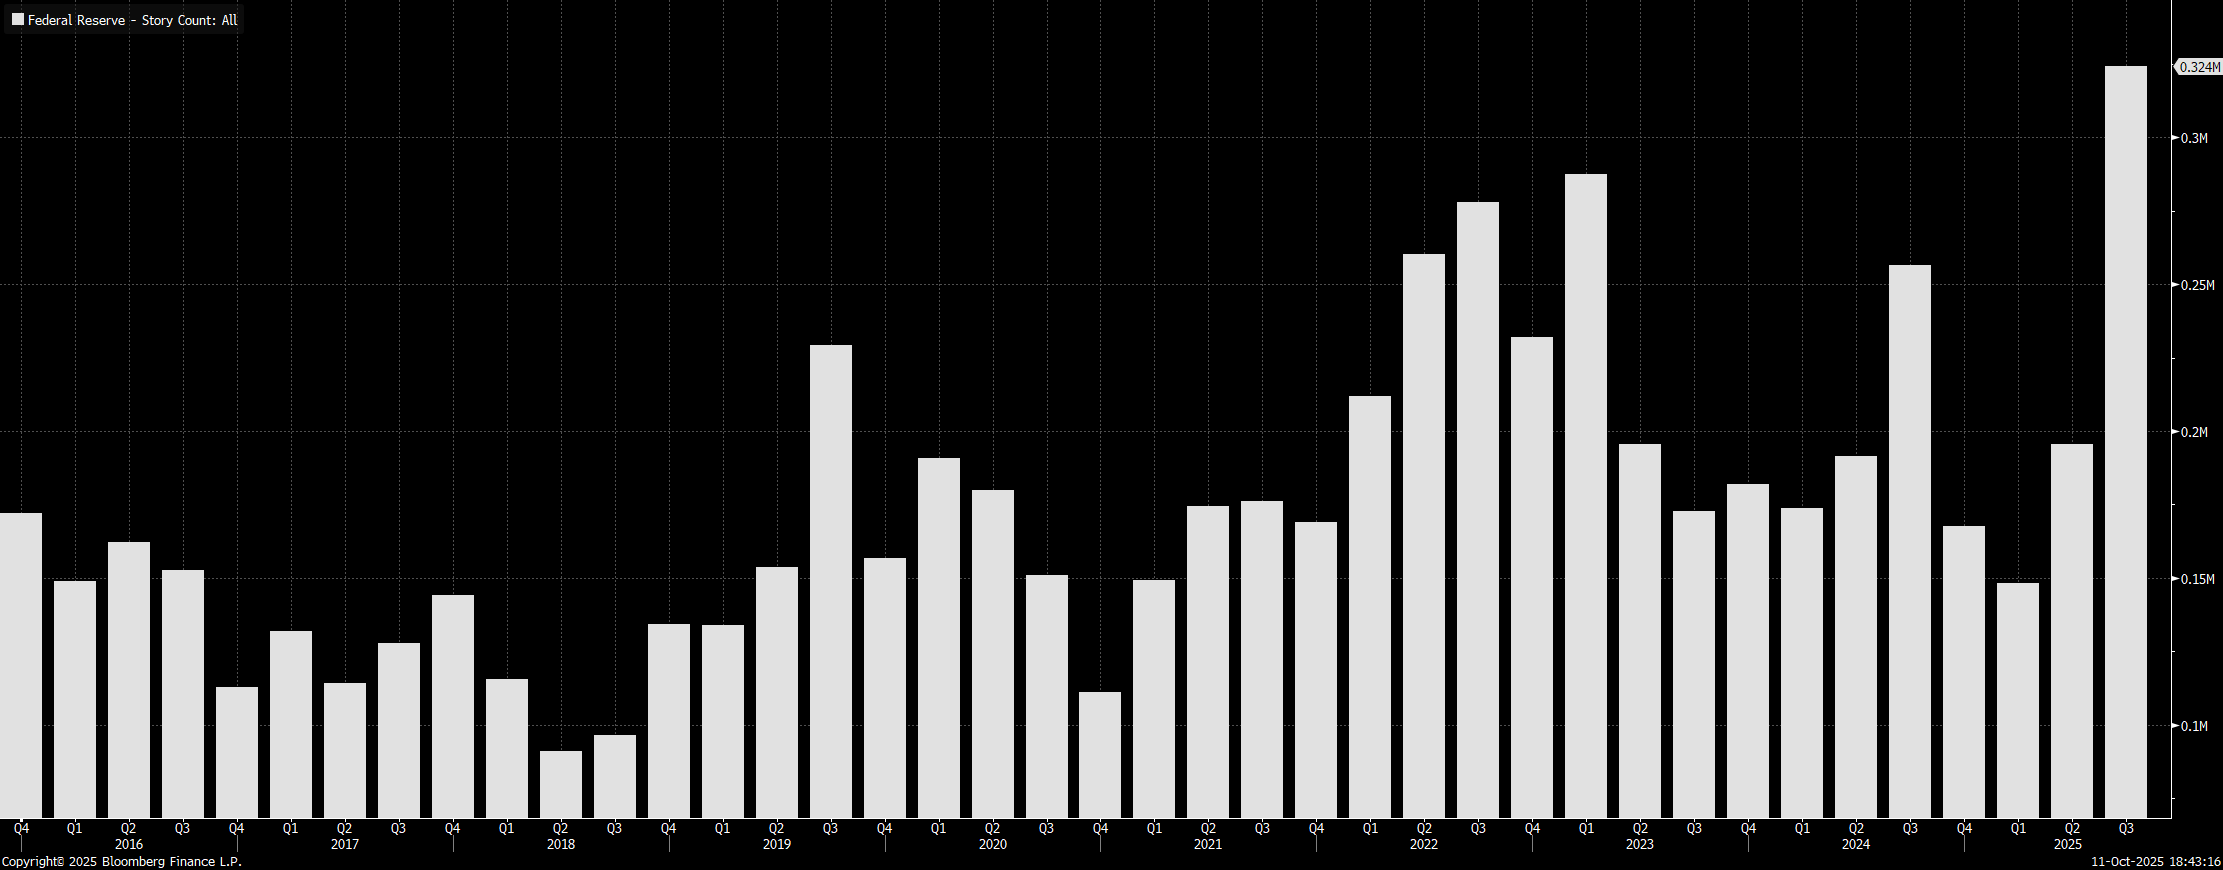
“There are too many FED watchers, and in general central banks pundits“ what I heard at a conference from one top Swiss National Bank economist, and I fully agree:
👉 chart = ‘Federal Reserve’ story count aka chatter which has gone parabolic in Q3
👉 too many obsessed & fixated on every move the FED might make, can, should & will make, yet for the vast majority of investors it is a lot of wasted time spent - why?
👉 well, simple, let’s get practical and pragmatic:
how many investors can estimate better the neutral interest rate?
how many can forecast better future interest rates? I believe top investors of the world, from Buffett, Lynch to Druckenmiller to your favourite one, they very likely do NOT know interest rates better than the FED
Maverick’s takeaway:
👉 naturally, they do look at interest rates, I do look at it as we compare and analyse investment opportunities, hence also form an outlook for the short and long term: interest rates are very important for valuation (cost of capital, hurdle rate, financing and more), and one day I will make a Maverick Special report which will outline the top 5 key & useful data points & charts one needs to know about the FED and interest rates/yields at any given point in time
👉 the rest of the precious time can be spent on what matters, time is precious, right?
✍️ Maverick Special: The Top 5 Charts You Need to Know About the FED and Interest Rates
Talking, debating about the FED and interest is all good, my key point is just that in order to claim one knows better what the FED should do, saying they are wrong, it should take quite some solid and specific expertise (Monetary Economics) and proofs:
👉 the reality is most believing they know better than the FED, via the Dunning Kruger effect are still in the ‘I know everything’ camp which = ultra low knowledge
👉 to anticipate, to have a view what the FED will likely or most likely do is one thing, to say what they should do or that they are wrong, it is totally another thing: beware of the folks making those big claims
👉 hence, from my side you will never see ‘The FED is Wrong’ or ‘FED Just Made a Policy Mistake’, but coverage with the pricing, expectations and likely next move, yes!

P.S. Dunning Kruger effect general key note: once one is even in the ‘Trust me. It’s complicated’ part of the curve (the best one), in terms of confidence it will be still LOWER than when in the ‘I know everything’ camp - one will never ever be more confident than then = both quite a funny and healthy paradox, isn’t it? 😉
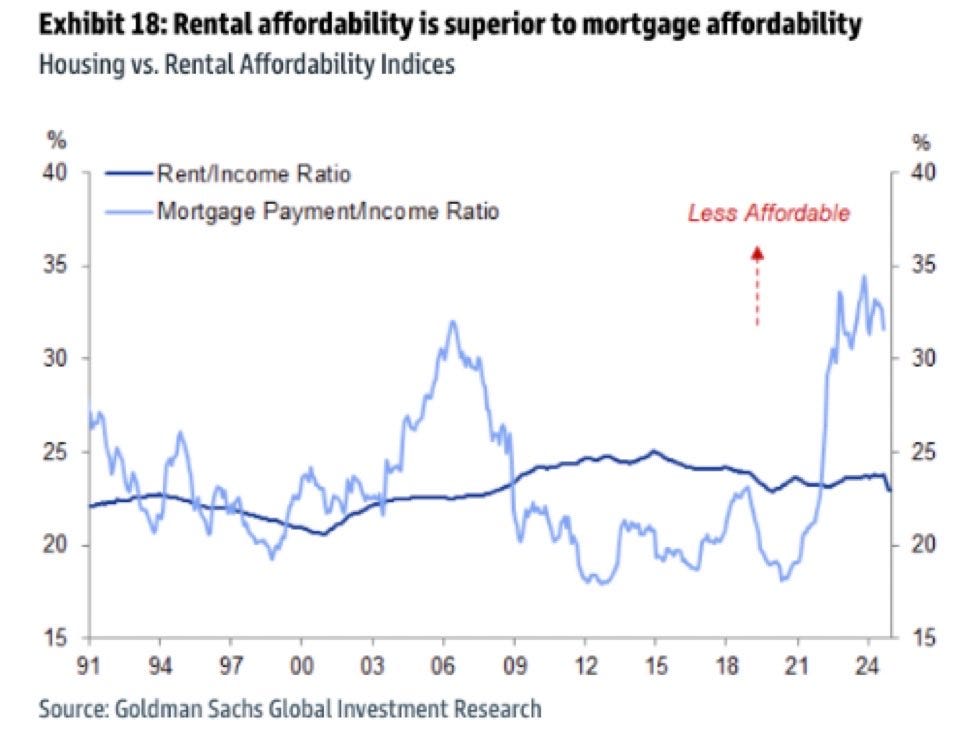
U.S. Housing - Renting vs Buying, the affordability lens:
👉 rental more affordable (Rent/Income ratio), housing (Mortgage/Income ratio) less
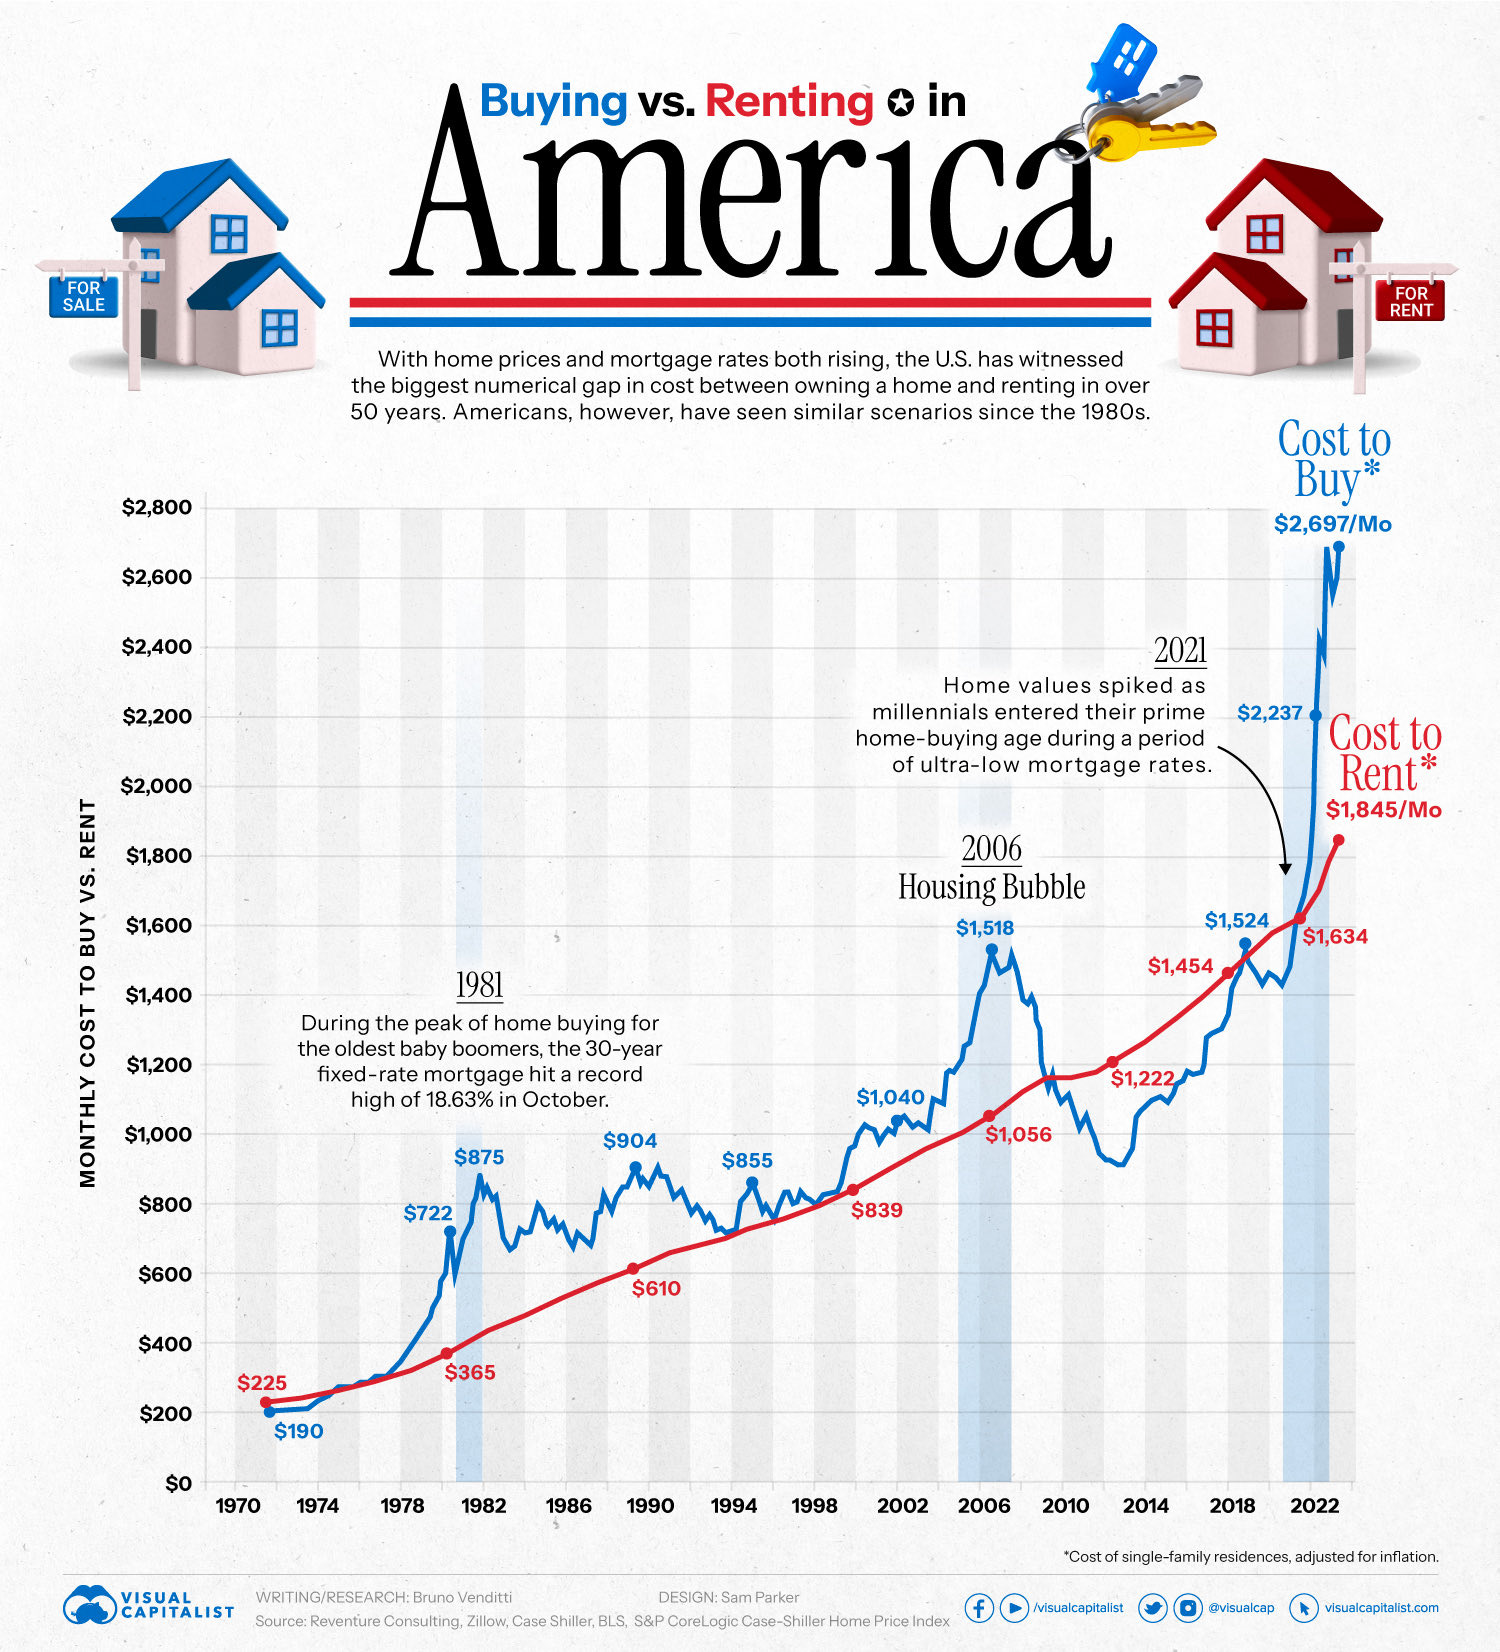
A complementary more simple view (a bit lagged data, will update it in the future):
👉 cost to rent = $1,845/month
👉 cost to buy = $2,697/month
I’ll cover also Housing/Real Estate via the next improved edition of the U.S. Economy:
✍️ The State of the U.S. Economy in 75 Charts, Edition #4
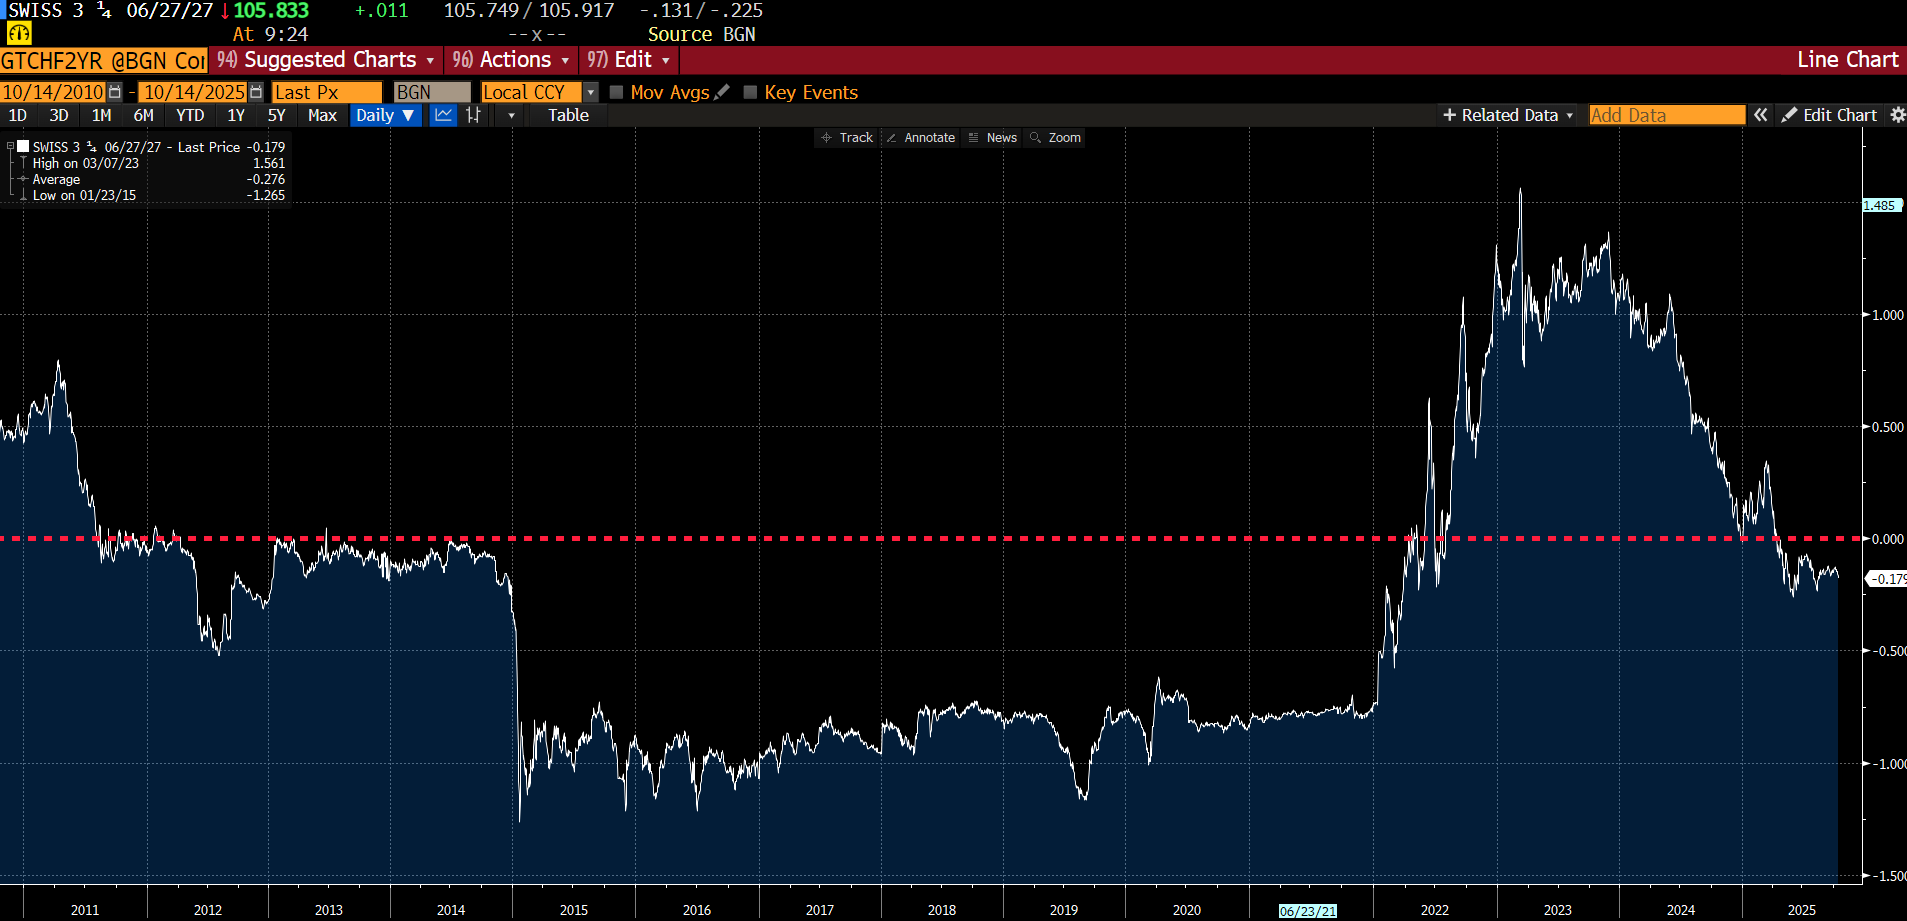
Switzerland & interest rates, a bit like a forced marriage 😉:
👉 the general belief was that we will never see again negative interest rates there
👉 well, there you go: “Hold my Beer” …
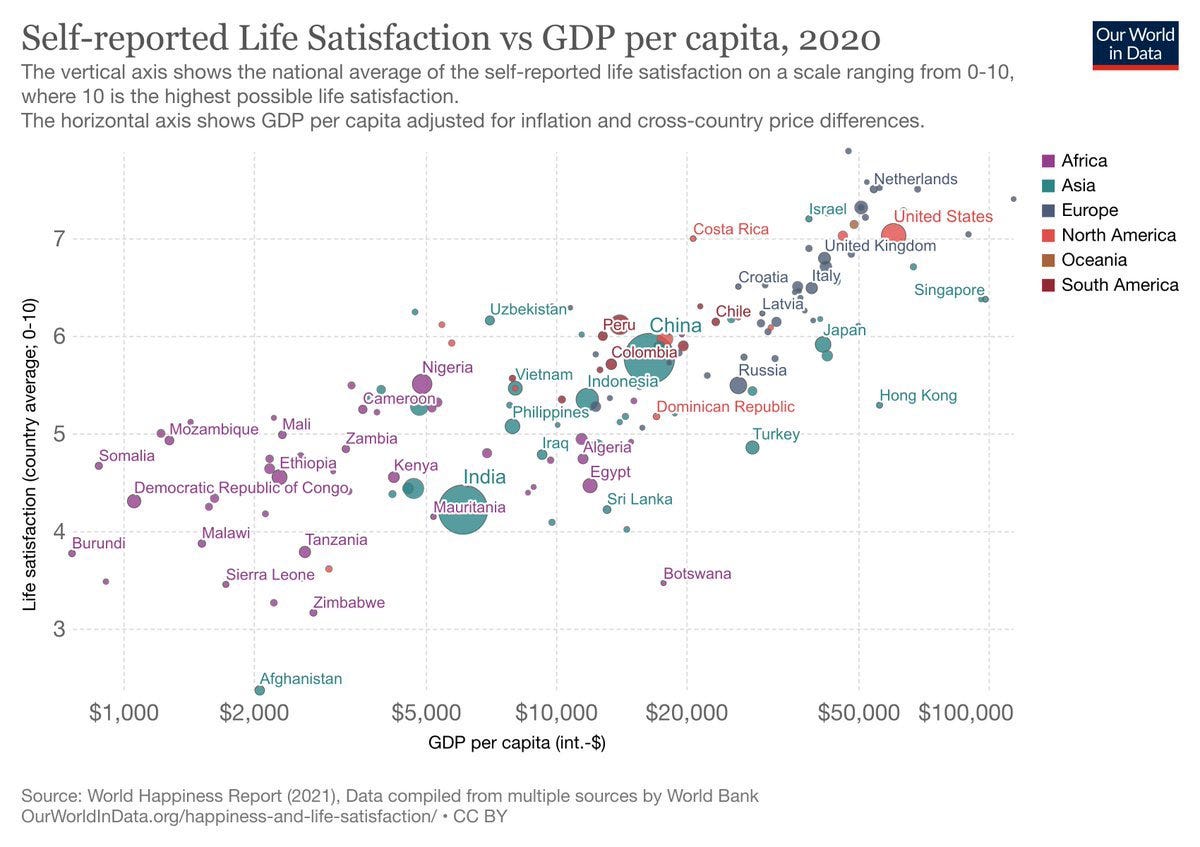
GDP/capita (adjusted for inflation) and self-reported Life Satisfaction:
👉 every time I mention GDP/Capita and happiness/prosperity/well-being, very fast people tell me it is NOT a good measure to track the above
👉 then I show this chart and simply ask: would one on average or all else equal prefer to live in the bottom left or top right?
👉 the vertical axis is self reported life satisfaction … so yes, GDP/Capita does matter and quite a factor … not a perfect measure, but hey, what is perfect?
👉 then sometimes I also ask: ‘do you have a better measure as criticising imperfect measures/methodologies is also not a good measure/approach?’ - vast majority of times no answer back, but silence hmmm …
👉 personally, I was born in 1986 in a country where the GPD/Capita was $2,400 - then I moved, worked in lived in 7 other countries and 2 continents, and can confidently say that GDP/Capita is a decent overall metric
P.S. now how that GDP (‘the pie’) is actually distributed, wealth concentration, taxation etc … that is another topic and way deeper analysis … one which will also be covered via a Maverick Special research … stay tuned!
✍️ Inequality, Wealth Concentration, Taxation, Equity and More
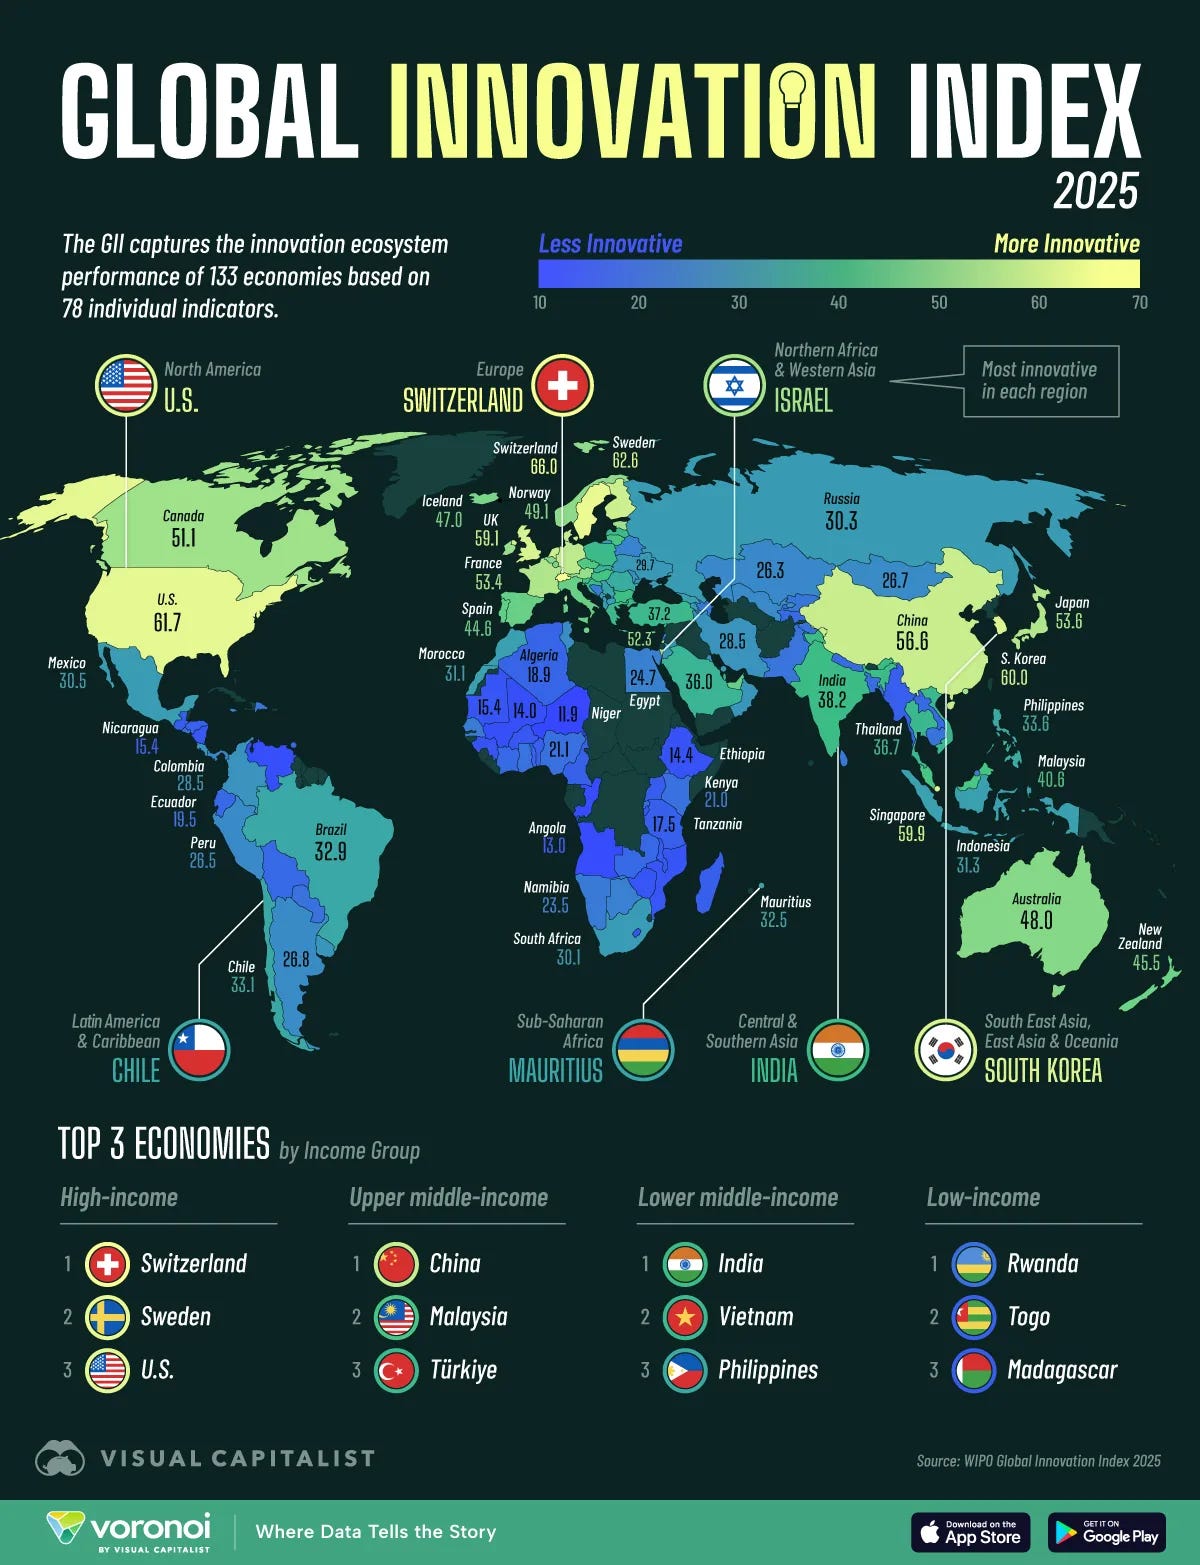
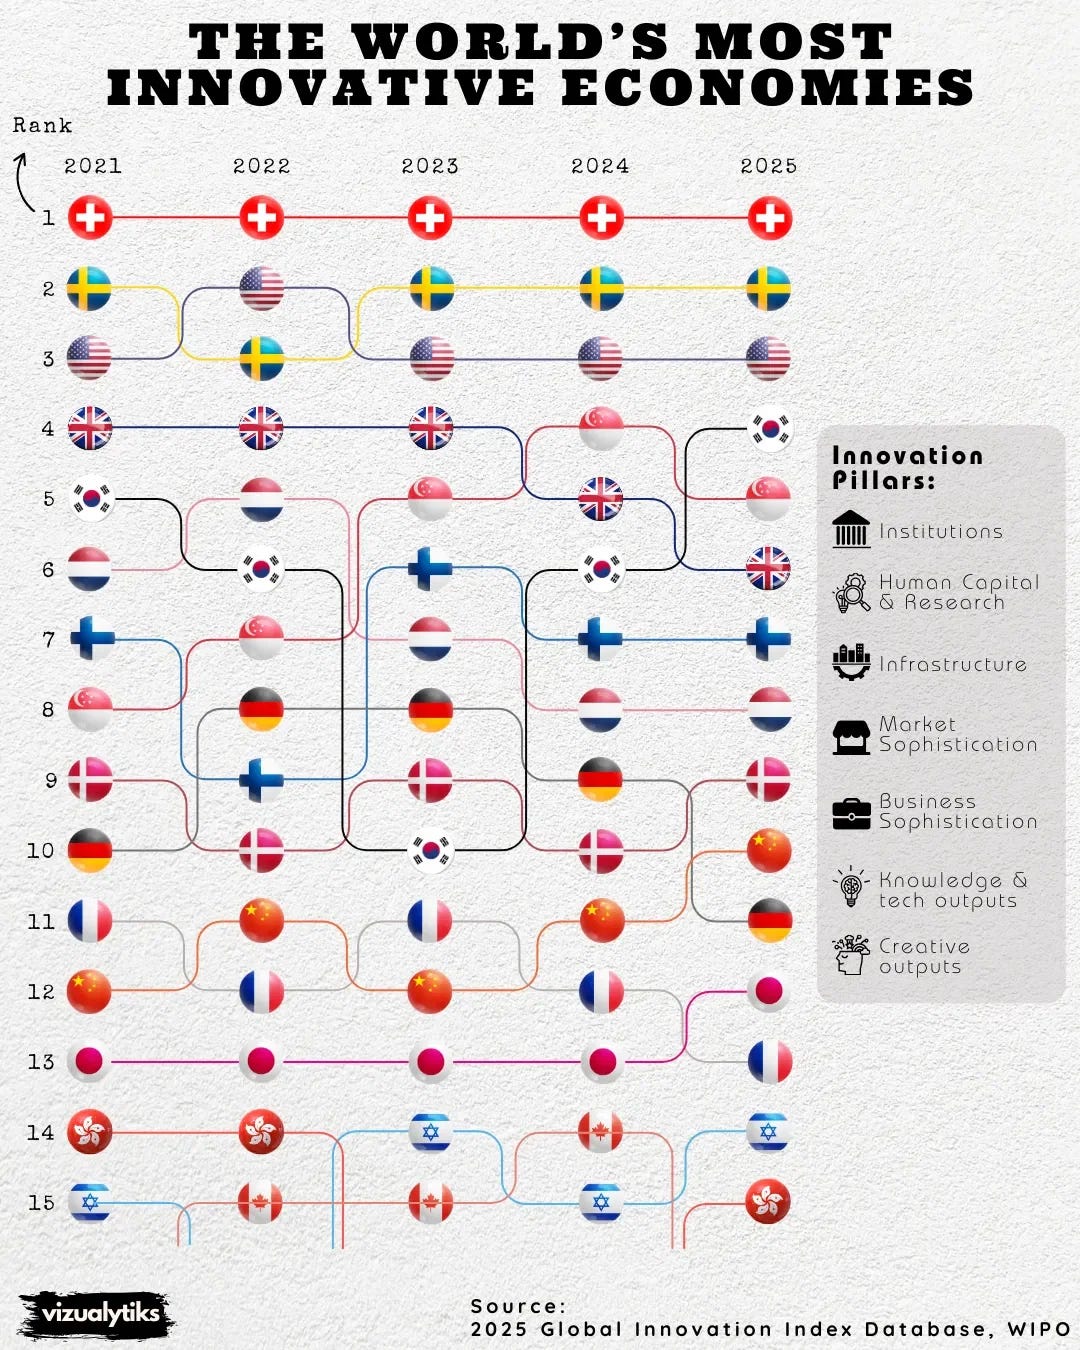
The World’s Most Innovative Countries in 2025 measured by key innovation pillars - ranking overall and by income group since 2021:
👉 Switzerland = number 1 (I will cover in 2026 the Swiss economy also)
👉 Sweden = number 2
👉 USA = number 3
👉 China has entered the GII’s top 10 for the first time, while South Korea climbed to fourth (its highest position to date)
📊 Bonus: Gold special 📊
How many fund managers do NOT own ANY gold at all?
👉 a whopping 39%, hence they’ve missed out on the bull market ...
👉 what if they jump on the bandwagon?

U.S. retail investors are heavy buyers of gold-backed ETFs:
👉 the liquidity train has arrived ...

Central Banks now hold more gold than U.S. treasuries: the 1st time since 1996!

Maverick Charts 40th edition done, 10 key charts with many insights!
You can check all the previous 39 editions in the Maverick Charts section!
Mission accomplished for me if the following resonates with you:
‘Hmm I never thought it that way’, ‘now that chart said a whole lot’, ‘now that chart was really interesting’, ‘now that is something new’, ‘now I got it!’, ‘you managed to turn something complex into something actually simple’
hence, if you got to see something differently, my approach gave you a different angle, it did help you connect your key dots, then here we all do well
Research is NOT behind a paywall and NO pesky ads here unlike most other places!
Did you enjoy this by finding it interesting, saving you time and getting valuable insights? What would be appreciated?
Just sharing this around with like-minded people, and hitting the 🔄 & ❤️ buttons!
That’ll definitely support bringing in more & more independent investment research: from a single individual … not a corporate, bank, fund, click-baity media or so … !
Like this, the big positive externalities become the name of the game! Thank you!
Have a great day! And never forget, keep compounding: family, friends, hobbies, community, work, independence, capital, knowledge, research and mindset!
With respect,
Mav 👋 🤝

GNI could be a better measure for the "self-satisfaction",you know what I am saying. Like Japan