
✍️ U.S. Real GDP Growth, Economic Policy Uncertainty & Spreads + Tracking AI’s Contribution to GDP Growth = Maverick Macro Charts of the Week #55
10 Maverick Charts that say 10,000 words

Dear all,
10 cherry picked Maverick Charts of the week say 10,000 words or more = the ‘How’!
Table of contents = the ‘What’! Executed in a succinct manner with the aim of a high density of ideas, because the best writing respects the reader’s time:
📊 Maverick Charts: U.S. Real GDP growth, Economic Policy Uncertainty & Spreads
📊 Bonus: Tracking AI’s Contribution to GDP Growth
Objective: both data-driven insights + valuable food for thought = the ‘Why’!
📊 Maverick Charts: U.S. Real GDP growth, Economic Policy Uncertainty & Spreads
1-3) U.S. Real GDP growth via Atlanta FED + New York FED latest nowcast models:
👉 +4.2% in Q4 2025 via the Atlanta FED (chart 1), way above the 0.9% consensus
👉 +2.74% in Q4 2025 via the New York FED model (chart 2)
👉 +2.73% in Q1 2026 via the New York FED model (chart 3)
Overall, very good readings in my opinion.
Key note — New York FED nowcast model is superior to the Atlanta FED one:
NY FED measures the broad strength of the economy, it smoothest noise for trend insights, hence suiting macro strength assessment
Altanta FED is more accounting based, and reacts more sharply to individual releases, hence suiting more precise mechanics


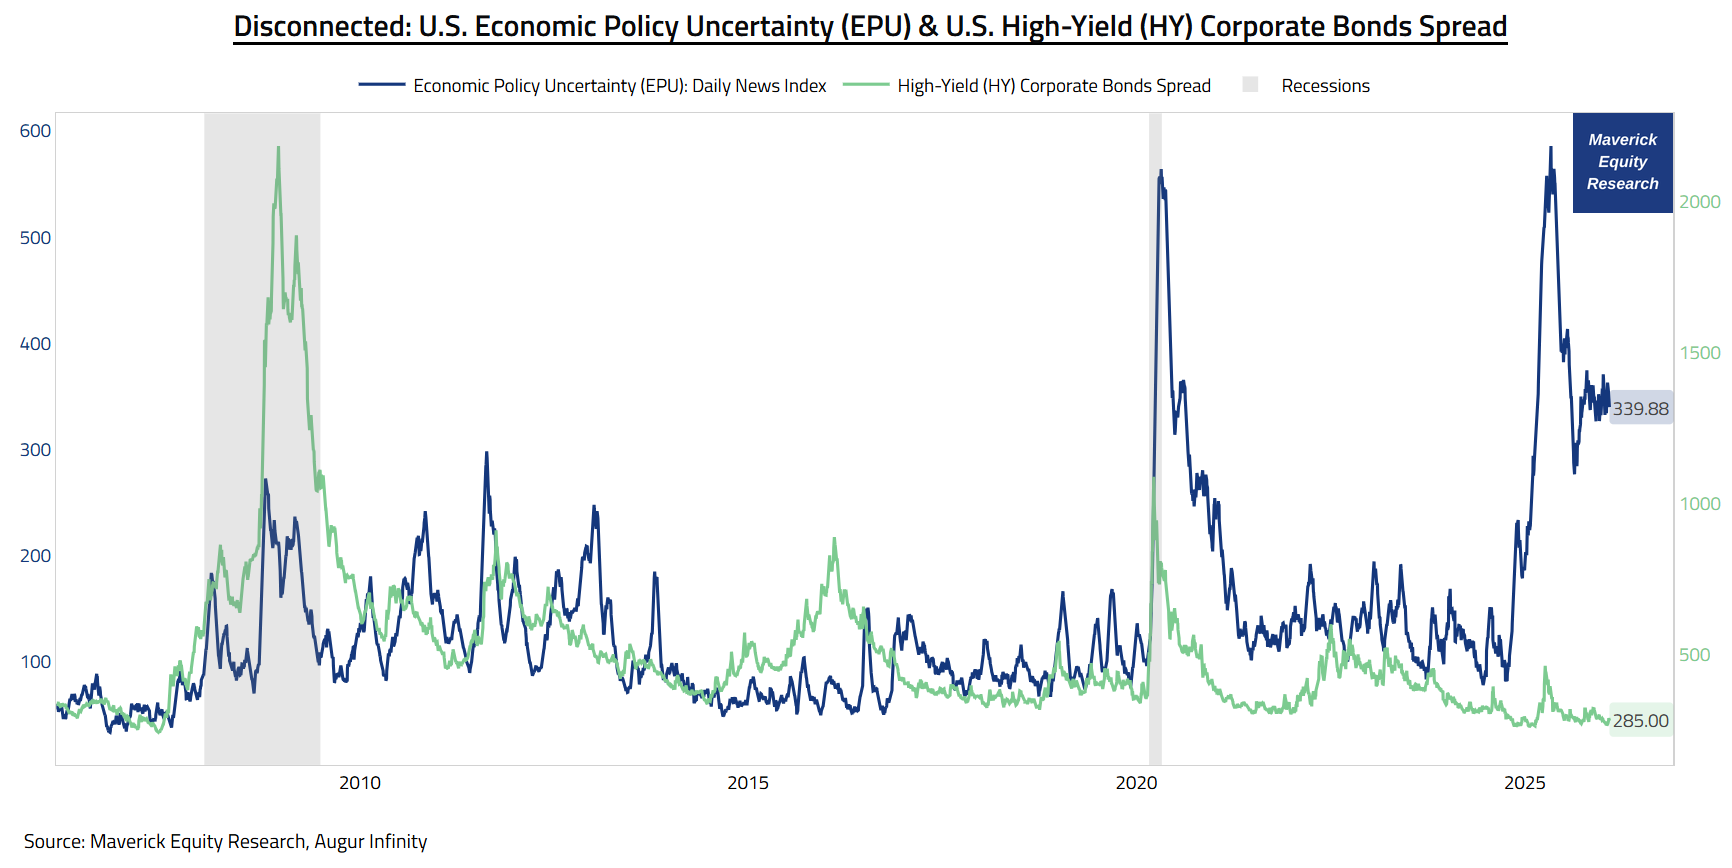
Economic Policy Uncertainty = Improving (EPU vs Spreads)
Chart = U.S. Economic Policy Uncertainty (EPU, blue) & U.S. Investment Grade (IG) Corporate Bonds Spread (green), Recessions (grey) = highlights a historical correlation between economic policy uncertainty and bond spreads, with synchronized peaks during financial crises and volatile periods
👉 they are disconnected, and as I was mentioning often last year, in particular in April 2025 during the Trade War 2.0:
things are still good, definitely no need to panic, geopolitical risk premium is actually to be harvested also this time around, and so it happened
as long as ‘the green line’ (aka spreads) do not move wildly, things are fine
👉 from a peak of 568, EPU is way cooler now at 339 — spreads at a ultra 74 b.p. low
👉 Policy Uncertainty ≠ Policy Outcome (more likely = quite a circus or silly show)
In case you missed that key research at that key time, one that was inviting for calm and coolness, instead of chaos driven by spooky headlines, there you go:
✍️ Disconnected - Economic Policy Uncertainty & Corporate Bonds Spread (IG & HY)

Complementary, the same chart but with the more sensitive and responsive to all economic conditions, the U.S. High Yield (HY) Corporate Bonds Spread:
👉 at 285 b.p., naturally a bigger spread, but the same behaviour and message
Way more via my U.S. economy deep dive for both Top-down & Bottom-up approaches, essentially connecting the Macro-Finance bridge also:
✍️ The State of the U.S. Economy in 75 Charts
The report breaks down the U.S. economy and ultimately aims to answer two of the biggest questions in Finance and Economics:
“What is the State of the U.S. Economy?“
“What is the Probability of a Recession?”
📊 Bonus: Tracking AI’s Contribution to GDP Growth 📊
AI is the new kind in town, yet how about checking its contribution to GDP growth?
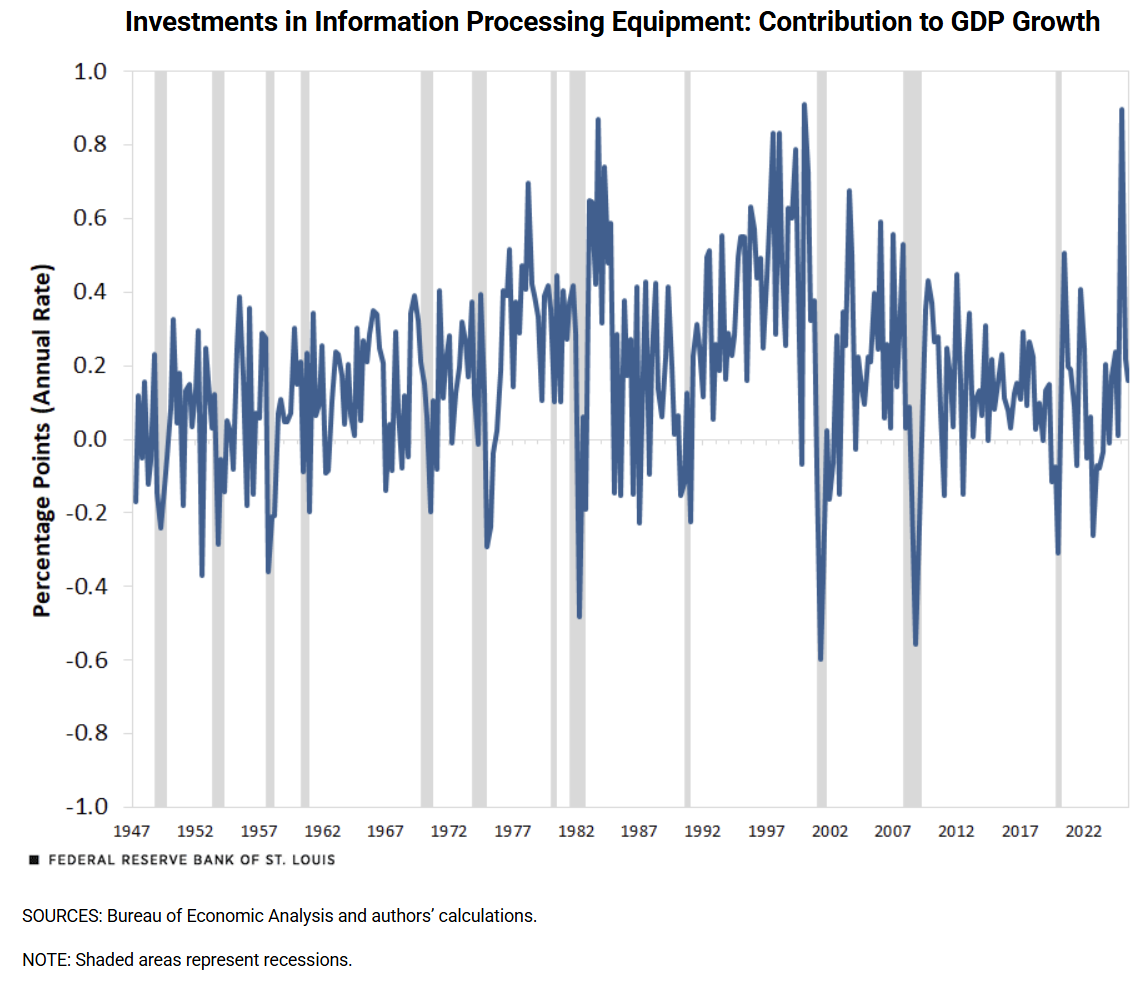
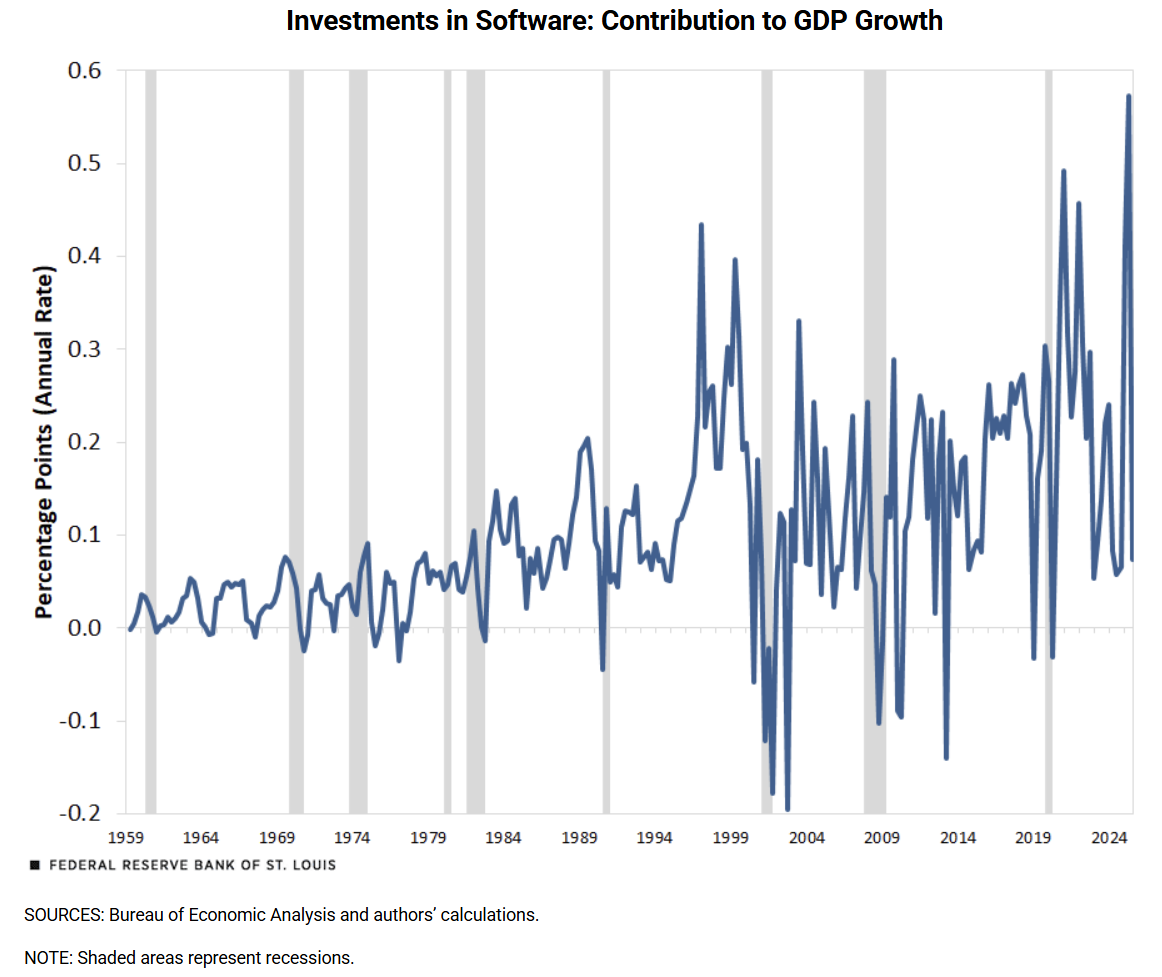
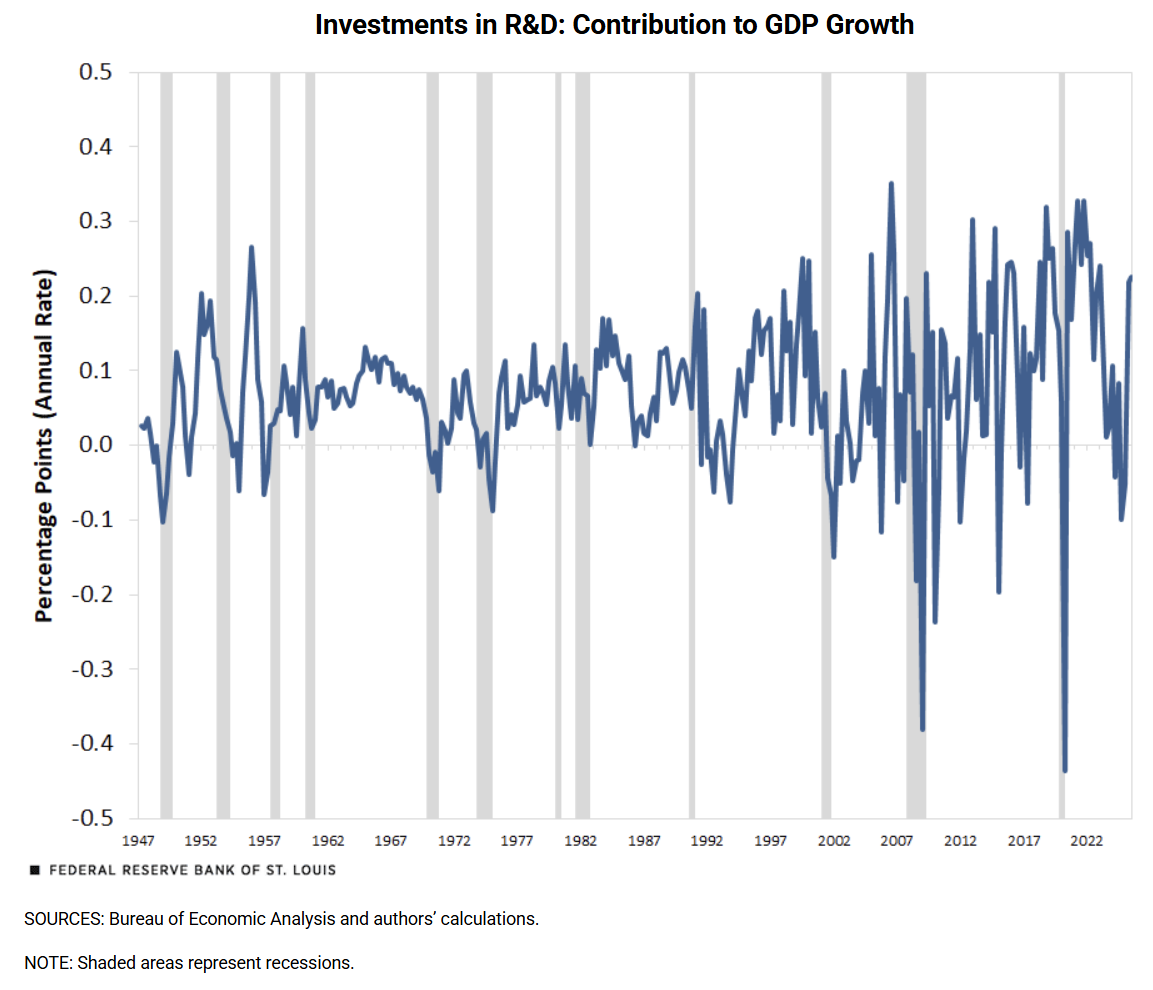
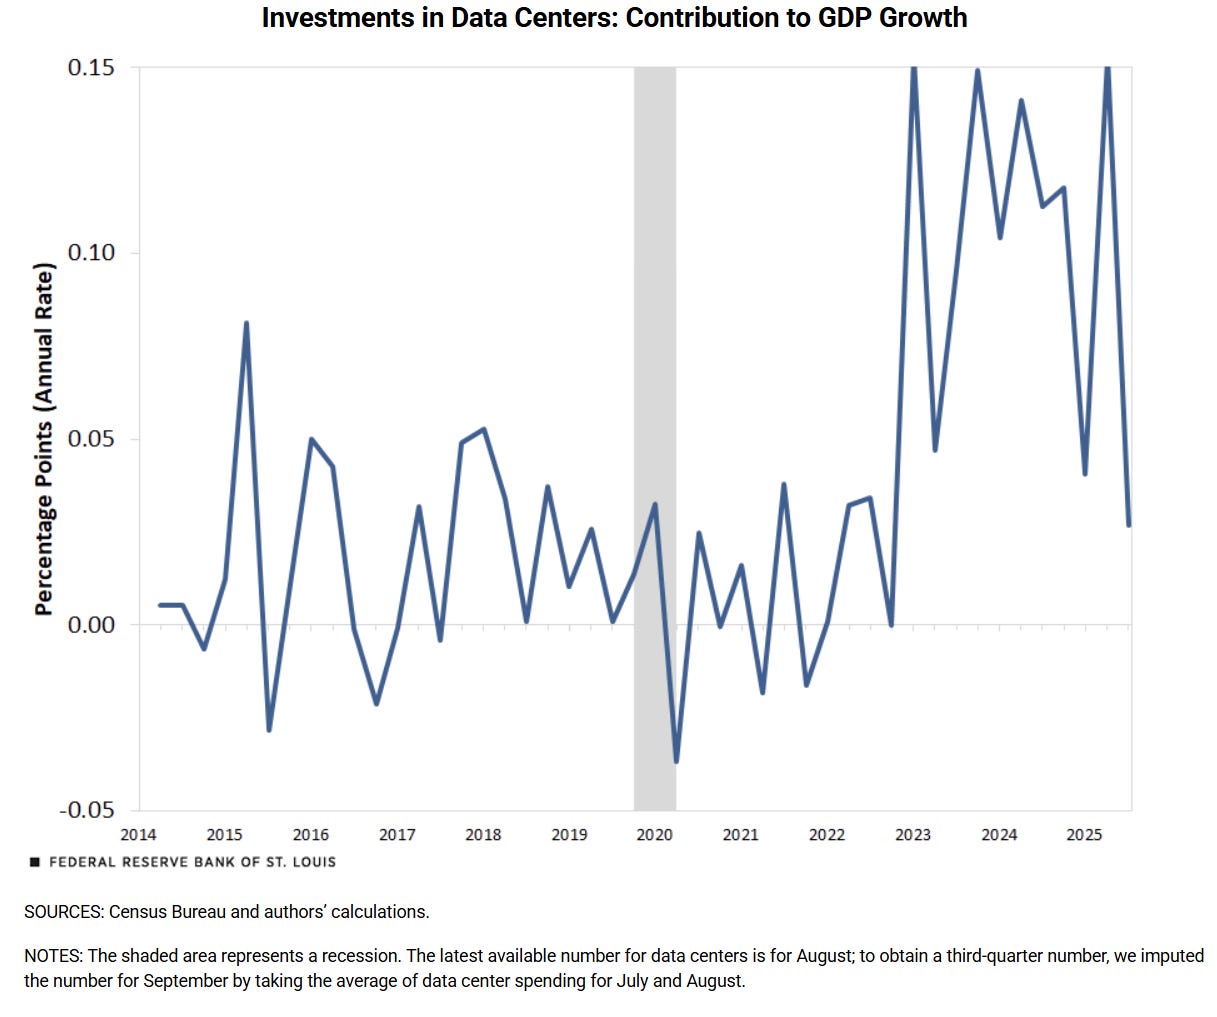
1-4. Four key Charts via St. Louis FED showing how the major AI-related investment categories have contributed to real GDP growth over time:
1) Investments in Information Processing Equipment (chart 1) +
2) Investments in Software (chart 2) +
3) Investments in R&D (chart 3) +
4) Investments in Data Centers (chart 4)
= combined AI categories contributed 0.97% to real GDP growth in the first three quarters of 2025 = these categories made up 39% of total GDP growth (vs 28% in 2000)
👉 has surpassed the contribution of IT components made during the dot-com boom, both in levels and as a share of GDP
👉 firms continue integrating AI into their operations and building the infrastructure required to support it, these categories are likely to remain significant drivers of investment well into 2026 and beyond
Complementary, what about AI & Productivity?
Connecting the AI thematic with the Real Economy via a historical chart from 1894 on the U.S. business sector labor productivity:
👉 early industry gains drove the largest productivity booms ...
👉 current productivity (the base) is still pretty low ... way more to come …
👉 hence, is AI the next productivity train everybody embarks on? Food for thought …
👉 will there be job displacements? yes, just like before — will it be more and pose big societal social issues? That is to be covered in the future via Special reports!

One of my next Maverick Special research reports covers the big AI question:
✍️ Is AI in Bubbly Territory? Maverick Special #10
As well, on the AI CAPEX big cycle we are having currently I am working on 2 Maverick proprietary indicators/indices that would capture the 2 key aspects:
✍️ AI ROI on CAPEX (a quantitative objective gauge)
✍️ AI Sentiment (a qualitative, mood gauge)
Sentiment is very high and investments have gone parabolic in the AI space, hence:
a rigorous oversight of capital conversion efficiency is necessary to gauge the AI ecosystem’s capacity for sustained growth and ability to translate all that into corporate financial returns
similarly, for the overall economy, it’s growth and potential going forward
Both the qualitative and quantitative gauges are essential to map the current trend and cycle position, allowing us to forecast the eventual stabilization, subsequent market correction (shakeout), and the identification of long-term sustainable winners.
Maverick Charts 55th edition done, 5 key charts with many insights + 5 Bonus!
You can check all the previous 54 editions in the Maverick Charts section!
Mission accomplished for me if the following resonates with you:
‘Hmm I never thought it that way’, ‘now that chart said a whole lot’, ‘now that chart was really interesting’, ‘now that is something new’, ‘now I got it!’, ‘you managed to turn something complex into something actually simple’
hence, if you got to see something differently, my approach gave you a different angle, it did help you connect your key dots, then here we all do well!
Research is NOT behind a paywall and NO pesky ads here unlike most other places!
Did you enjoy this finding it interesting, saving you time and with valuable insights?
If yes, you can support Independent Investment and Economic Research with a Realist-Optimist mindset via the following 3 options:
‘Buy me a Book, Coffee or Data’ which are the tools through which the research is done and delivered straight to your inbox!
PayPal, the classic donation/tip option:
Pledge for a future Premium Research subscription, to be specific introducing “I-RAAS” = Independent Research As A Service
you will be informed in advance both when the Premium Offering will go live, and what it will consists of along its cadence & structure + you can cancel anytime
best part = you will get the best introductory pricing, it will never be cheaper
That’ll definitely support bringing both the current + future ‘Maverick-esque’ research: from a single individual … not a corporate, bank, fund, click-baity media or so … !
Like this, big positive externalities become the name of the game, and we all benefit!
Have a great day! And never forget, keep compounding: family, friends, hobbies, community, work, independence, capital, knowledge, research and mindset!
With respect,
Your Maverick 👋 🤝

P.S. sharing around with like-minded people + hitting the 🔄 & ❤️ buttons = great!
Policy Uncertainty NOT about Policy outcome, good saying. But from my view, the narrow IG/HY yield could be a reflection of rate cutting expectation or searching for Yield from Fixed Income portfolio construction to have a better lock-up rate for yield harvesting, what do you think?