
✍️ World Stocks Valuations, S&P 500 Valuation & Profitability + Palantir = Maverick Equities Charts of the Week #54
10 + 5 Maverick Charts that say 10,000 words

Dear all,
15 cherry picked Maverick Charts of the week say 10,000 words or more = the ‘How’!
Table of contents = the ‘What’! Executed in a succinct manner with the aim of a high density of ideas, because the best writing respects the reader’s time:
📊 Maverick Charts: World Stocks Valuations, S&P 500 Valuation & Profitability
📊 Bonus: Palantir (PLTR)
Objective: both data-driven insights + valuable food for thought = the ‘Why’!
📊 Maverick Charts: World Stocks Valuations, S&P 500 Valuation & Profitability
In a Top-Down fashion, starting with World Stocks by countries and sectors, then the major U.S. Indices, followed by more nuances on the mighty S&P 500 index and its sectors — then connecting it with the fundamentals: profitability and earnings!
World Stocks Valuations by countries & sectors, forward P/E, chart=10,000 words!
👉 U.S. with Growth, IT & Industrials = the ‘pricey’ chaps
👉 U.K. with Value, Energy and Financials = the ‘cheap’ chaps

U.S. Valuations by indices via forward P/E relative to 20-year distributions:
👉 S&P 500 = 22x and top of the 20-year range, and Nasdaq = 27x and close to the range 20-year range = ‘pricey’
👉 S&P 500 equal-weight = 17x, and Midcap = 16x = more ‘decent’

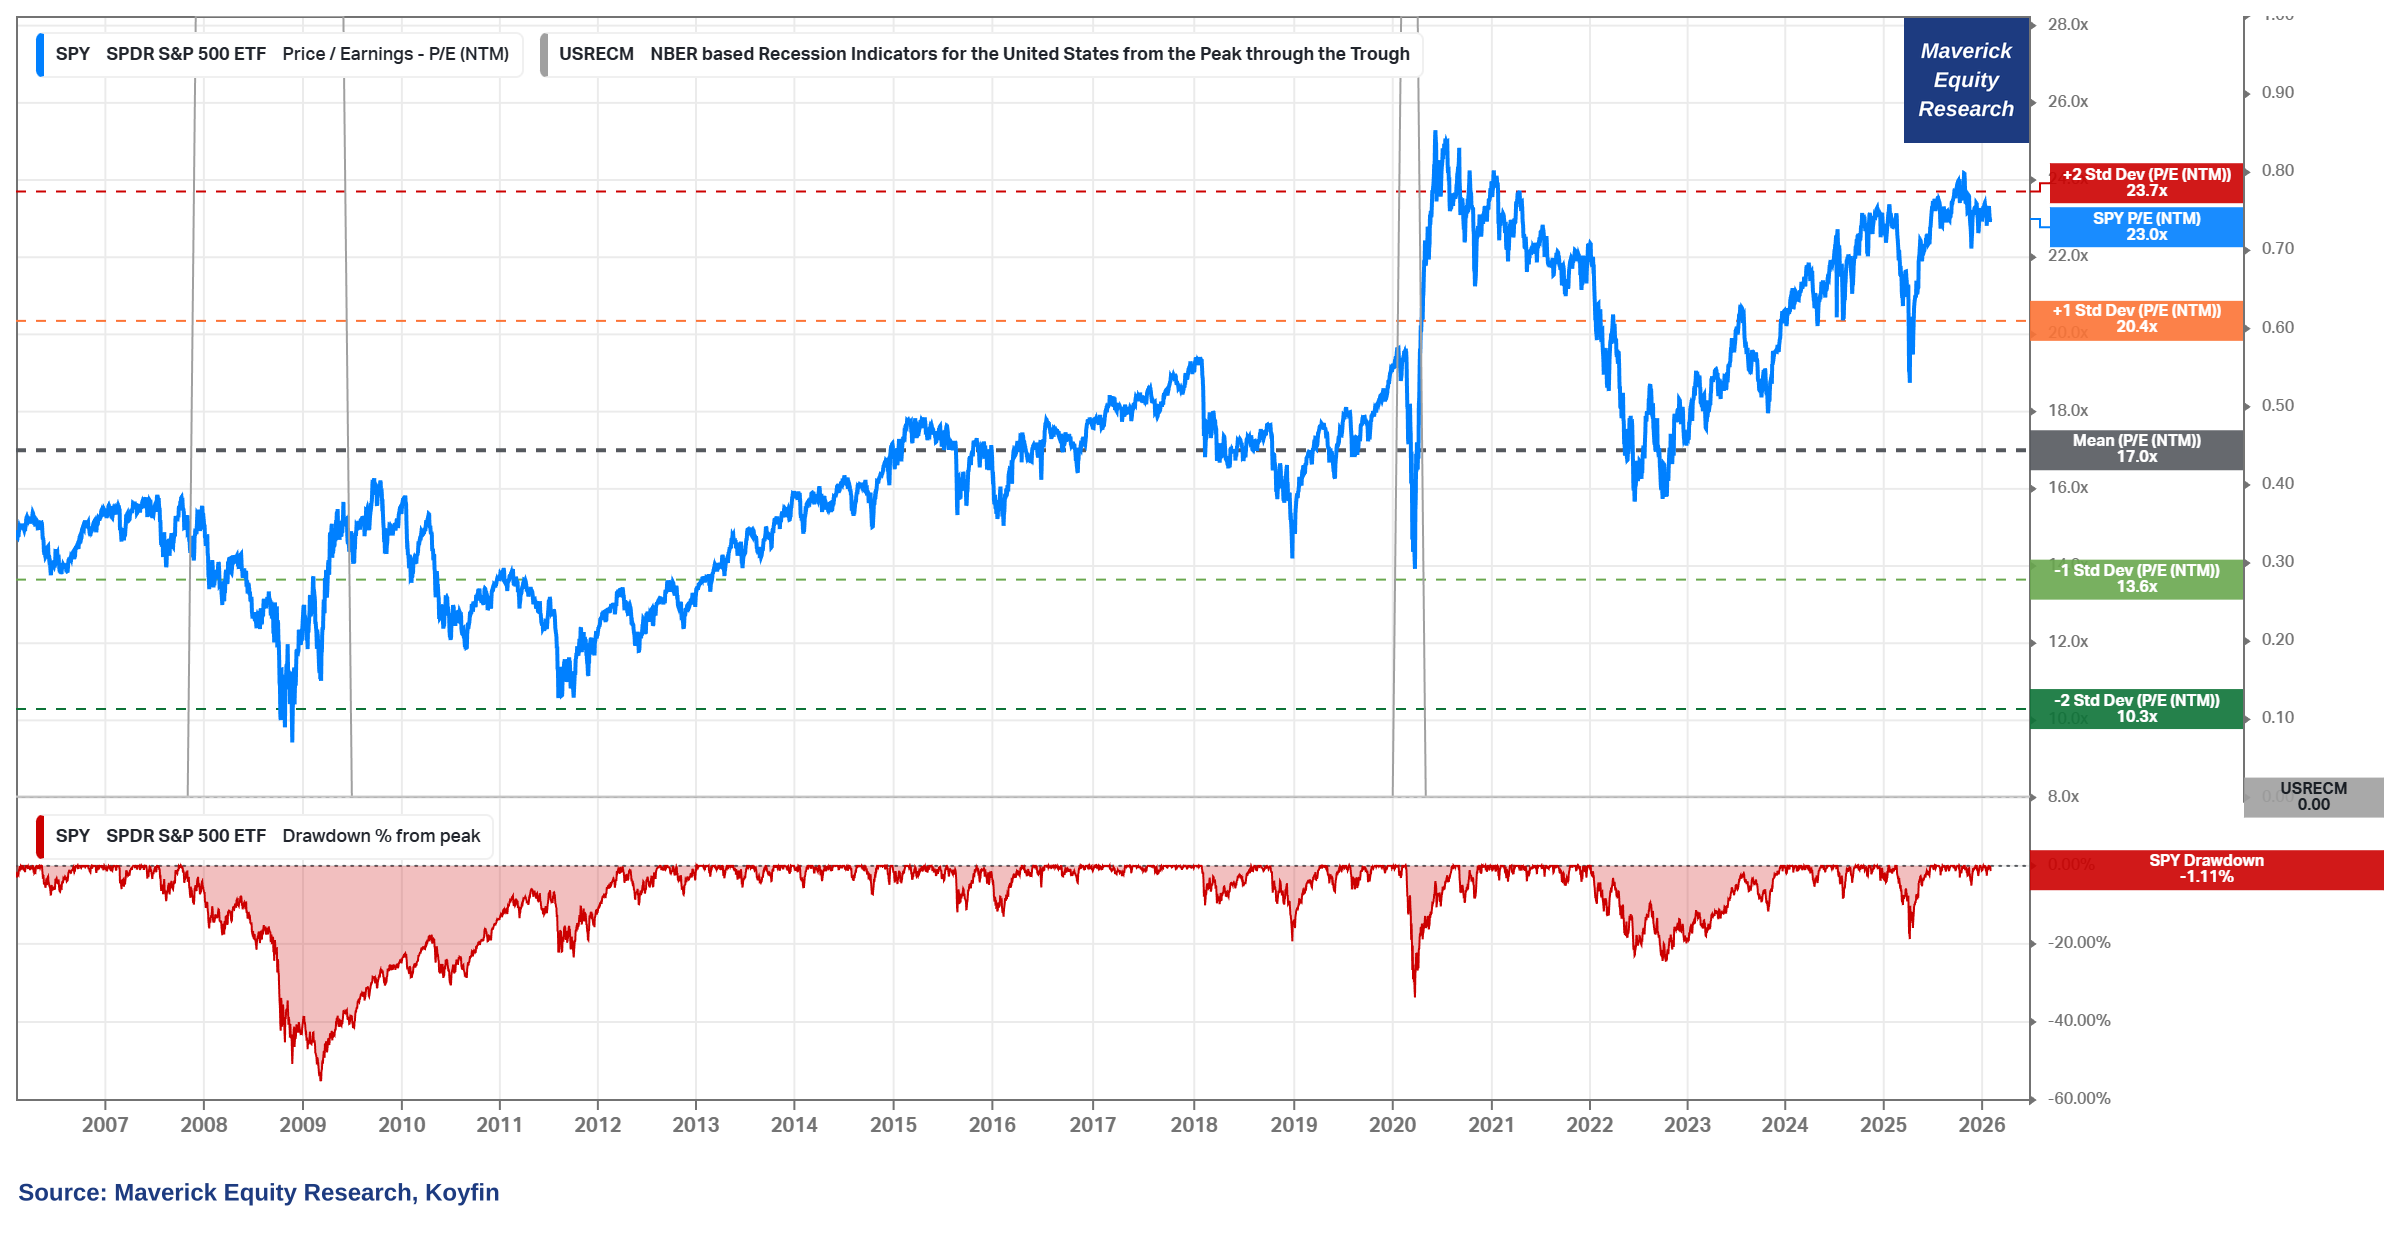
S&P 500 Forward P/E complementary note:
👉 we are now very close to the +2 Standard Deviations (red) which equates to 23.7x
S&P 500 11 Sectors Valuations via forward P/E relative to historical 10 & 30-years:
👉 from 16x for Financials to 29x for Consumer Discretionary
👉 relative to history it is a very mixed bag: note Industrials on the ‘high’ end, while Real Estate on the ‘low’ end

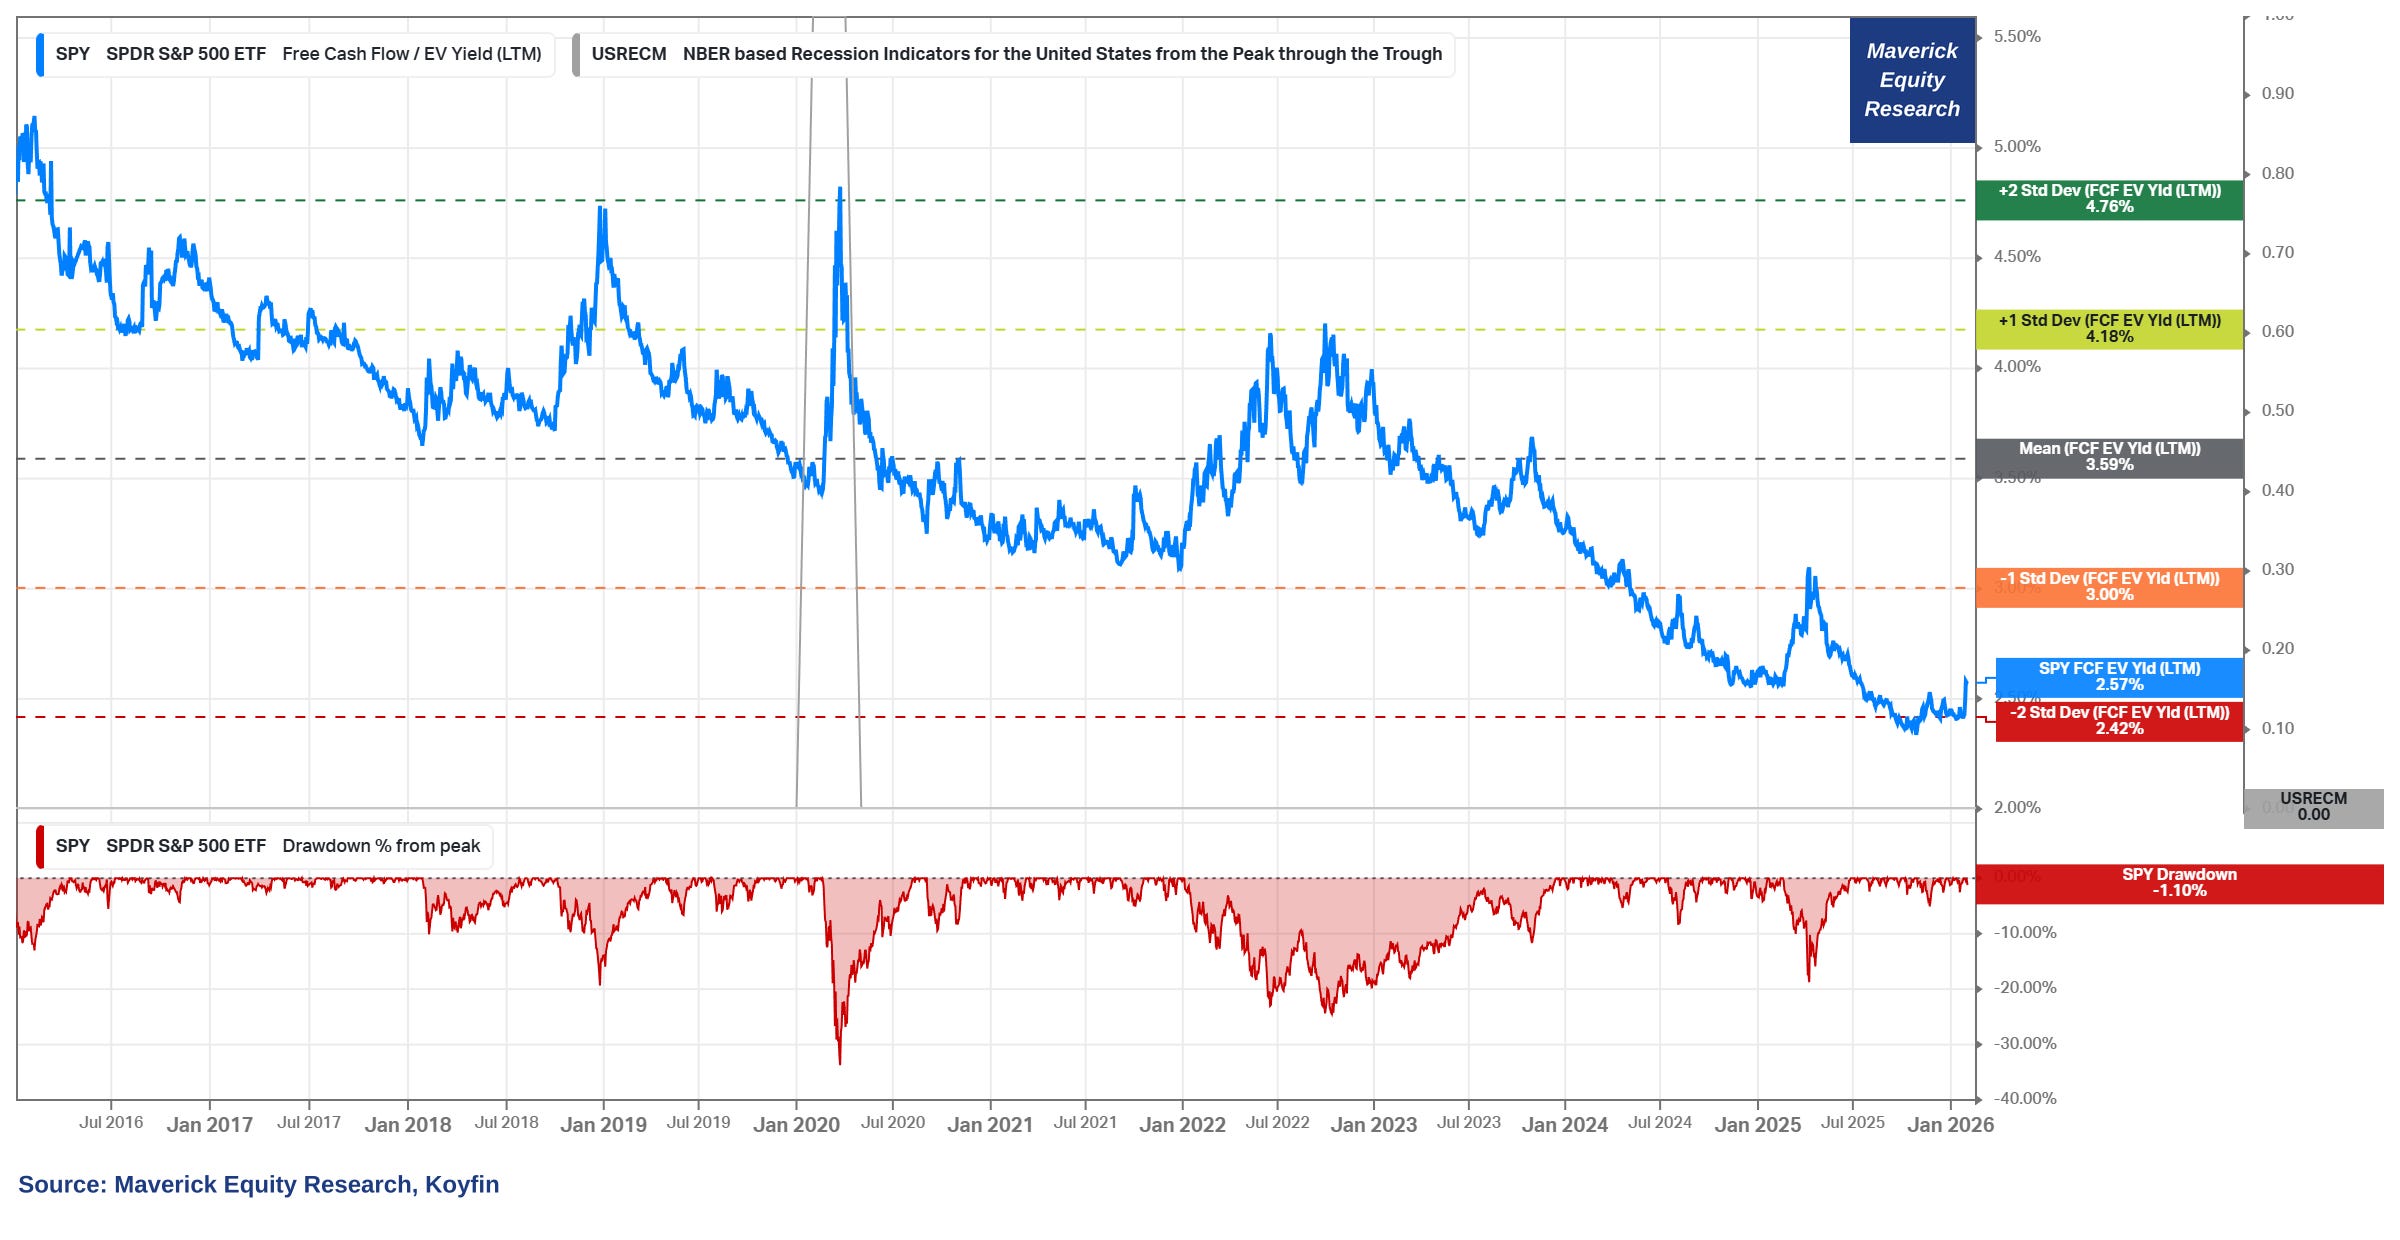
S&P 500 Free Cash Flow (FCF) yield wise:
👉 2.57% now, very close to the -2 Standard Deviations (red) which equates to 2.42%
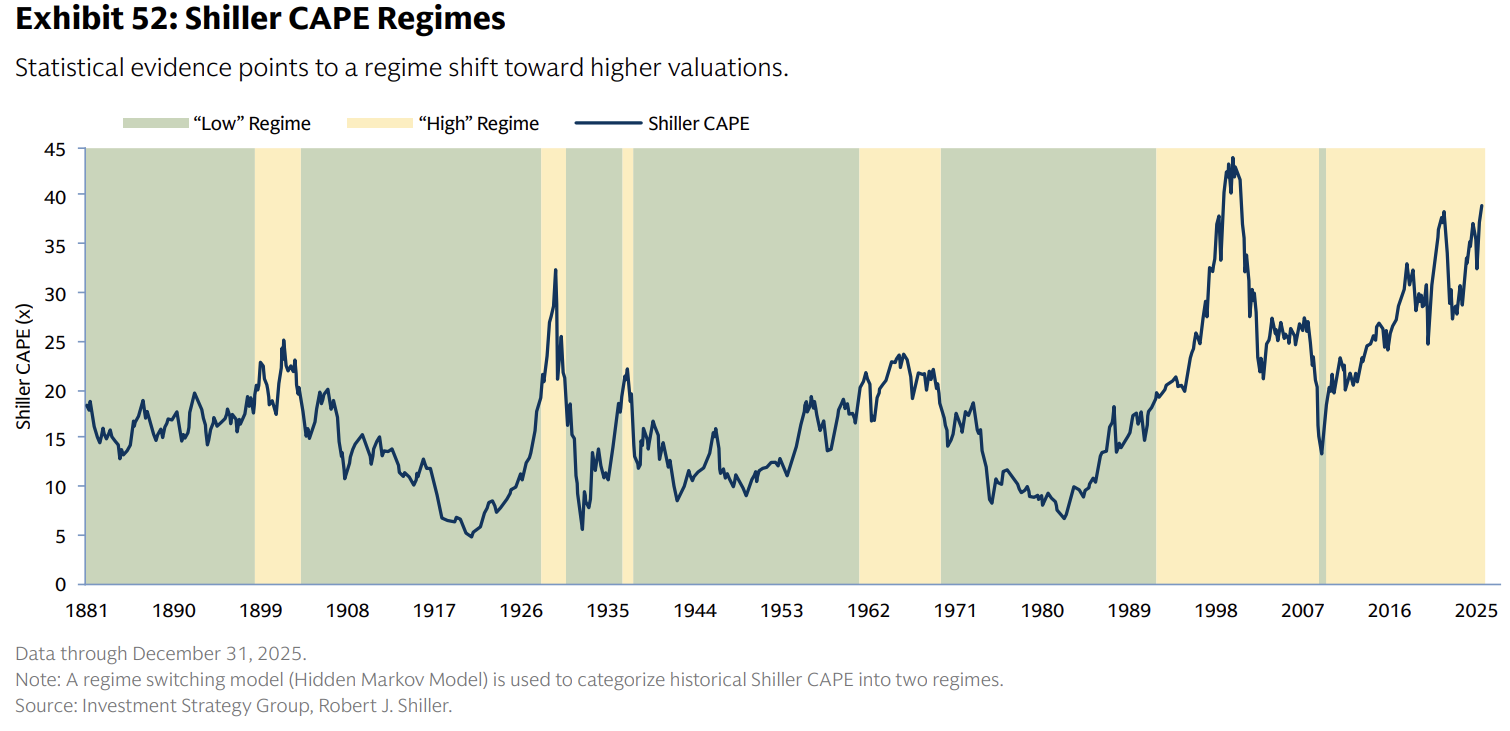
Shiller CAPE at 40 = not far from a historical all-time high!
👉 Valuation regimes wise, statistical evidence points to a regime shift toward higher valuations = U.S. stocks have been in a ‘high’ valuation regime since January 1992 (sole interruption during the 2007-2009 GFC)
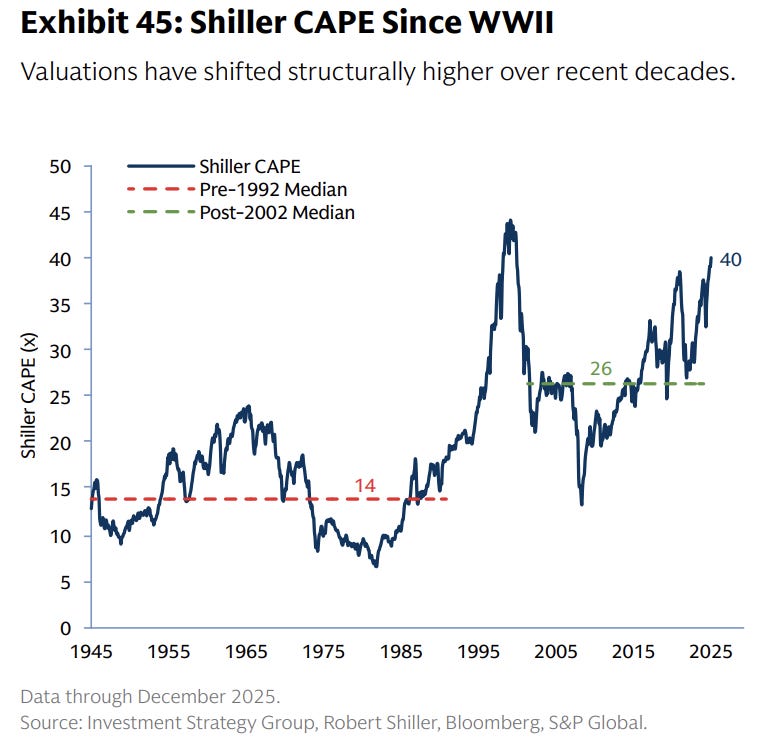
Valuations shifted structurally higher over recent decades / since WW2
👉 CAPE tells us that we are way above both post-2002 (26) and pre-1992 median (14)
S&P 500: Valuation vs Profitability, the both surprising head scratcher one, and the key food for thought chart going forward — by periods/regimes, trend line and statistical bands +/- 1 SD via forward P/E ratio and forward Net Margin:
👉 2025-present (orange) with a very high profitability environment ...
👉 22x forward P/E multiple ‘justified’ at least partly or majority one can say = the index is more concentrated in the mega tech names, but overall a higher quality index than 10-20 years ago ...

In terms of the actual/realised current Net Profit Margins (NPM):
👉 at 13.2% it will likely mark the highest NPM reported since 2009
👉 current record (going back to 2009) = 13.1%, which occurred in the previous quarter

Q4 Earnings & Revenue scorecard (fresh as of Jan 30th) with 166 companies in:
👉 75% of S&P 500 companies have reported a positive EPS surprise and 65% of S&P 500 companies have reported a positive revenue surprise
👉 Earnings growth +13.4% = solid! And if it stays above 10% (very likely), it will mark the 5th consecutive quarter of double-digit earnings growth
👉 Revenue growth +7.6% (solid also ...)
👉 Guidance for Q1 2026: 7 S&P 500 companies have issued negative EPS guidance and 17 issued positive EPS guidance

N.B. way more via my quarterly recurrent two distinct S&P 500 reports & materially improved in all areas: structure, flow, insights and special metrics you rarely see!
✍️ S&P 500 Report: Valuation, Fundamentals, Special Metrics & Leading Indicators
✍️ S&P 500 Report: Performance, Sentiment, Seasonality, Technical Analysis
The reports aim to break down the key question:
“Where are we, what are the key drivers, what are the technicals saying, how is the Sentiment?
“Is the stock market = highly undervalued (very cheap), undervalued (cheap), fairly valued, overvalued (expensive), or highly overvalued (very expensive)?”
📊 Bonus: Palantir (PLTR) 📊
Palantir Technologies (PLTR) reported yesterday great Q4 results:
Growth rates:
Government Revenue: +66%
Commercial Revenue: +137%
Customer Count: +34%
Adjusted EPS: +243%
Remaining Performance Obligations (RPO): +143%
Net Dollar Retention Rate: 139%
Stock reacted +7.2% after hours yesterday, and +5.77% today heading into the closing.
Let’s get visual now with selected fundamentals:
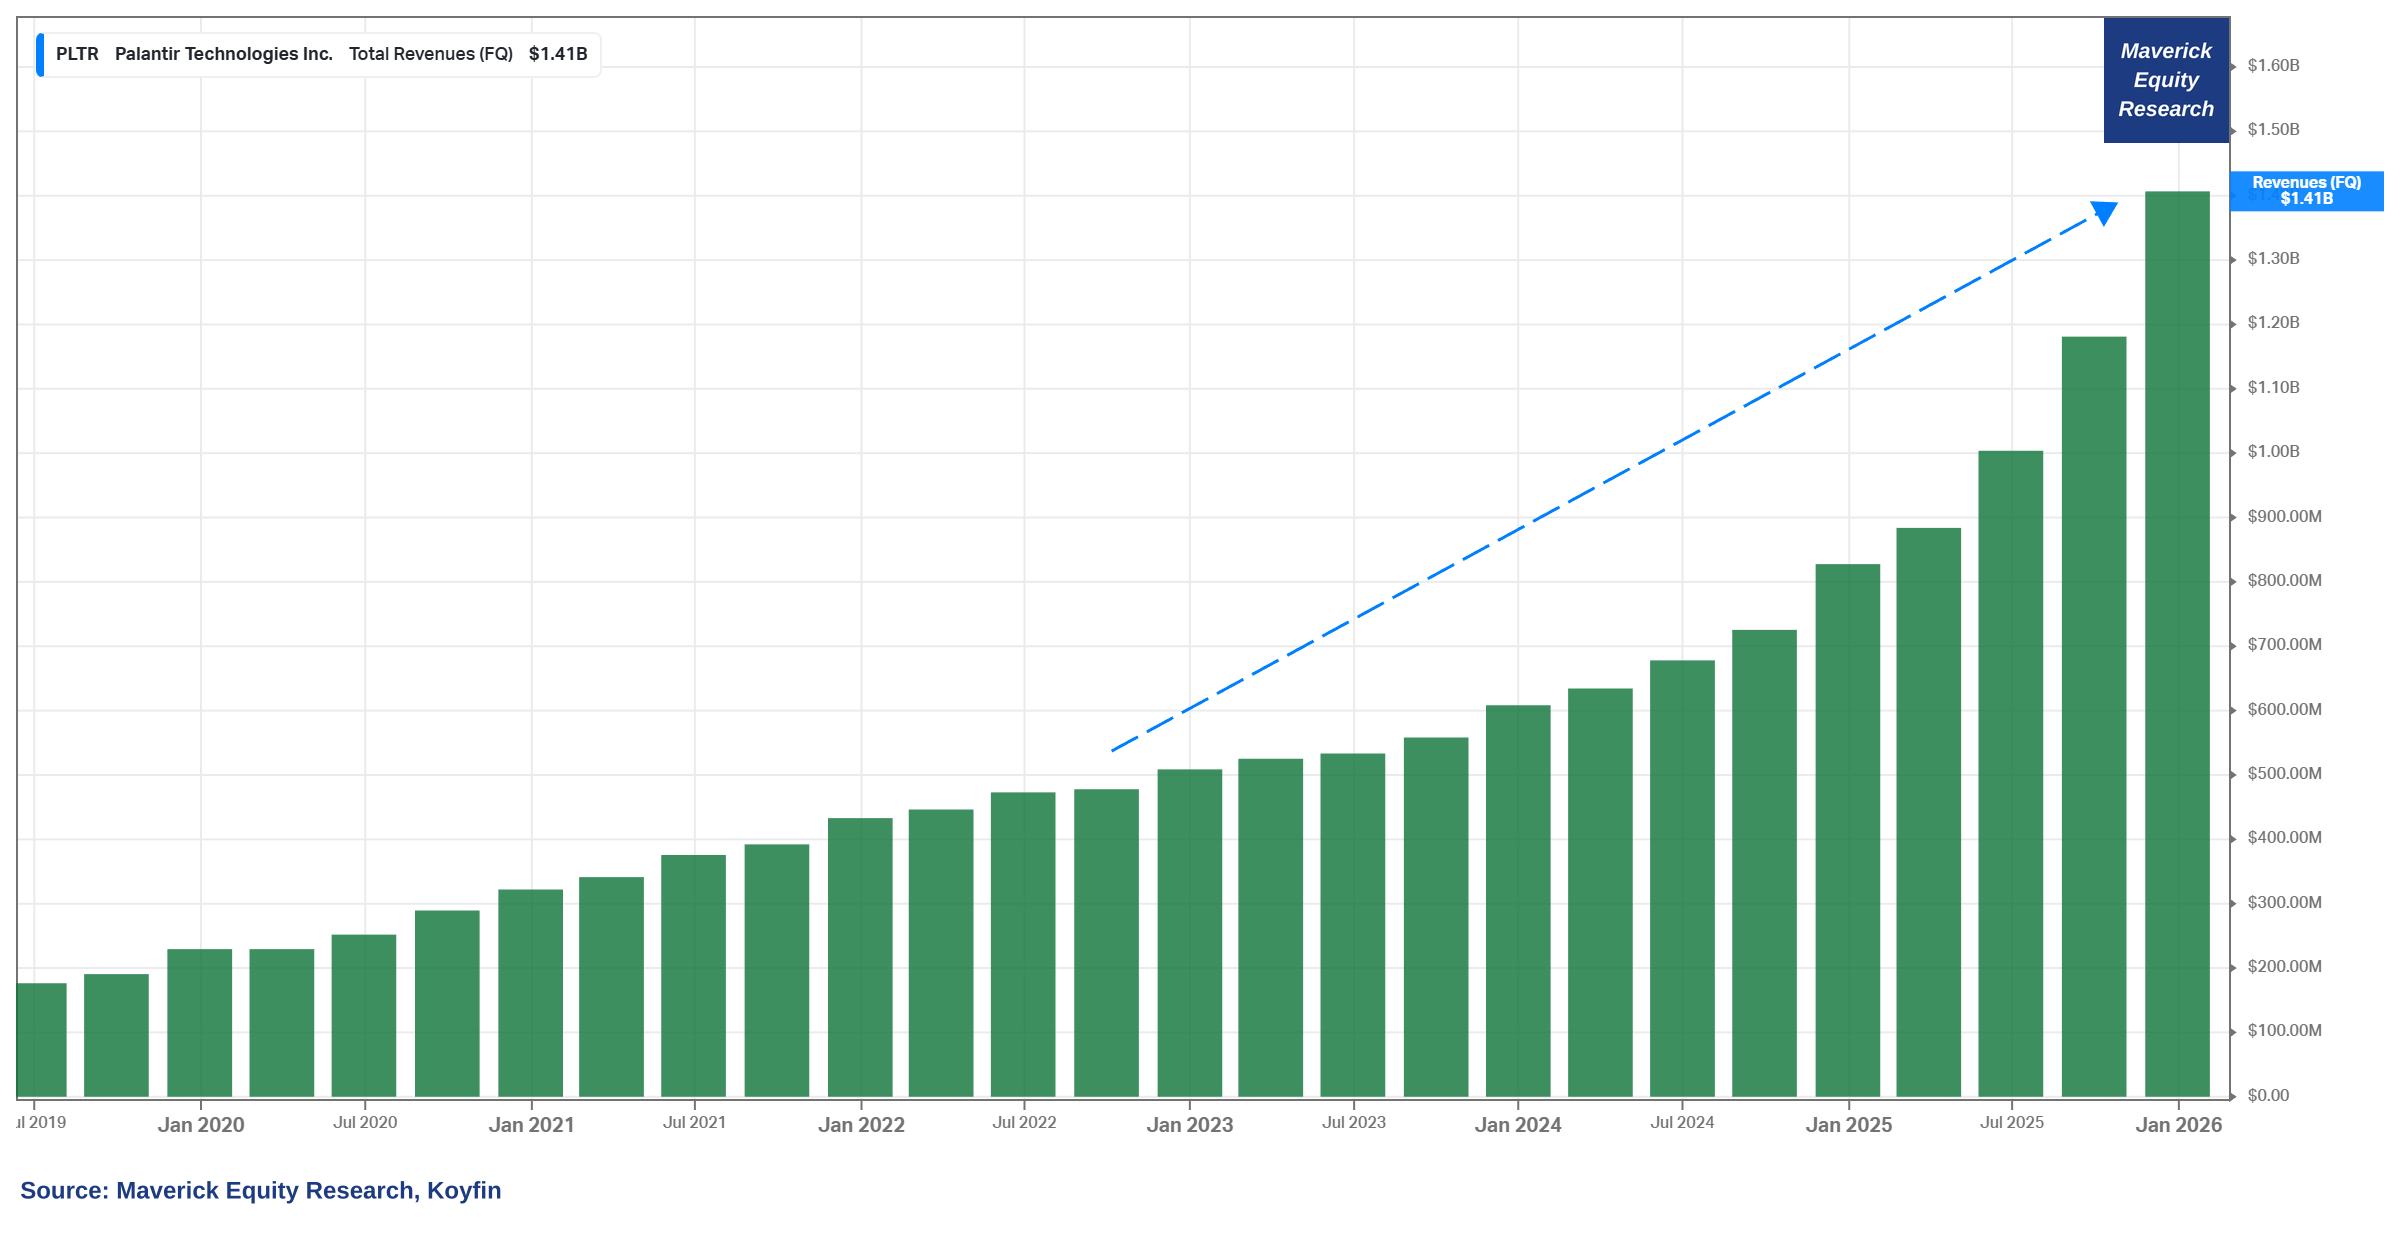
Revenue:
👉 $1.4 billion for the quarter = super solid!
👉 Business is scaling very well, especially in the last 3 years ramping up!
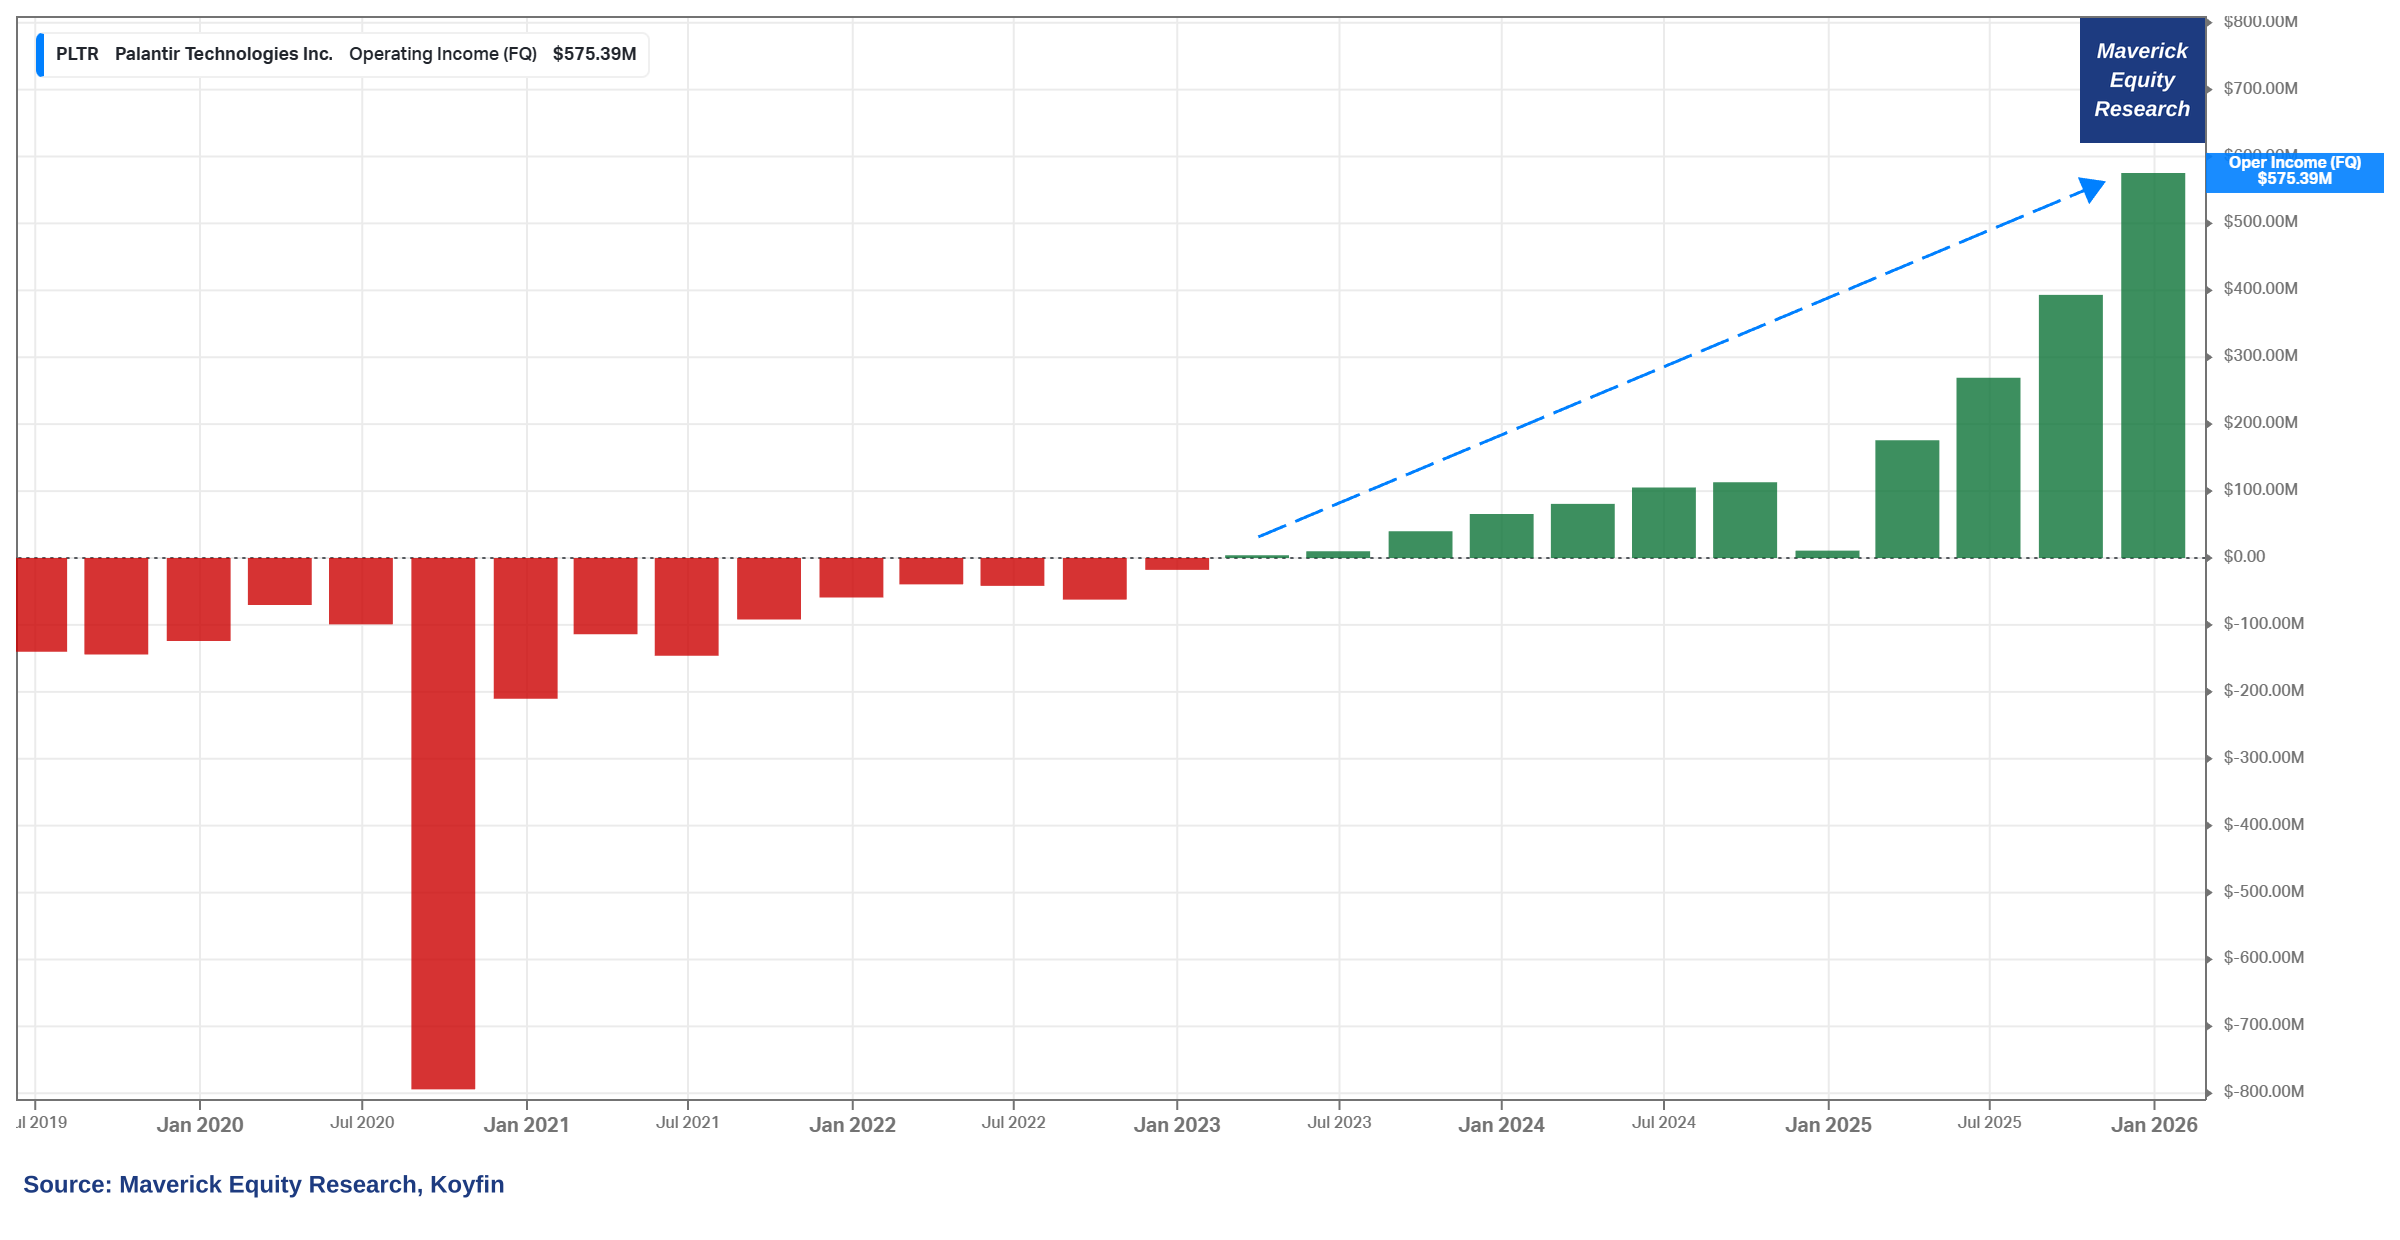
Operating Income:
👉 $575 million for the quarter = super solid also, confirming the scaling!
Adjusted Operating Margin & Revenue Growth:
👉 Palantir a huge outlier with a 127% & the only one inside the ‘Rule of 120 Frontier’

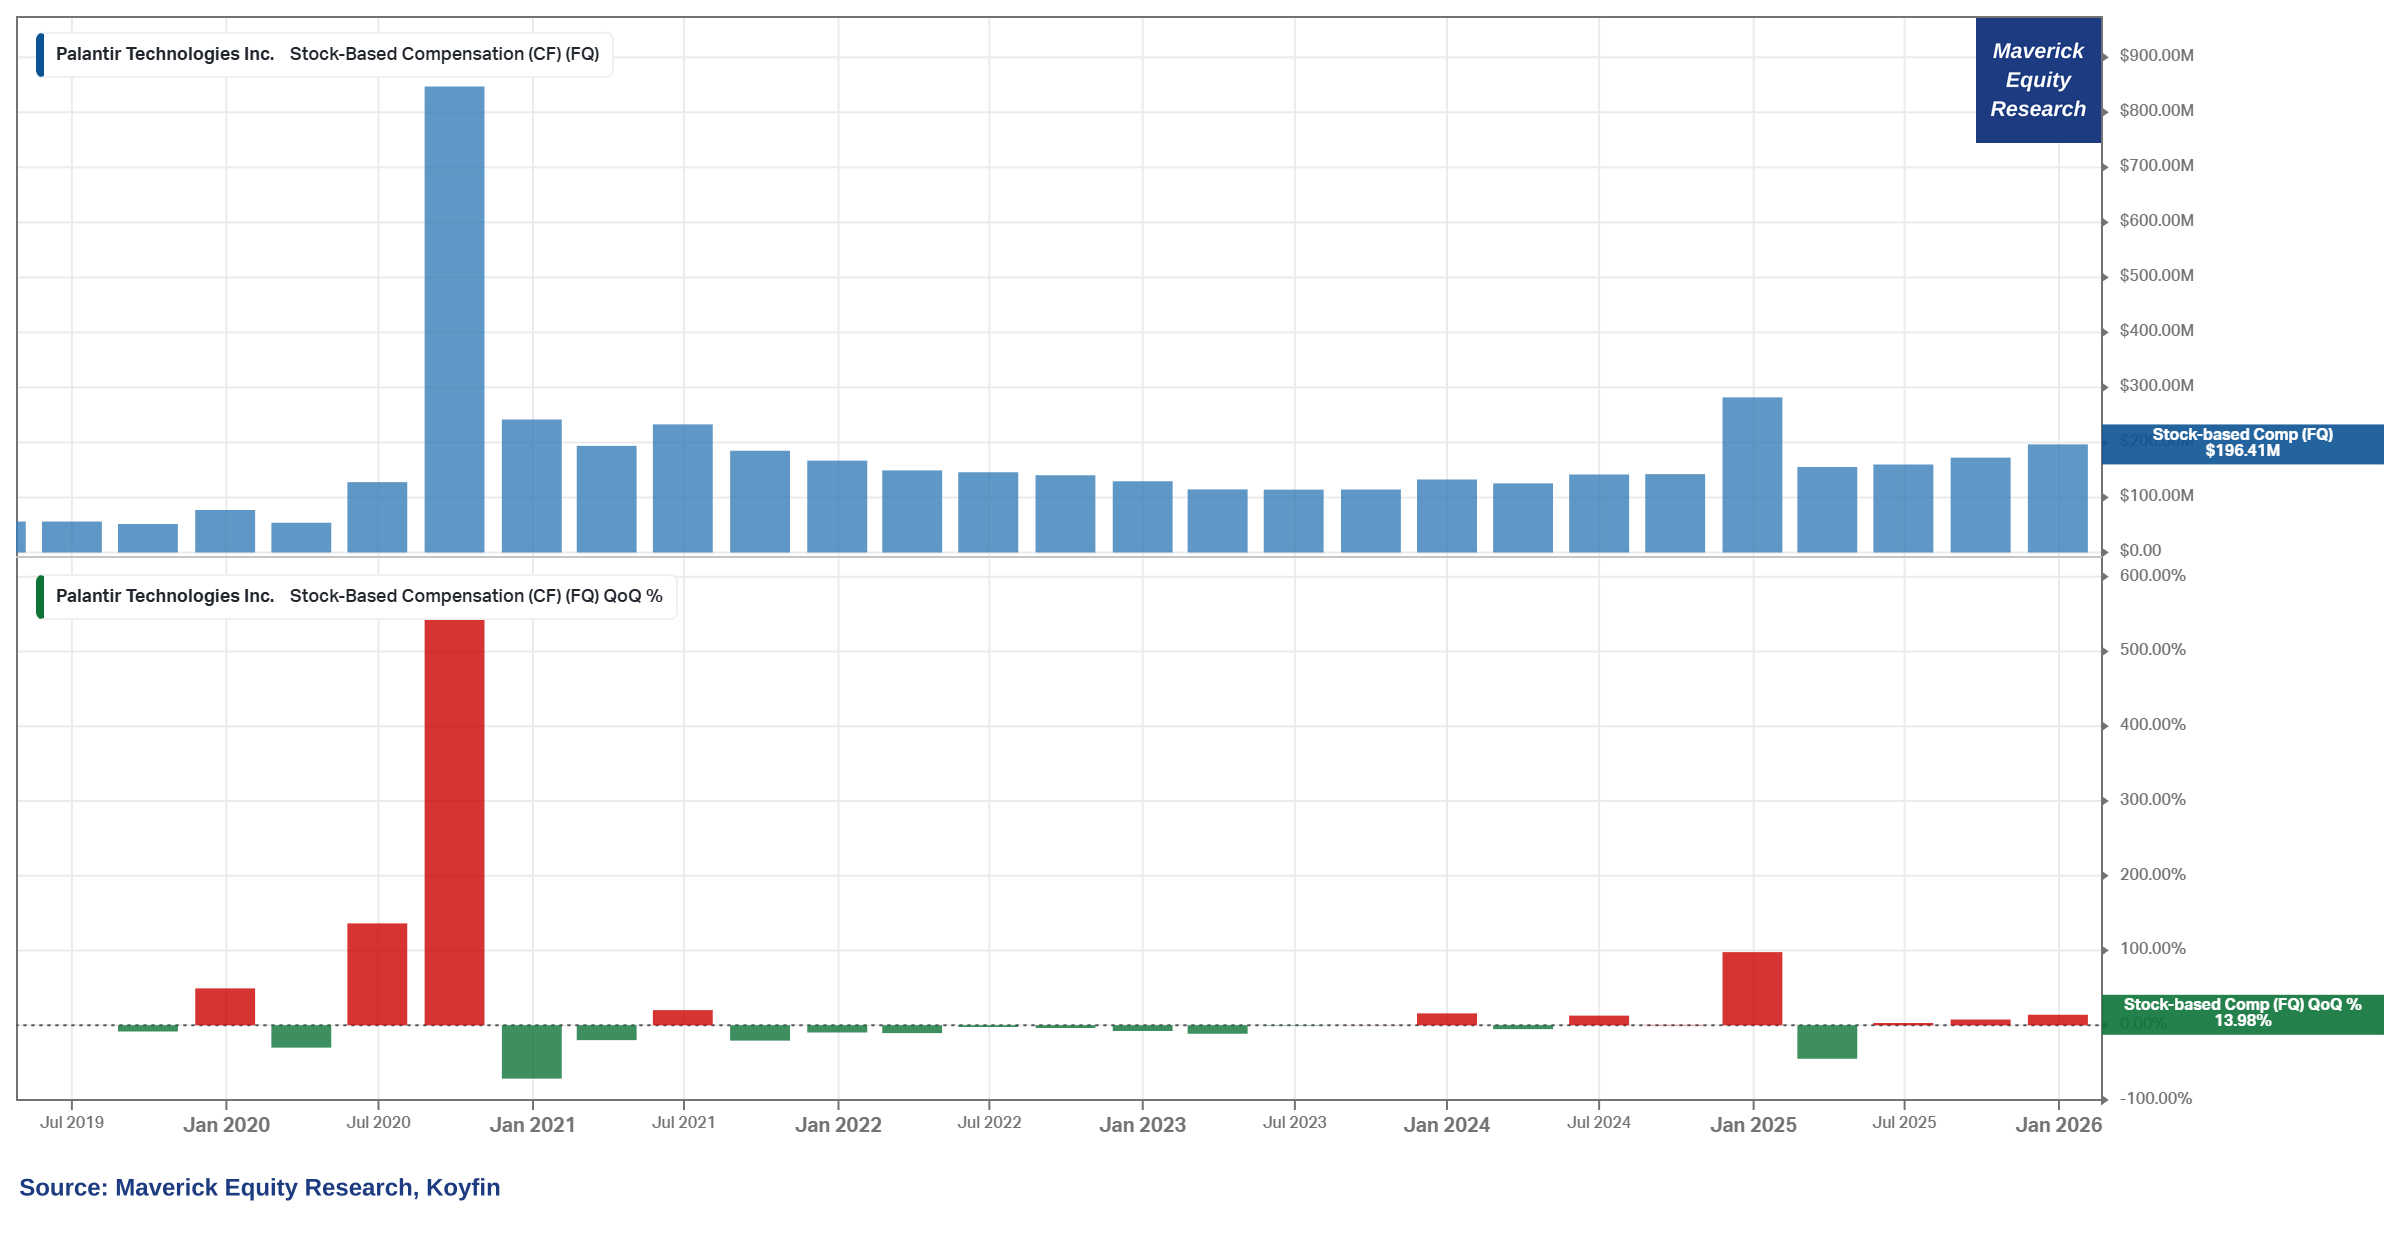
Stock-Based Compensation (SBC):
👉 $196 million, it’s not high not low given that the business is scaling nicely
The big big question is VALUATION as during waves, the stock is not the business & the business is not the stock!
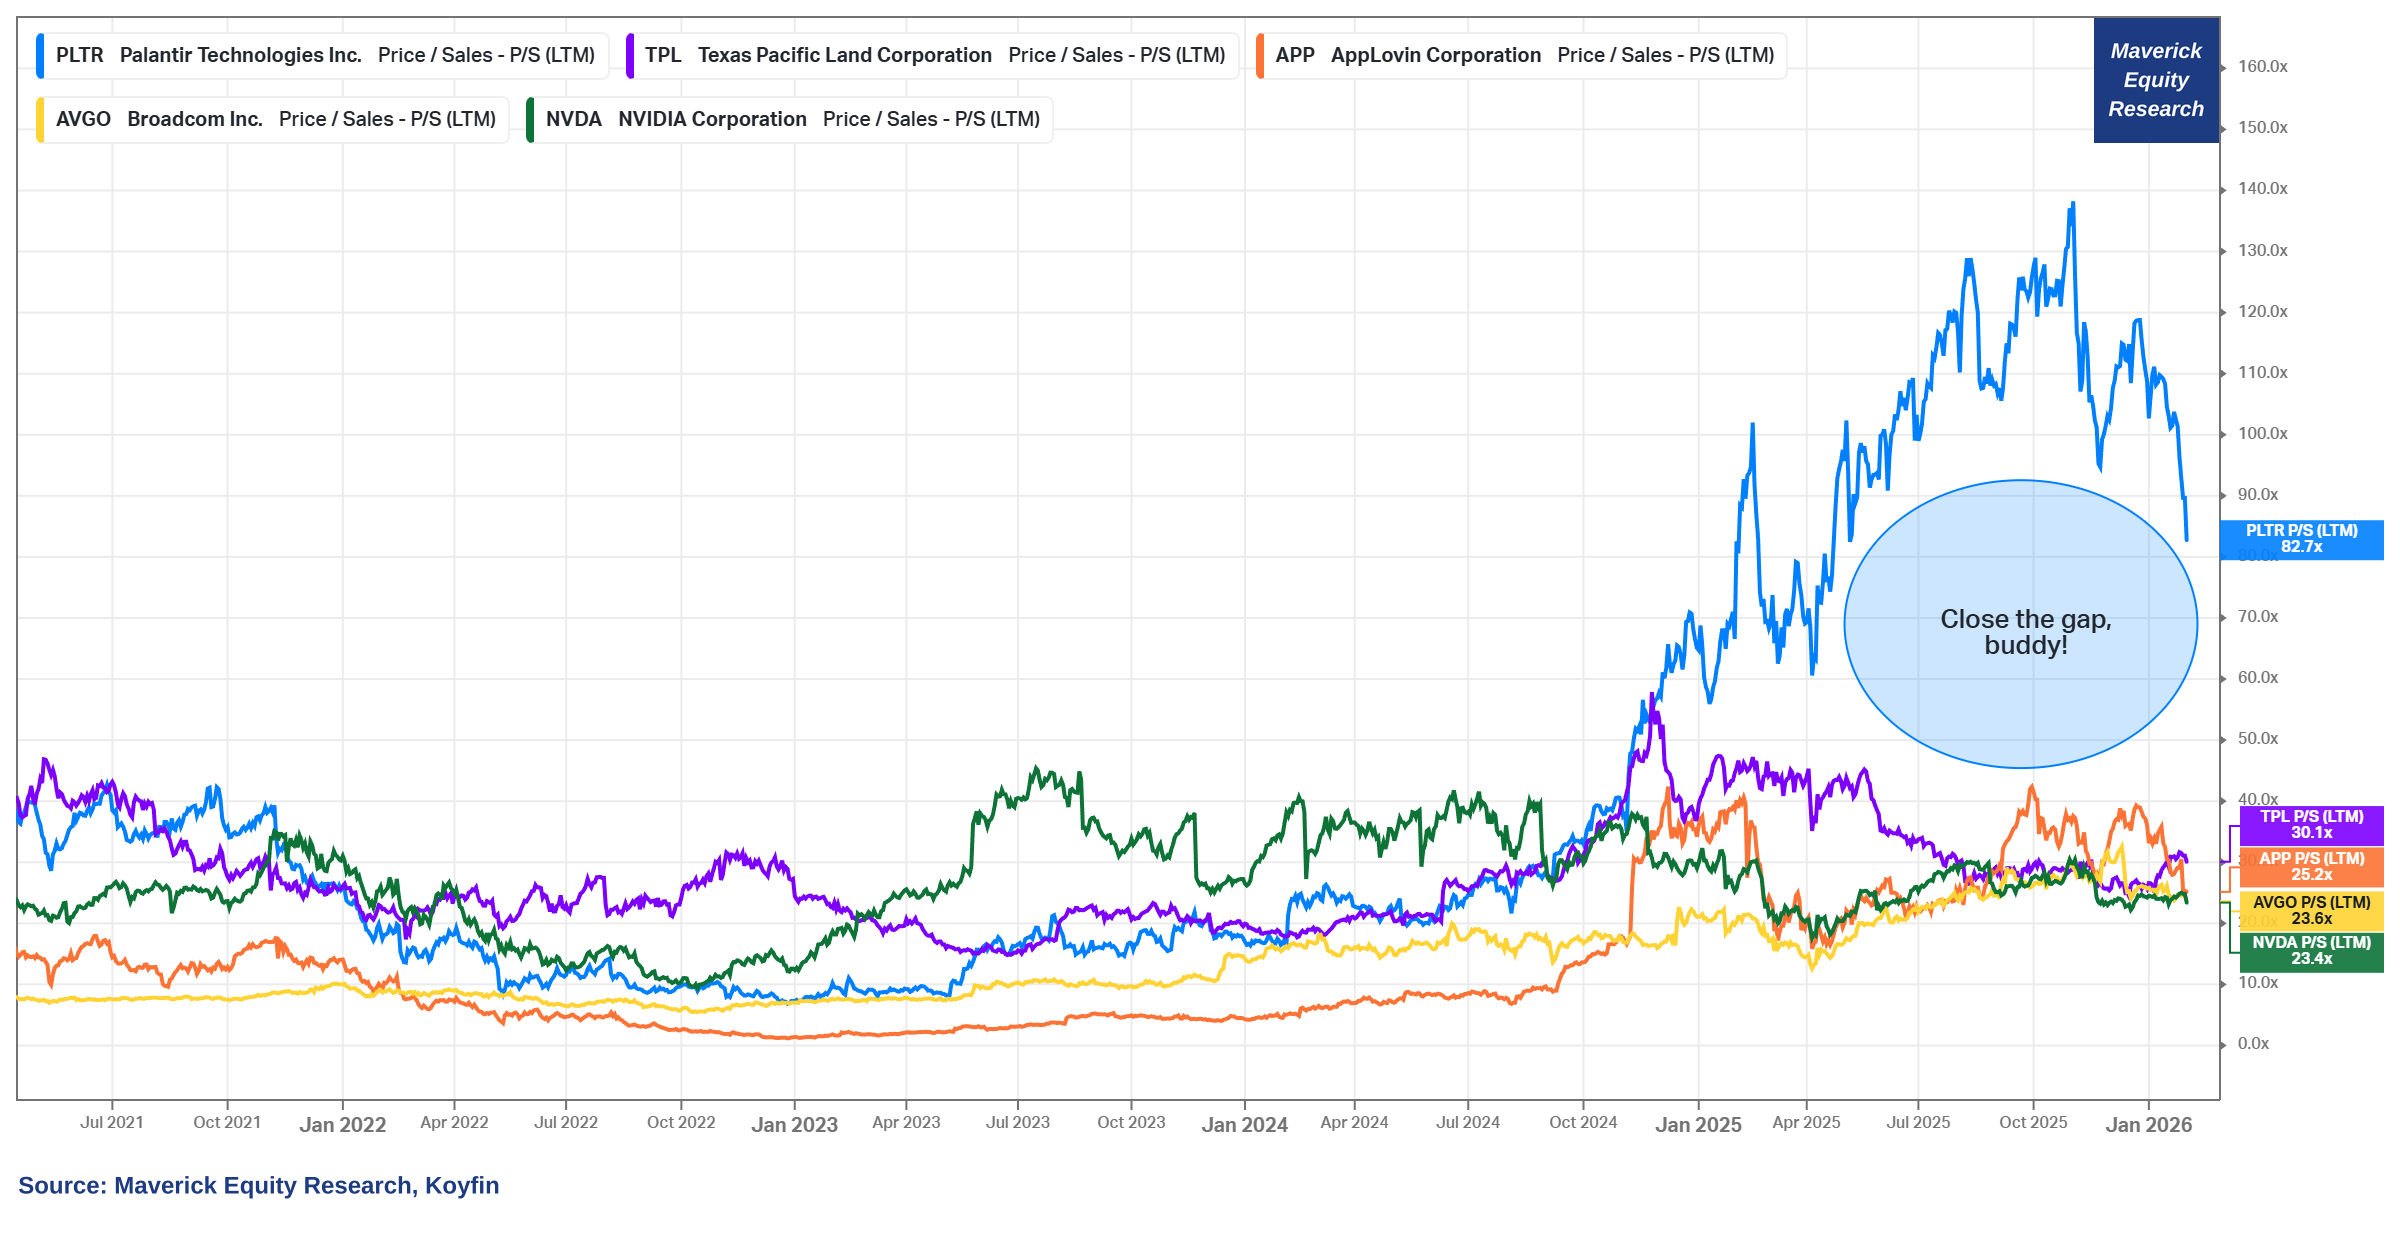
S&P 500 top 5 by Price/Sales multiple - guess #1? Palantir = drum rollllls ... 82.7x !!!
👉 = 2.75x greater than the 2nd highest P/S ratio in the S&P 500 which belongs to Texas Pacific Land (TPL) at 30.1x
👉 = 3.3x greater than the 3rd highest P/S ratio in the S&P 500 which belongs to AppLovin (APP) at 25.2x
👉 = 3.50x greater than the 4th highest P/S ratio in the S&P 500 which belongs to Broadcom (AVGO) at 23.6x
👉 = 3.53x greater than the 5th highest P/S ratio in the S&P 500 which belongs to Nvidia (NVDA) at 23.6x
Let that one sink in & bring the sink if you wish 😉!
Overall, I think Palantir is a great business, will do well, but the valuation is way too high now for me. I still believe it is very dependent on the market (beta).
👉 when the market will correct 20%, Palantir stock likely dropping 40-50%
👉 when the market will correct 30%, Palantir stock likely dropping 60-70%
Maverick idea: 2027-2028 Long Puts (to hedge or speculate) are now a good idea!
Maverick Charts 54th edition done, 10 key charts with many insights + 5 Bonus!
You can check all the previous 53 editions in the Maverick Charts section!
Mission accomplished for me if the following resonates with you:
‘Hmm I never thought it that way’, ‘now that chart said a whole lot’, ‘now that chart was really interesting’, ‘now that is something new’, ‘now I got it!’, ‘you managed to turn something complex into something actually simple’
hence, if you got to see something differently, my approach gave you a different angle, it did help you connect your key dots, then here we all do well!
Research is NOT behind a paywall and NO pesky ads here unlike most other places!
Did you enjoy this finding it interesting, saving you time and with valuable insights?
If yes, you can support Independent Investment and Economic Research with a Realist-Optimist mindset via the following 3 options:
‘Buy me a Book, Coffee or Data’ which are the tools through which the research is done and delivered straight to your inbox!
PayPal, the classic donation/tip option:
Pledge for a future Premium Research subscription, to be specific introducing “I-RAAS” = Independent Research As A Service
you will be informed in advance both when the Premium Offering will go live, and what it will consists of along its cadence & structure + you can cancel anytime
best part = you will get the best introductory pricing, it will never be cheaper
That’ll definitely support bringing both the current + future ‘Maverick-esque’ research: from a single individual … not a corporate, bank, fund, click-baity media or so … !
Like this, big positive externalities become the name of the game, and we all benefit!
Have a great day! And never forget, keep compounding: family, friends, hobbies, community, work, independence, capital, knowledge, research and mindset!
With respect,
Your Maverick 👋 🤝

P.S. sharing around with like-minded people + hitting the 🔄 & ❤️ buttons = great!
Great charts and a timely reminder that elevated market valuations only hold up when supported by real fundamental strength. Especially helpful context for retail investors navigating today’s pricing levels.
Do you have a Discord Maverick?