
✍️ Decoding the U.S. Economy in Real-Time Through Sleek High Frequency & Alternative Data
A Real-Time View on the U.S. Economy = 30 Rare Maverick Charts for 10,000 Words!

Dear all,
for the 4th of July U.S. celebration, which also marks 250 years of American independence, capitalism, and exceptionalism, I said to myself: this is a great occasion to bring you a Maverick Special Report!

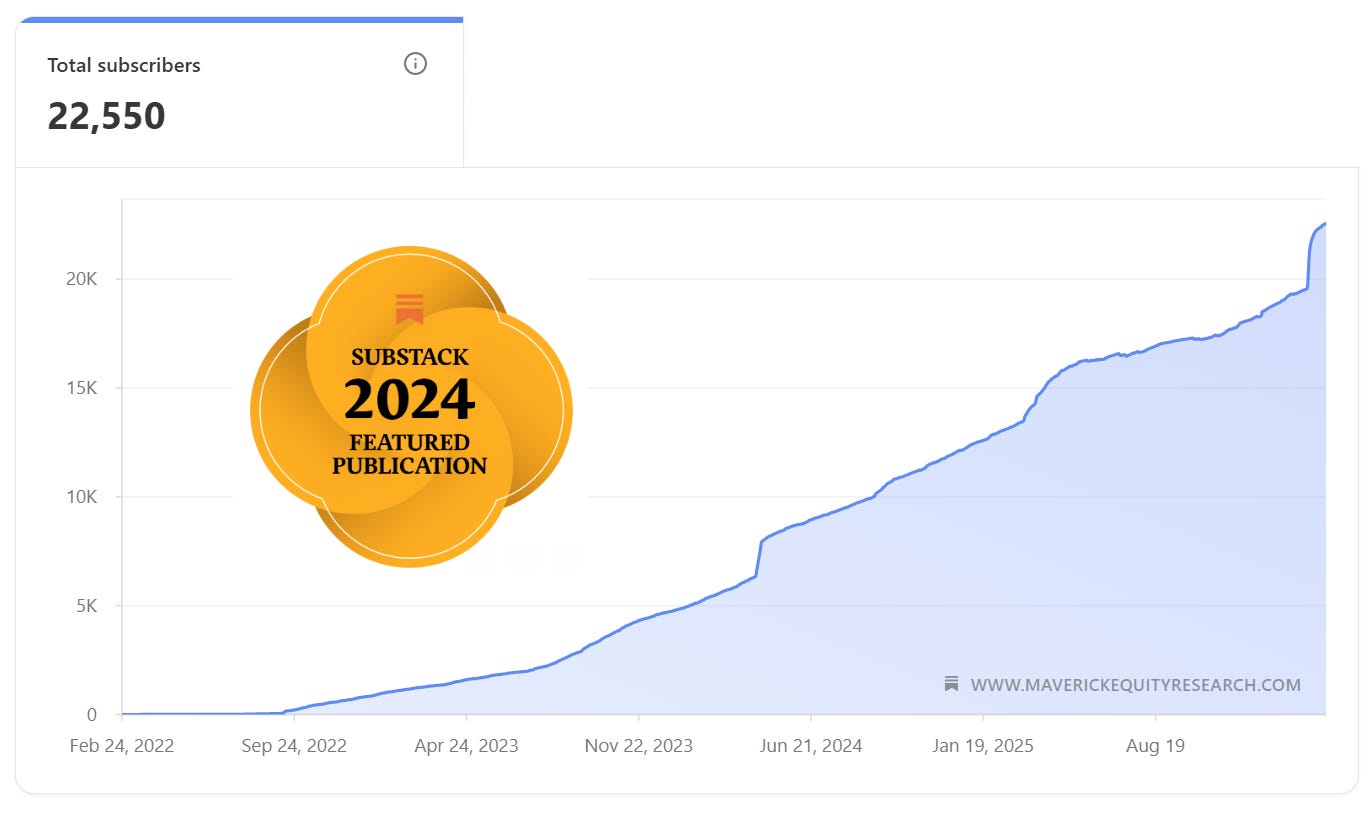
Second of all, this is also a great occasion to welcome the +2,000 new subscribers with great & diverse backgrounds, for a total of 22,550 from 50 U.S. states & 168 countries.
Independent of what type of investor, trader, business person, or professional you are, obtaining a real-time solid overview of the current state of the U.S. economy is key!
There are many ways to approach such a research report, ranging from highly technical to more accessible, lengthy to concise, yet as always I aim to provide you with a distinctive perspective, original analysis, compelling visuals, and key insights.
For this special occasion, you get my approach of decoding the U.S. Economy by looking way beyond the traditional economic metrics. Namely, through the lens of real-time, high frequency and alternative data via sleek 30 Maverick Charts for 10,000 words of economic intelligence!
a ‘live’ view on the state of the U.S. Economy!
a sharper way to understand the macro forces shaping investing and overall financial markets — connecting the Macro-Finance bridge!
quite a unique report which you do not see elsewhere! If you know a similar report, be it free, or paid, just let me know!
✍️ Decoding the U.S. Economy in Real-Time Through Sleek High Frequency & Alternative Data ✍️
Table of contents = report structure + highlights:
The Consumer & Households
📊 Air Travel: “How Often Are We Flying This Year, Baby?“
📊 Vehicle Miles Traveled: “Route 66, Baby!“
📊 Retail Sales: “Take Me Shopping, Baby!“
📊 Credit & Debit Card Spending: “Spend, Baby, Spend!“
📊 OpenTable Seated Diners: “Whining & Starving!“ vs "Wining & Dining!"
📊 Box Office Top 10 Grossing Films: “It’s Showtime, Baby!”
Business
📊 New Business Formation: “It’s Personal & Business, Skin In The Game, Baby”
Supply Chains
📊 Hormuz Strait: “The Current Hot Topic, Buddy’!”
📊 Global Supply Chains: “Bring the Goodies Home, Fast & Cheap Please!”
Trade Policy
📊 Trade Policy Uncertainty: “Let’s Do Business, Not Trade Wars, Buddy’!”
Economic Policy
📊Economic Policy Uncertainty: “More Clarity = More Business, Buddy’!”
Bonus: GDP Near-Real-Time Tracking
👍 Actual GDP: “GDP, Ohh Mighty Realised GDP!”
👍 GDPNow: “GDP, Ohh Mighty Now GDP!”
👍 Nowcast: “GDP, Ohh Mighty Smoother GDP!”
👍 Weekly Economic Index: “My Dear ‘Big Data’ Signal of the State of the U.S. Economy!”
Conclusions
📊 Takeaways: “After Work, The Reward, Baby!” & “Risk On, Baby!”
📊 Incoming Independent Research: “What Research is Coming Soon to Town, Mav?”
The Consumer & Households: we start & focus on the mighty Consumer as we hear often that it accounts for 70% of GDP — I would extend that to say that the Consumer IS THE Economy with our collective decisions to spend, save & invest!
📊 Air Travel: “How Often Are We Flying This Year, Baby?“
How many people are flying overall ? What about relative to previous years?
In order to capture consumers’ Income + Sentiment & Mobility all at once, there is a sleek chart to capture this key dynamic:
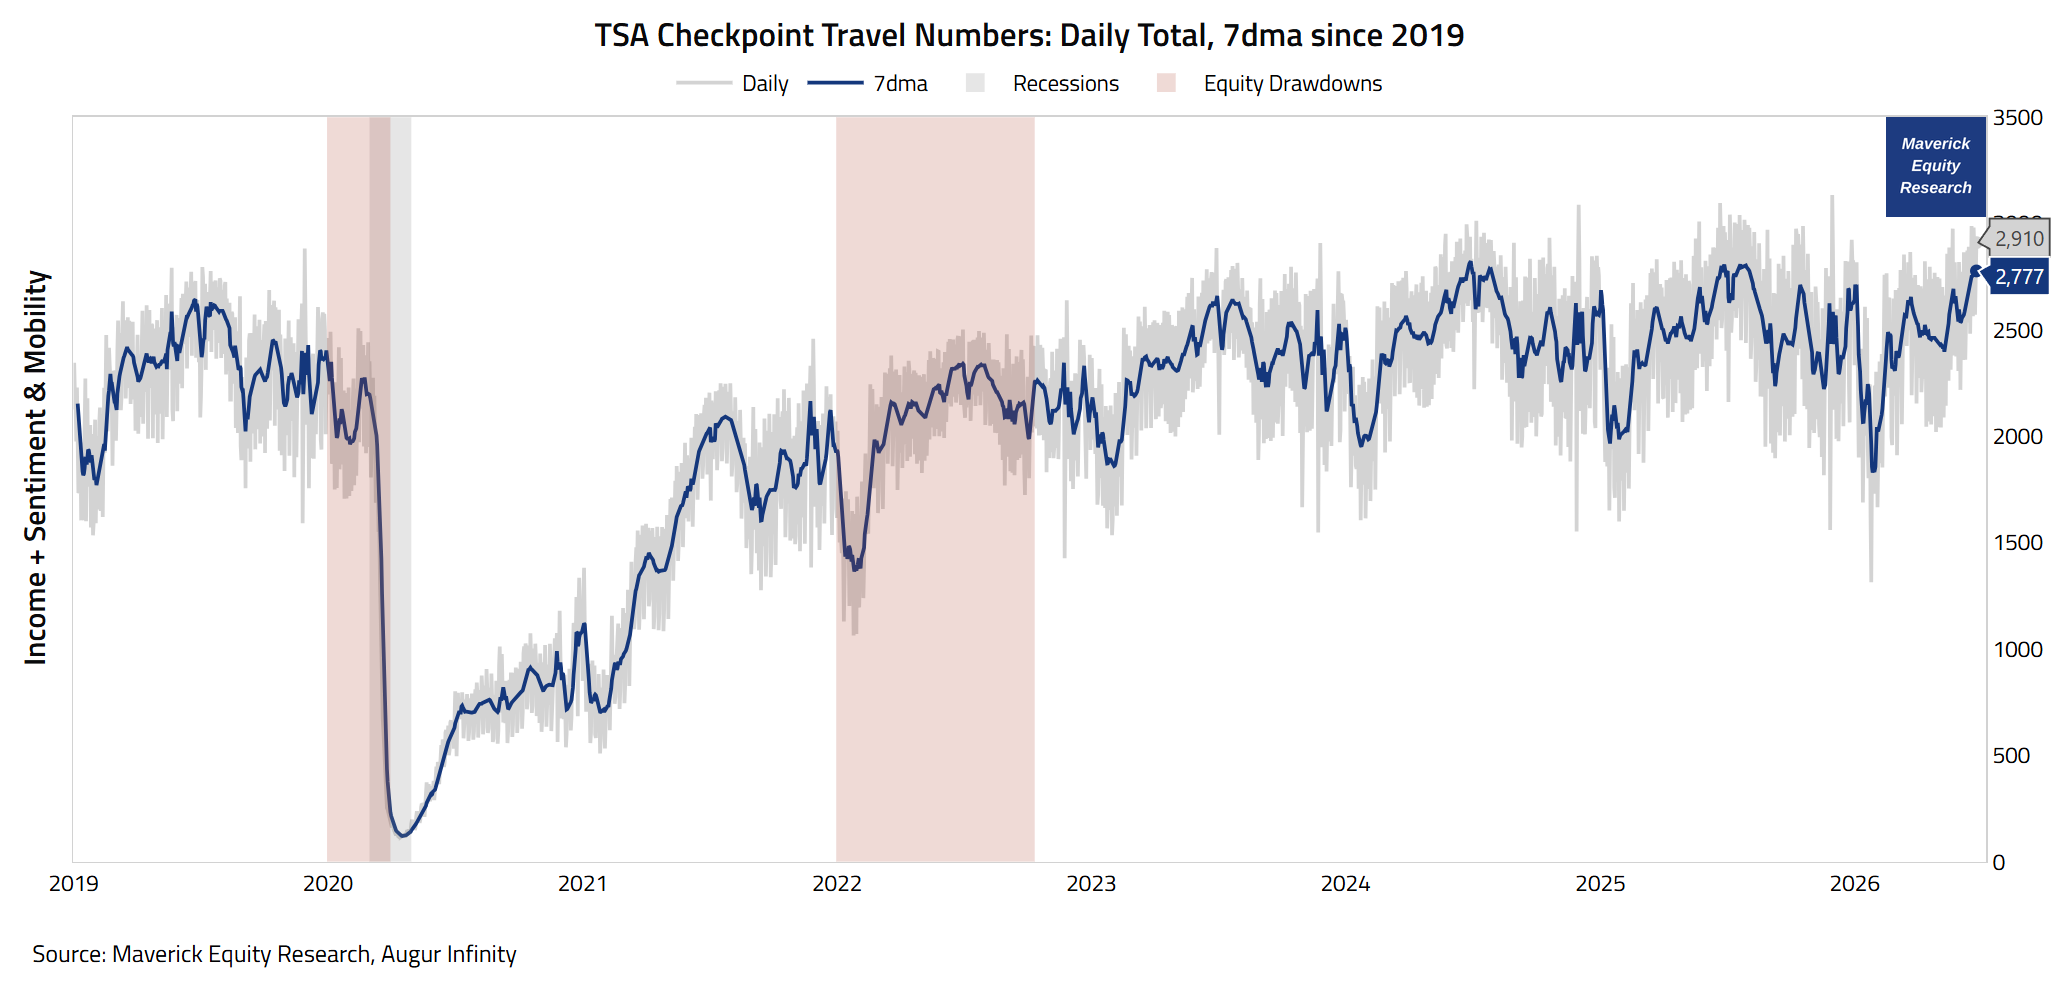
TSA Checkpoint Travel Numbers: Daily Total & 7dma since 2019
👉 2,910m travelers (grey) = a very solid reading (via the latest fresh number from just 3 days ago, 25th of June), not far from all-time record numbers
👉 2.777m travelers (blue) is the 7-day moving average which is also a solid reading
Context and insight:
Flight Travelers numbers are very correlated with the business cycle: check for recessions like the the 2020 Covid (grey), and also partly with the stock market, check the 2022 bear market (red) with that big drop in the first part of the year
hence, this is one of those rare Maverick Charts to be monitored for both downturns & upturns, especially given its timely daily values
as a Leading Indicator, in a nut shell it is a ‘live’ way to look at the dynamics of the mighty U.S. consumer and economy!
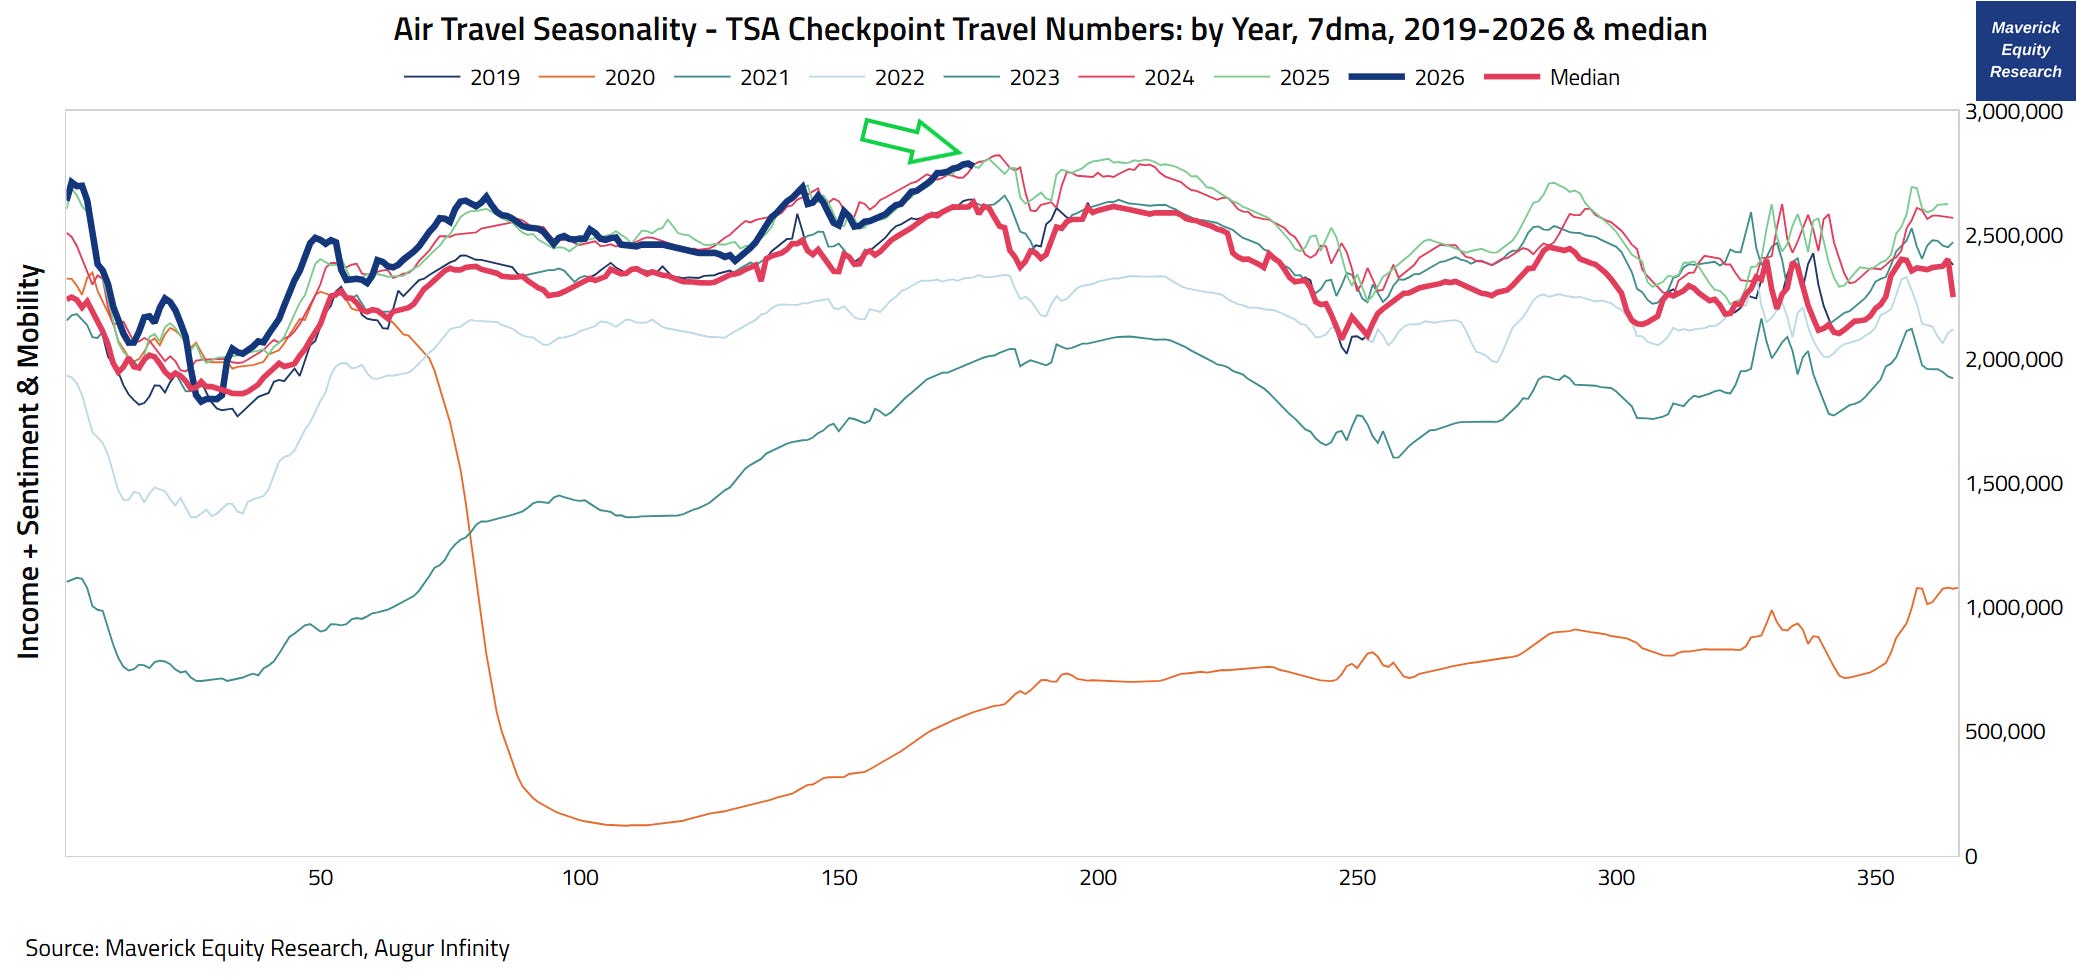
TSA Checkpoint Travel Numbers: by Year, 7dma, 2019-2026 & Median, a great complementary view in order to capture Air Travel Seasonality Dynamics:
👉 2026 (blue) with 2.777m daily passenger screenings (as a 7-day moving average) way above the 2.632m median (red) = a solid reading also from this angle
👉 above or around record levels for a decent part of 2026!
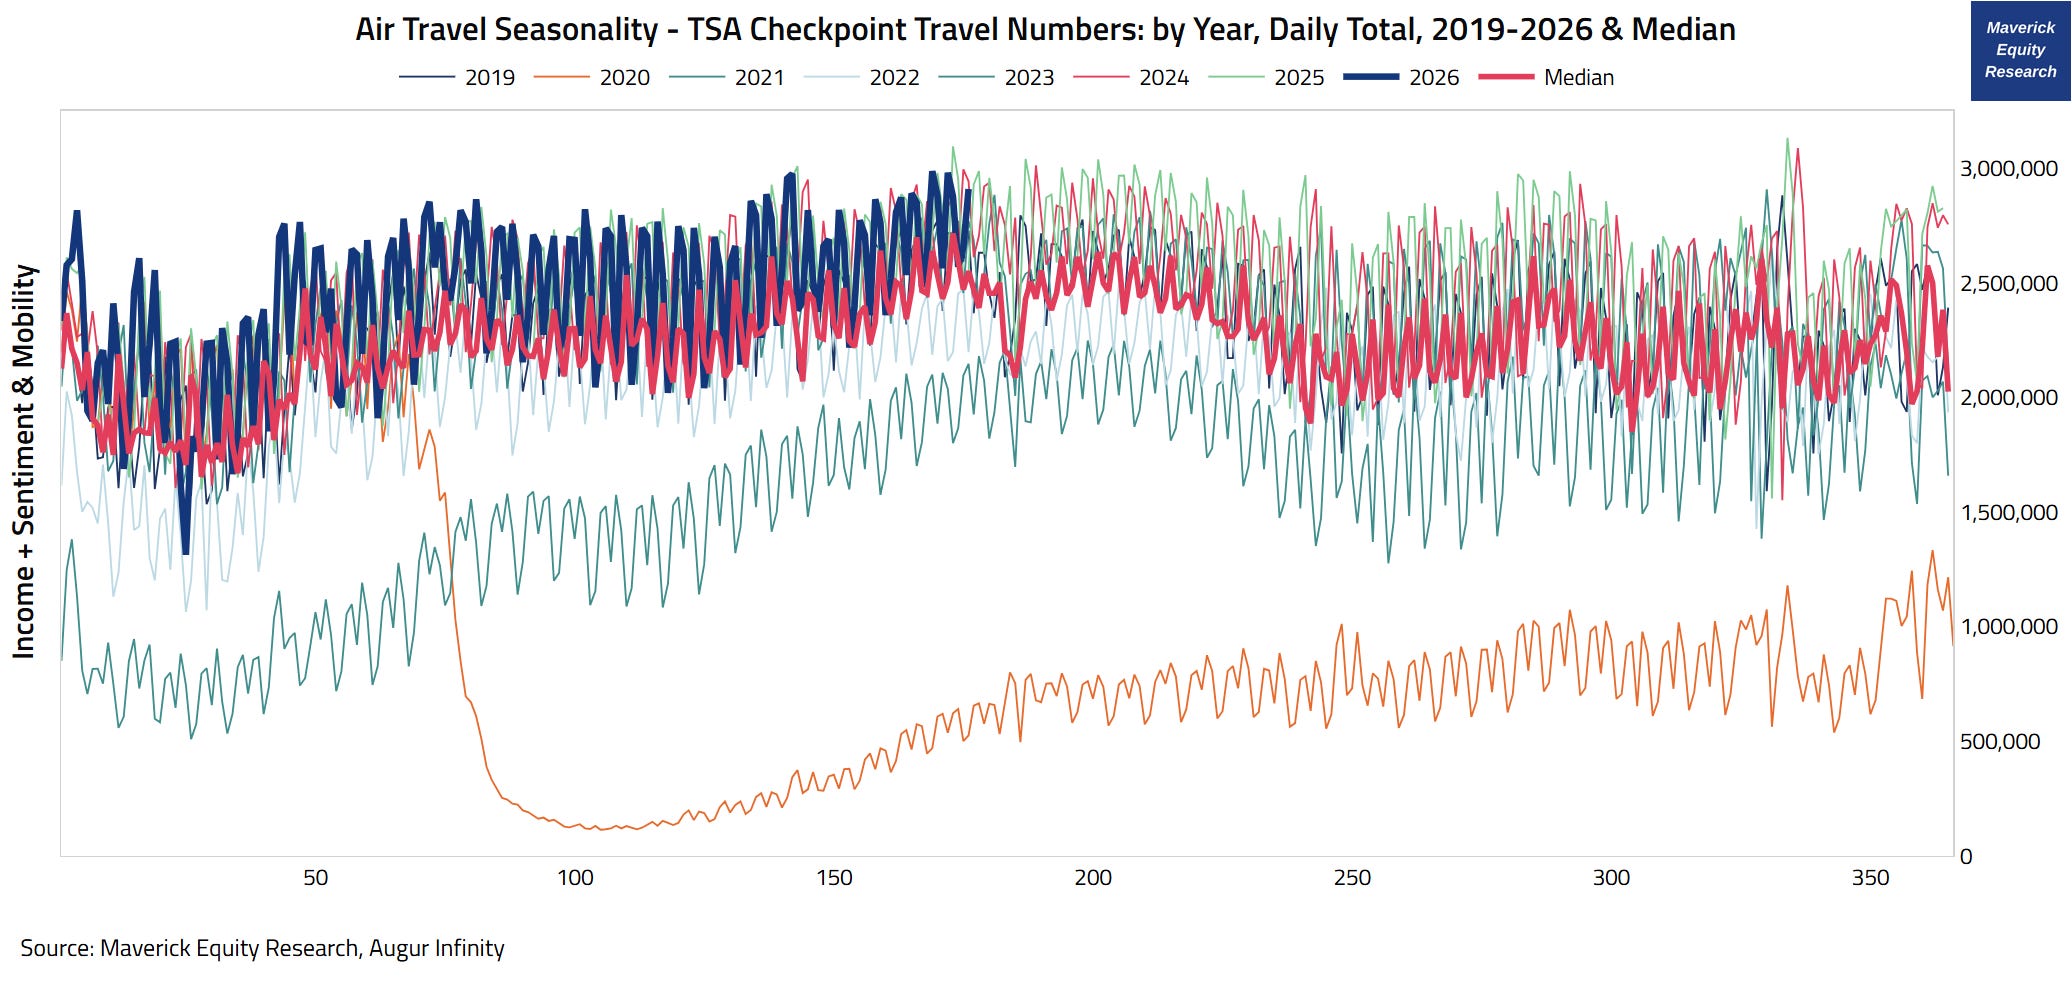
TSA Checkpoint Travel Numbers: by Year, Daily Total, 2019-2026 & Median, the same chart as before, but looking at the daily total values (not as a 7-day moving average) — the chart looks more ‘noisy’, but like this we see some nice highs that we had already in 2026, hence worth showcasing it also:
👉 27 days with above 2.7m daily passenger screenings
👉 16 days with even above 2.8m
👉 5 days with even above 2.9m
Context and insight:
Q: when did we have the all-time record? A: on July 7, 2024 with 3,013,413
I believe 2026 will break the current record!
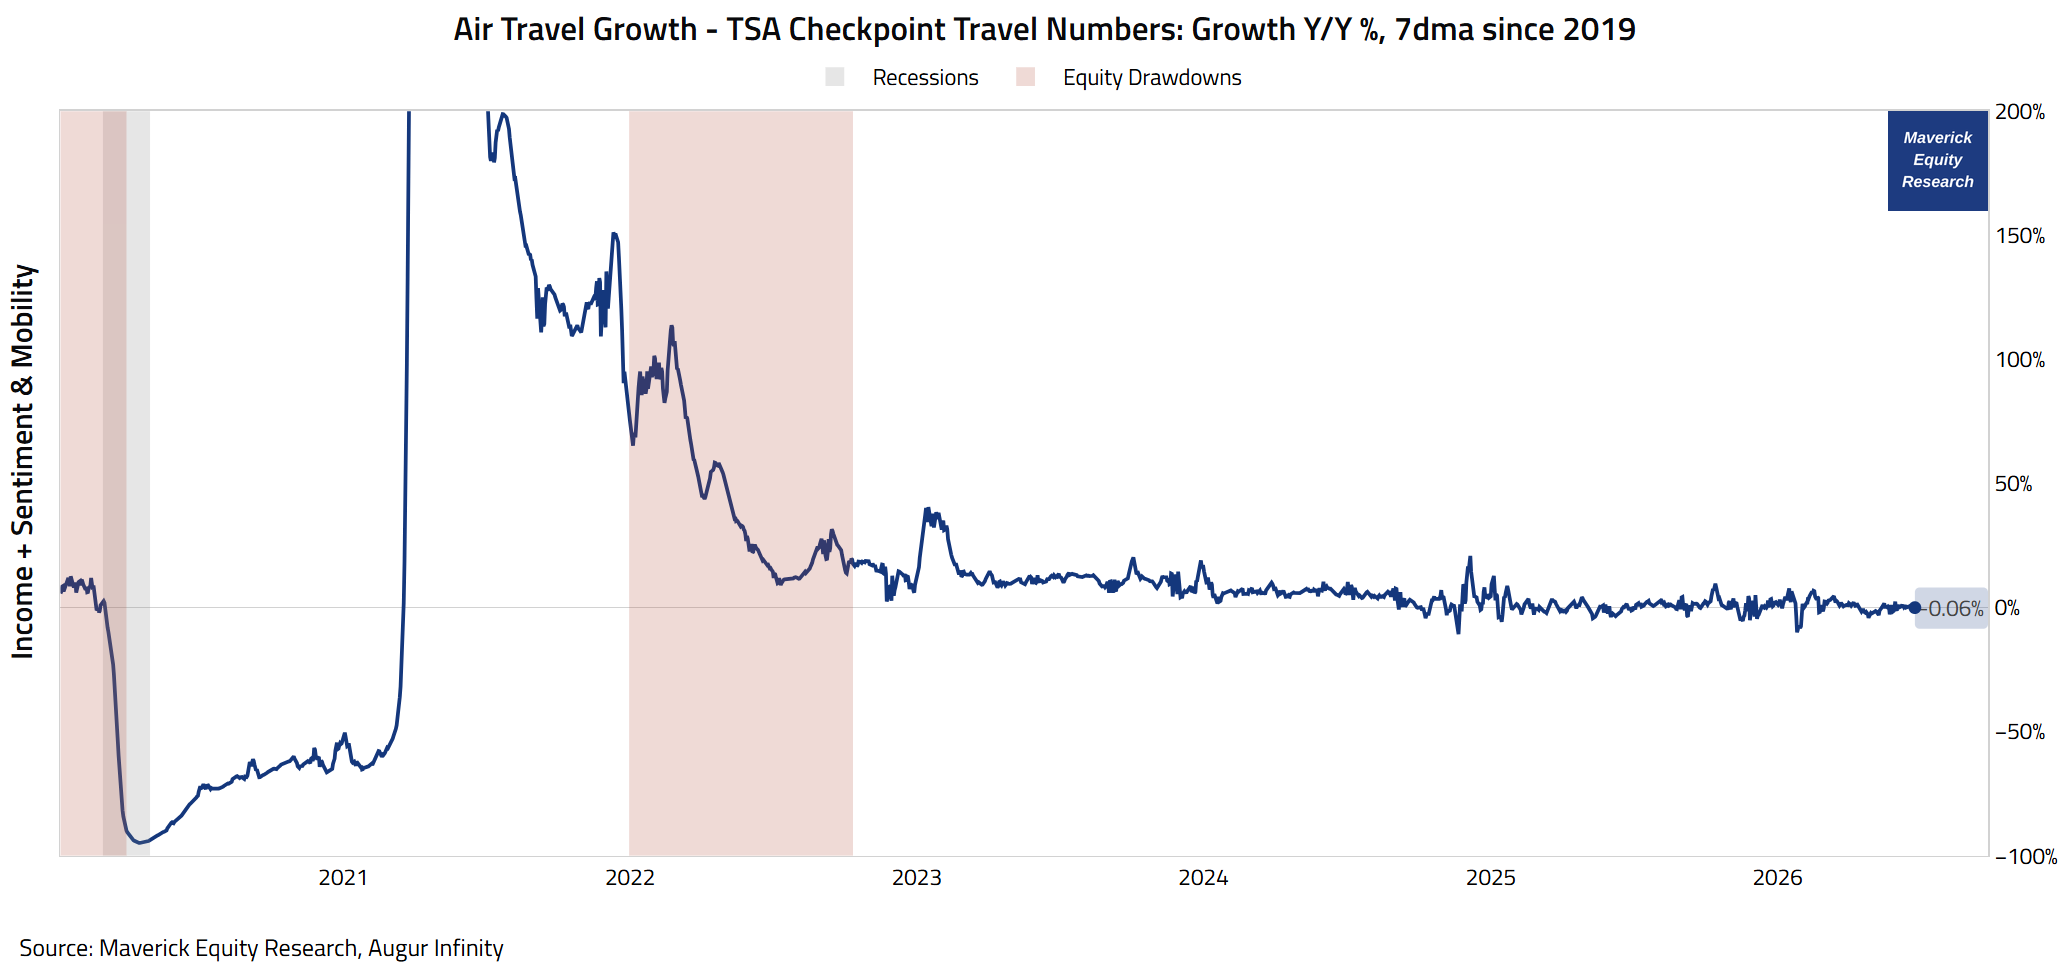
TSA Checkpoint Travel Numbers: Growth Y/Y %, 7dma since 2019, a view in order to capture Air Travel Growth Dynamics:
👉 +0.06%, some growth compared to last year is a good sign, especially given it is compared to an extraordinary good 2025
Maverick’s Net Take on Air Travel and Connecting the Dots:
👉 Business Cycle correlation:
given it is quite correlated with the business cycle, we can infer that the economy is currently doing quite well despite all the negative headlines, especially the latest ones regarding Iran, related oil prices and overall Geopolitical issues
overall a positive/bullish sign given that naturally this type of data is a decent proxy for income, sentiment & mobility!
👉 “K-shaped Economy”: given the presumably K-shaped economy with high inequality, can it be just ‘the rich’ travelling, and the middle & bottom staying at home?
the numbers are very strong, close to record levels, hence, if the situation were that bad, we would see consumers cutting back on flying which is a big discretionary expense — mobility is in the very fabric of being American: Americans have the travel bug and can afford to indulge it with relative ease
external dynamic: the numbers do not track just U.S. residents or domestic travelers, but also tourists, business travelers, U.S. citizens, and international visitors — hence, good developments given the importance of the U.S. consumer spending, and as well good international income, sentiment & mobility dynamics!
📊 Vehicle Miles Traveled: “Route 66, Baby!“
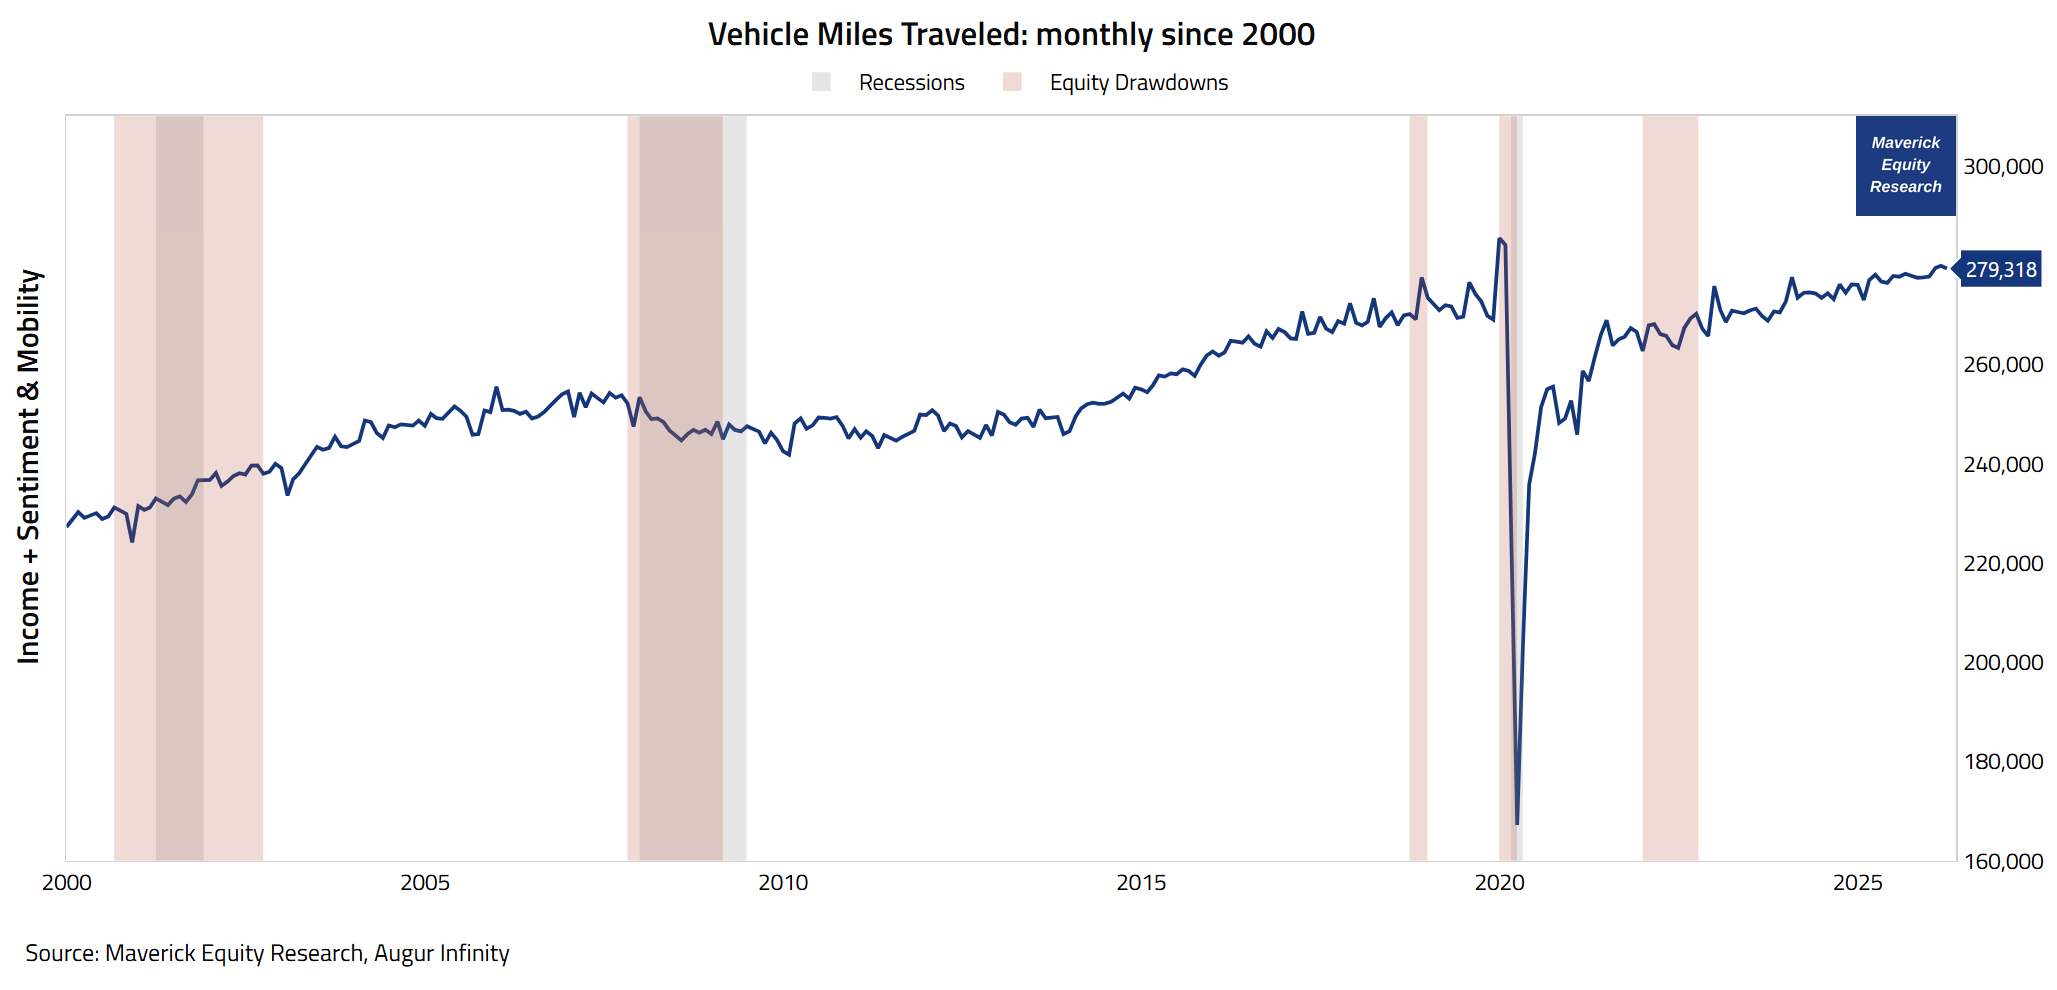
Vehicle Miles Traveled: monthly since 2000
👉 279,318 in April 2026, trending up nicely, hence another good sign
👉 285,452 was the all-time high at the end of 2019, just right before the 2020 Covid
It is very likely we make another all-time high this year!
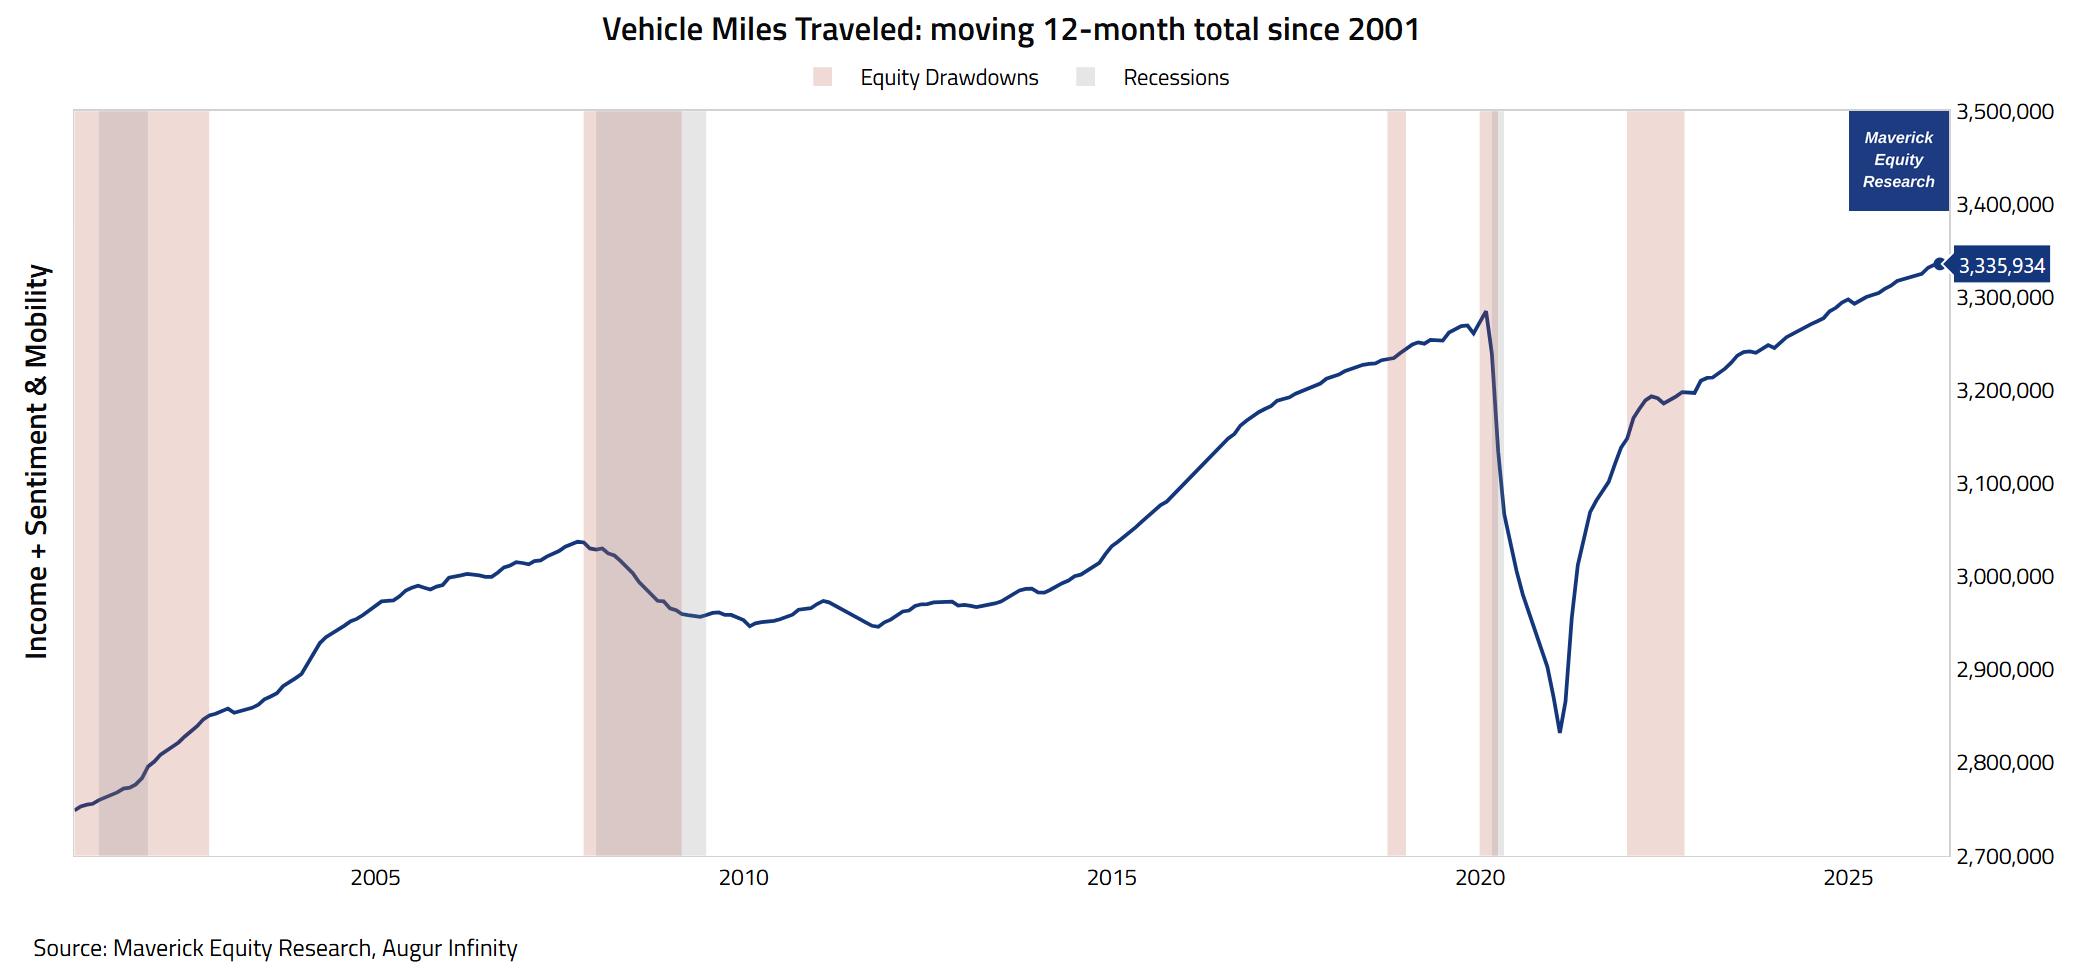
Vehicle Miles Traveled: moving 12-month total since 2001
👉 3,335,934 when we have the data as a moving 12-month total (rolling sum)
👉 that is already way above the all-time high of 3,285,170 from the end of 2019 — we actually broke that all-time high already in November 2024
Overall, 2026 is showing a great continuation of the uptrend!
📊 Retail Sales: “Take Me Shopping, Baby!“
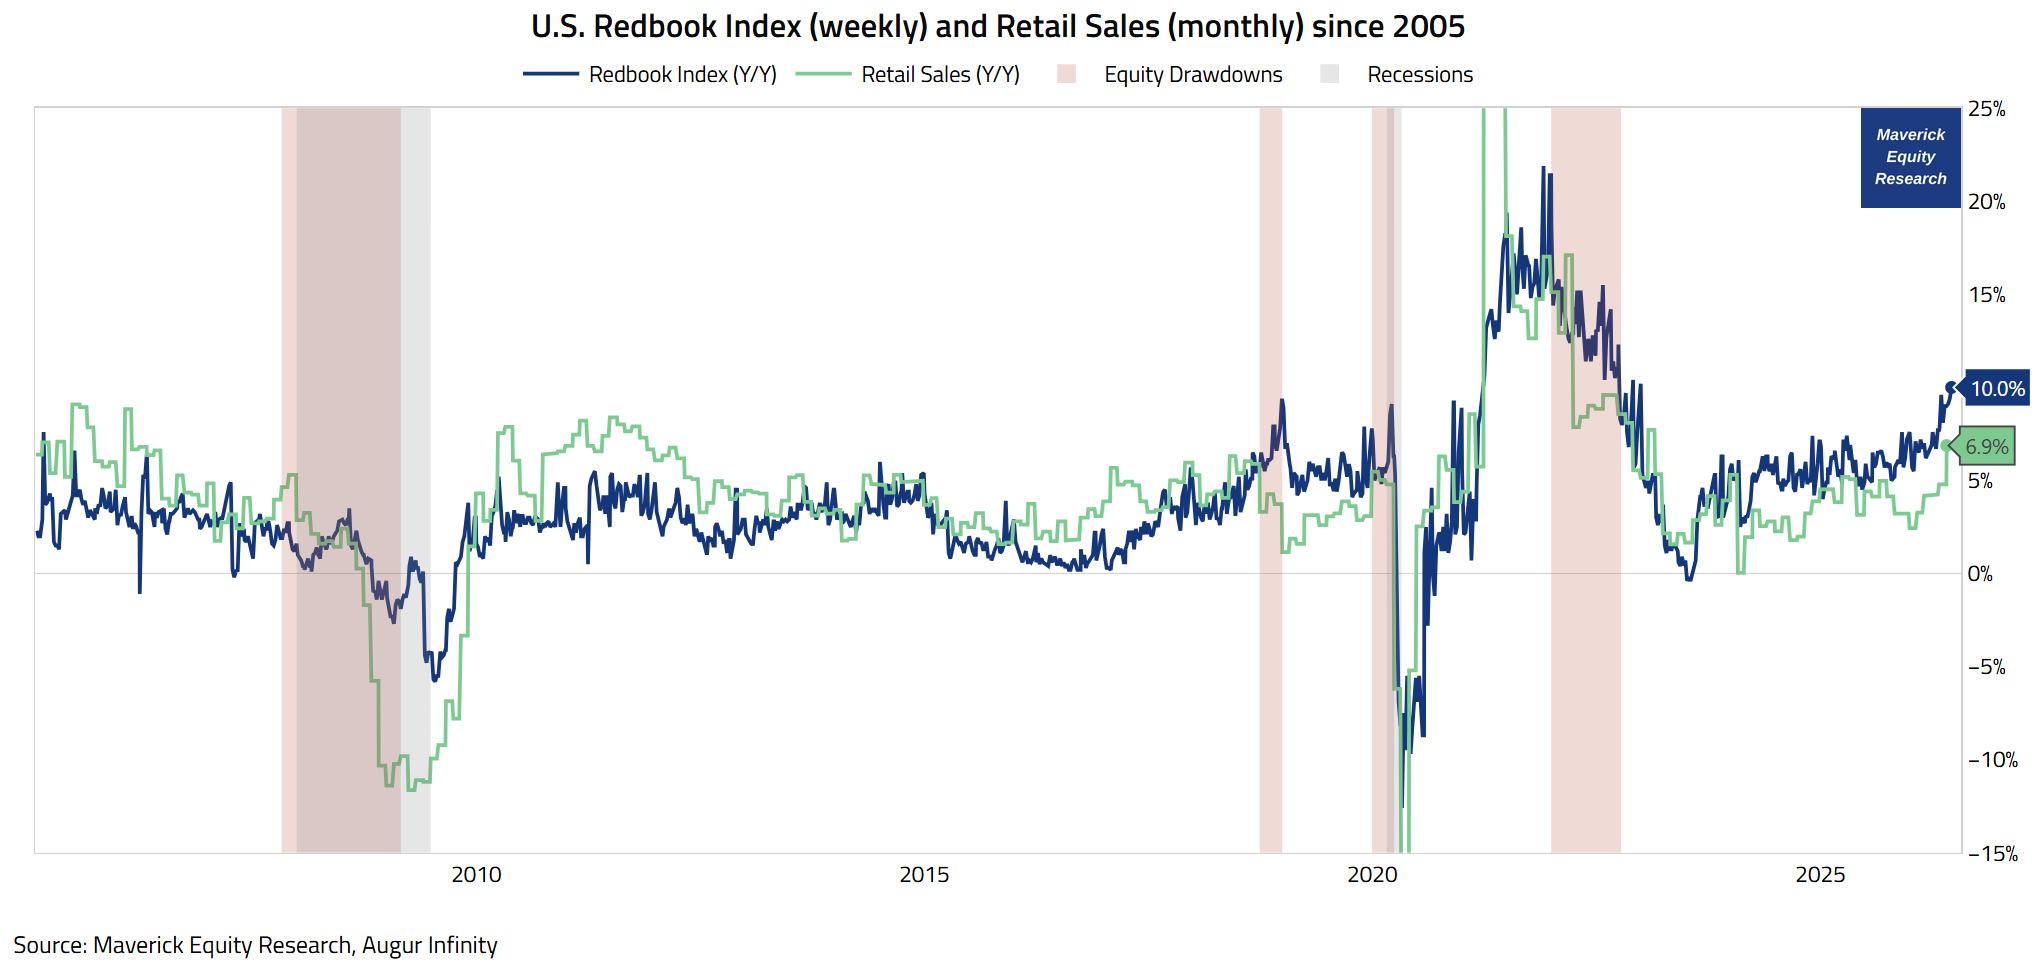
U.S. Retail Sales: Redbook (weekly) and Census (monthly) since 2005 along with recessions and stock bear markets to guide us:
👉 Redbook Index = same-store retail sales (9,000 general merchandise retailers with over 80% of retail sales, excludes gas stations sales) continues to show solid strength:
+10% YoY for the week ending June 20, after 9.4% in the previous week
well above the historical 3.8% average and close to a four-year high
👉 Retail Sales = picking up pace also at 6.9% YoY for May 2026 (June 17th release)
N.B. Redbook Retail Sales Index:
it is a timely demand-side indicator answering, and it answers how much households are spending at retail stores (in relative terms %) — in other words, it tells us whether consumers are showing up and buying
as a weekly time series, it tracks earlier the shifts in consumer demand — hence, it is leading the classic Census Retail Sales economic data
📊 Credit & Debit Card Spending — “Spend, Baby, Spend!”
In order to capture consumers’ both Income + Sentiment at once, a great way is looking at Debit + Credit Cards Spending data.
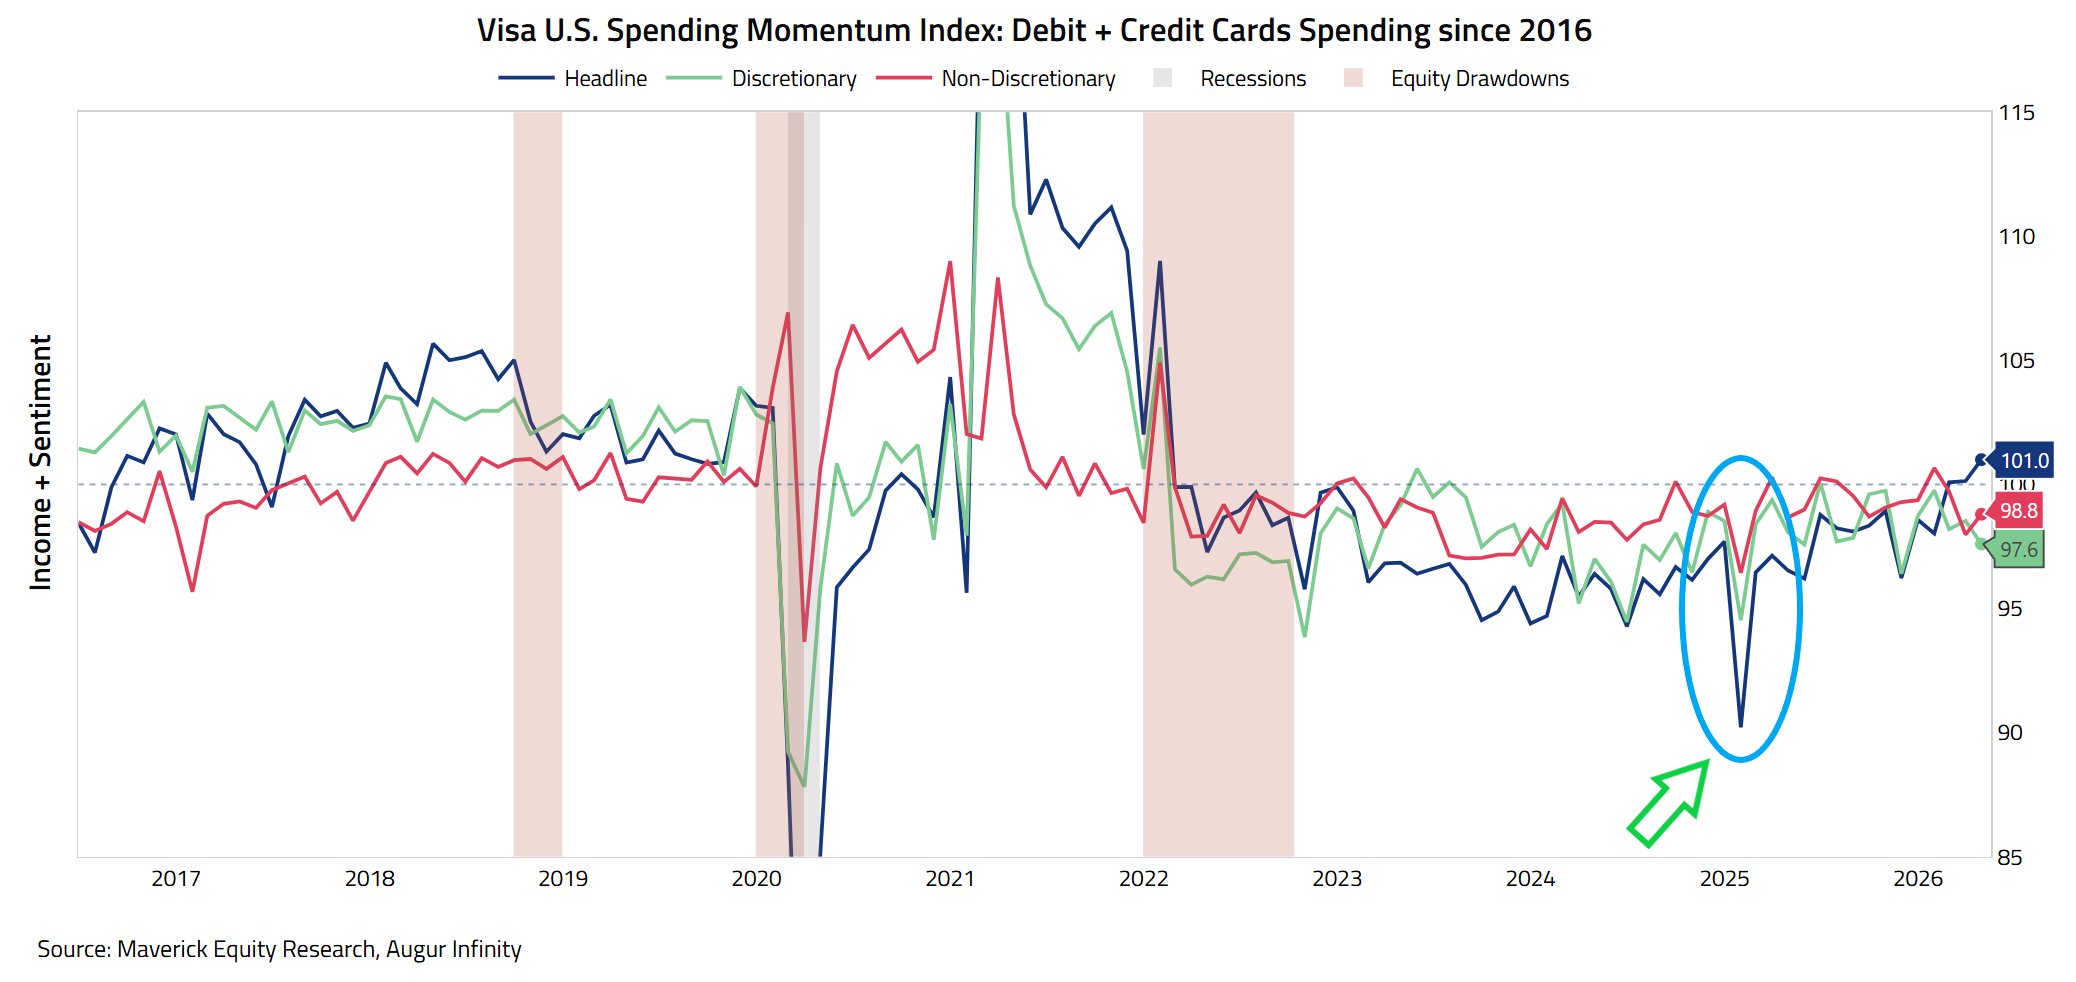
Visa Spending Momentum Index: Debit + Credit Cards Spending with headline (blue) + discretionary (green) & non-discretionary spending (red), monthly data:
👉 100.1 in May 2026 (blue), decent reading indicating broad-based net acceleration in economic momentum as consumer spending is strengthening Y-o-Y % — both discretionary (green) at 97.6, and non-discretionary (red) at 98.8 being very close to 100
👉 2025 Trade War 2.0 with quite a dip to 90, yet the rebound was also strong
Overall, good rising consumer spending momentum relative to the previous year — hence, good news on this front as well, complementary to the Air Travel dynamics!
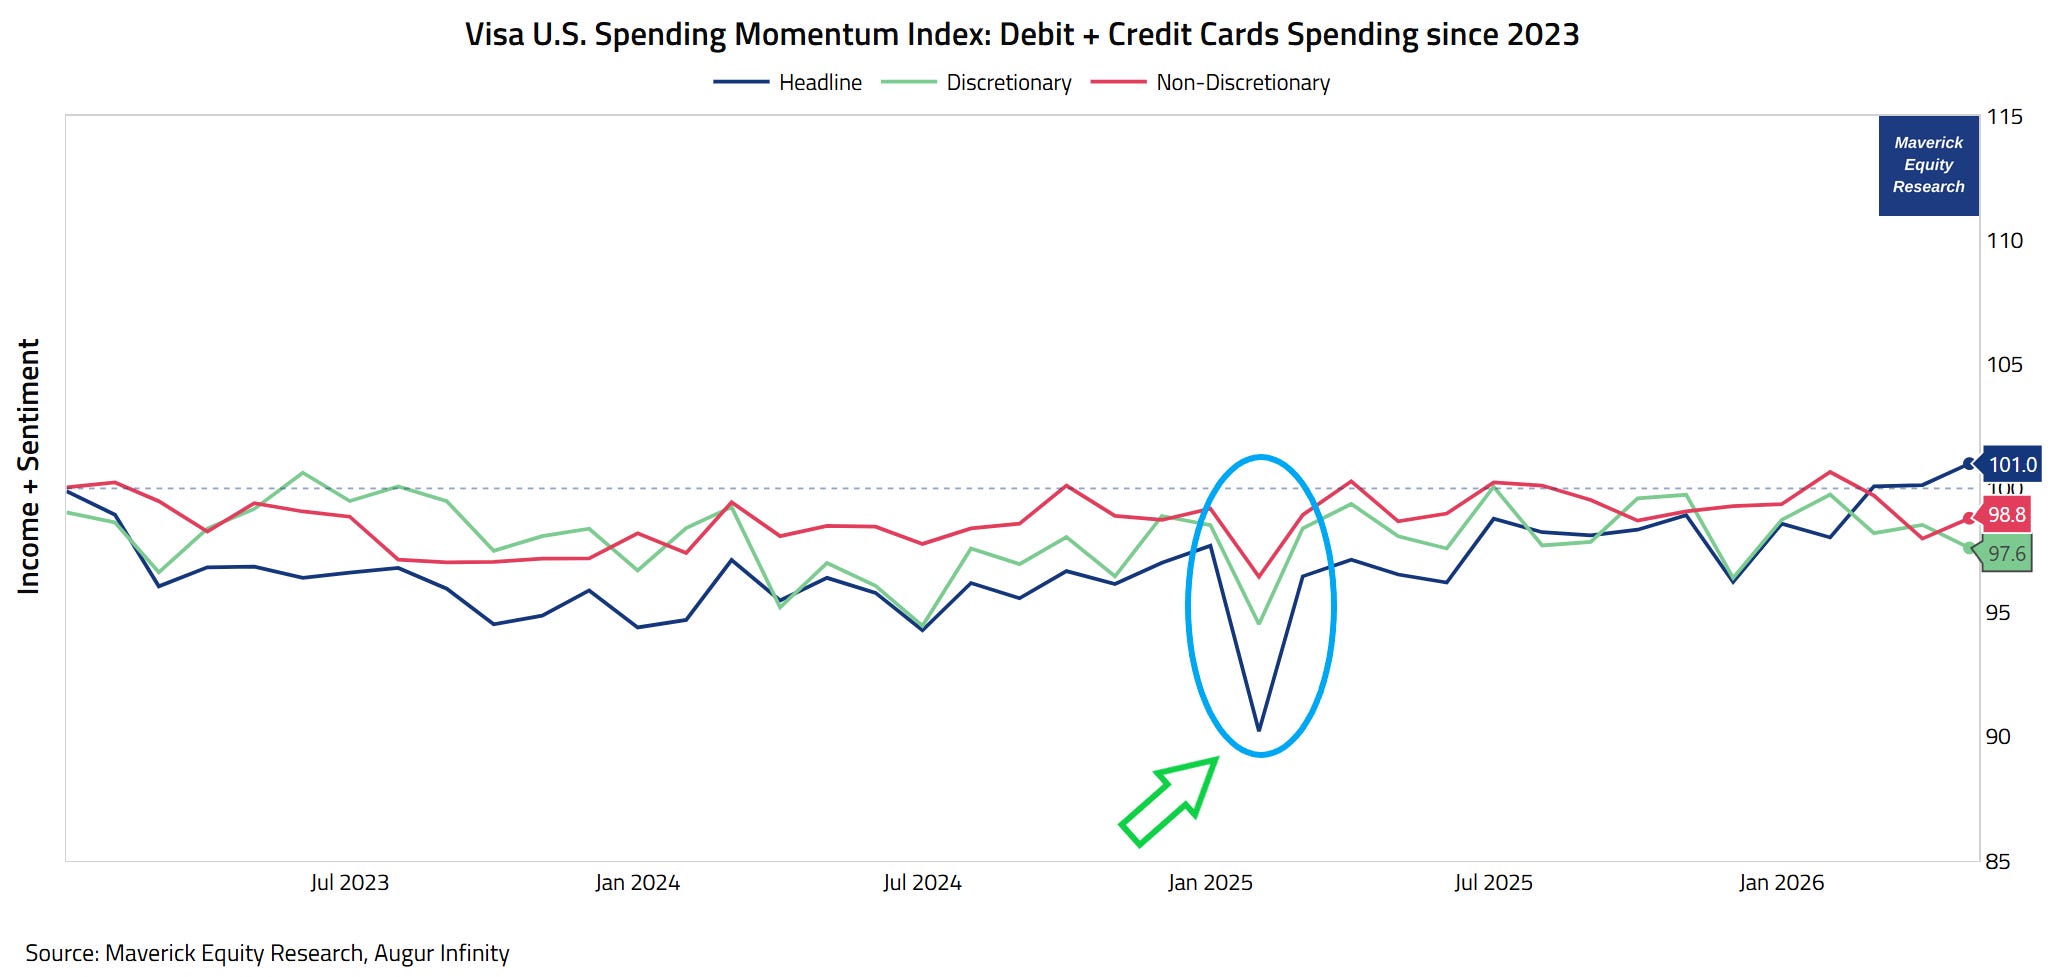
Complementary, the same chart zoomed in since 2023:
👉 the Trade War 2.0 dip is seen better, and so is the recovery back to above 100
📊 OpenTable Seated Diners: “Whining & Starving!“ vs “Wining & Dining!”
In order to capture consumers’ both Income + Sentiment at once, another sleek way is looking at the seated diners online reservations dynamic.
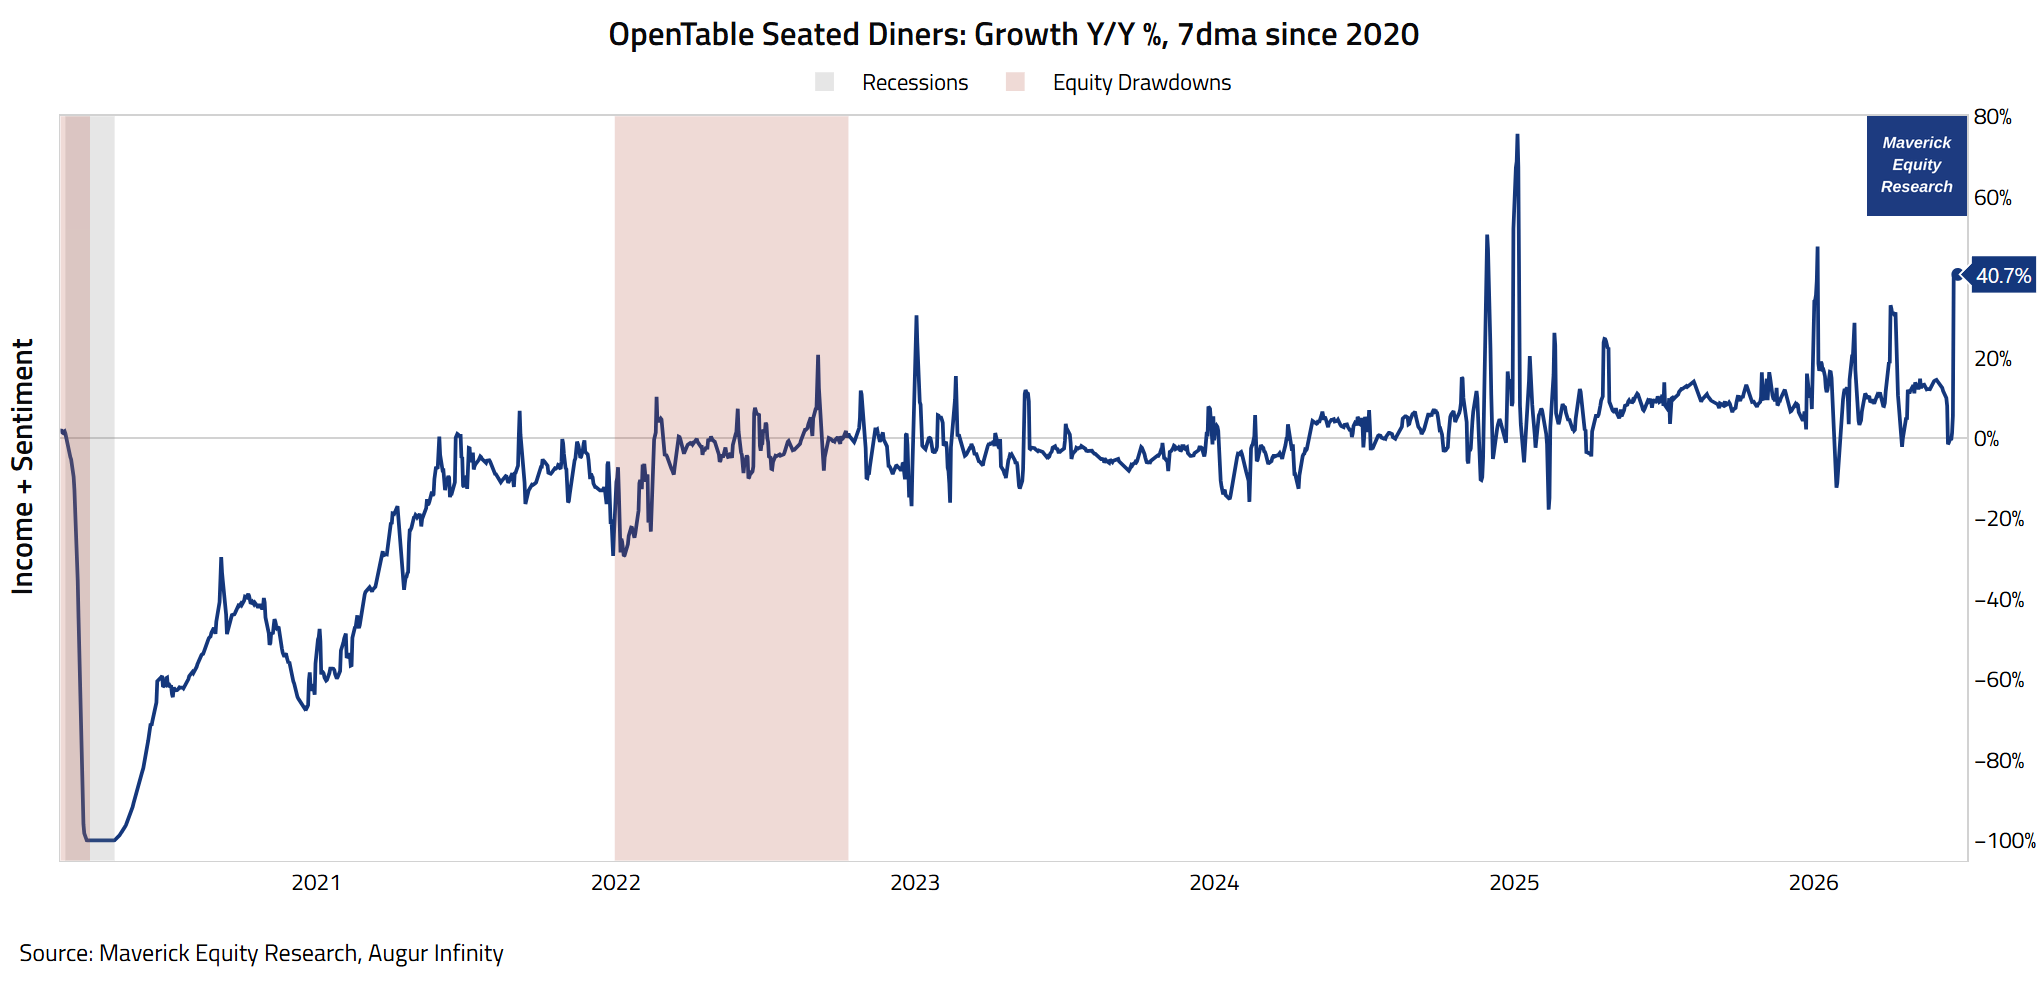
OpenTable Seated Diners: Growth Y/Y %, 7dma since 2020
👉 +40.7% growth for online reservations = a very strong reading with a recent uptick ahead of the 4th of July (via the latest fresh number from just 2 days ago, 26th of June)
👉 as a high-frequency proxy for consumer sentiment and demand in the restaurant sector, good growth indicates stronger discretionary spending, more foot traffic, and better near-term conditions for hospitality businesses
👉 a useful read on the broader services economy, especially as it reflects reservations data that are highly informative for trend changes BEFORE they show up in official monthly retail or services data
👉 hence, it can also be seen as a Leading Indicator through its timely daily values!
📊 Box Office Top 10 Grossing Films: “It’s Showtime, Baby!”
In order to capture consumers’ both Income + Sentiment at once, another sleek way is looking at Box Office revenue numbers.
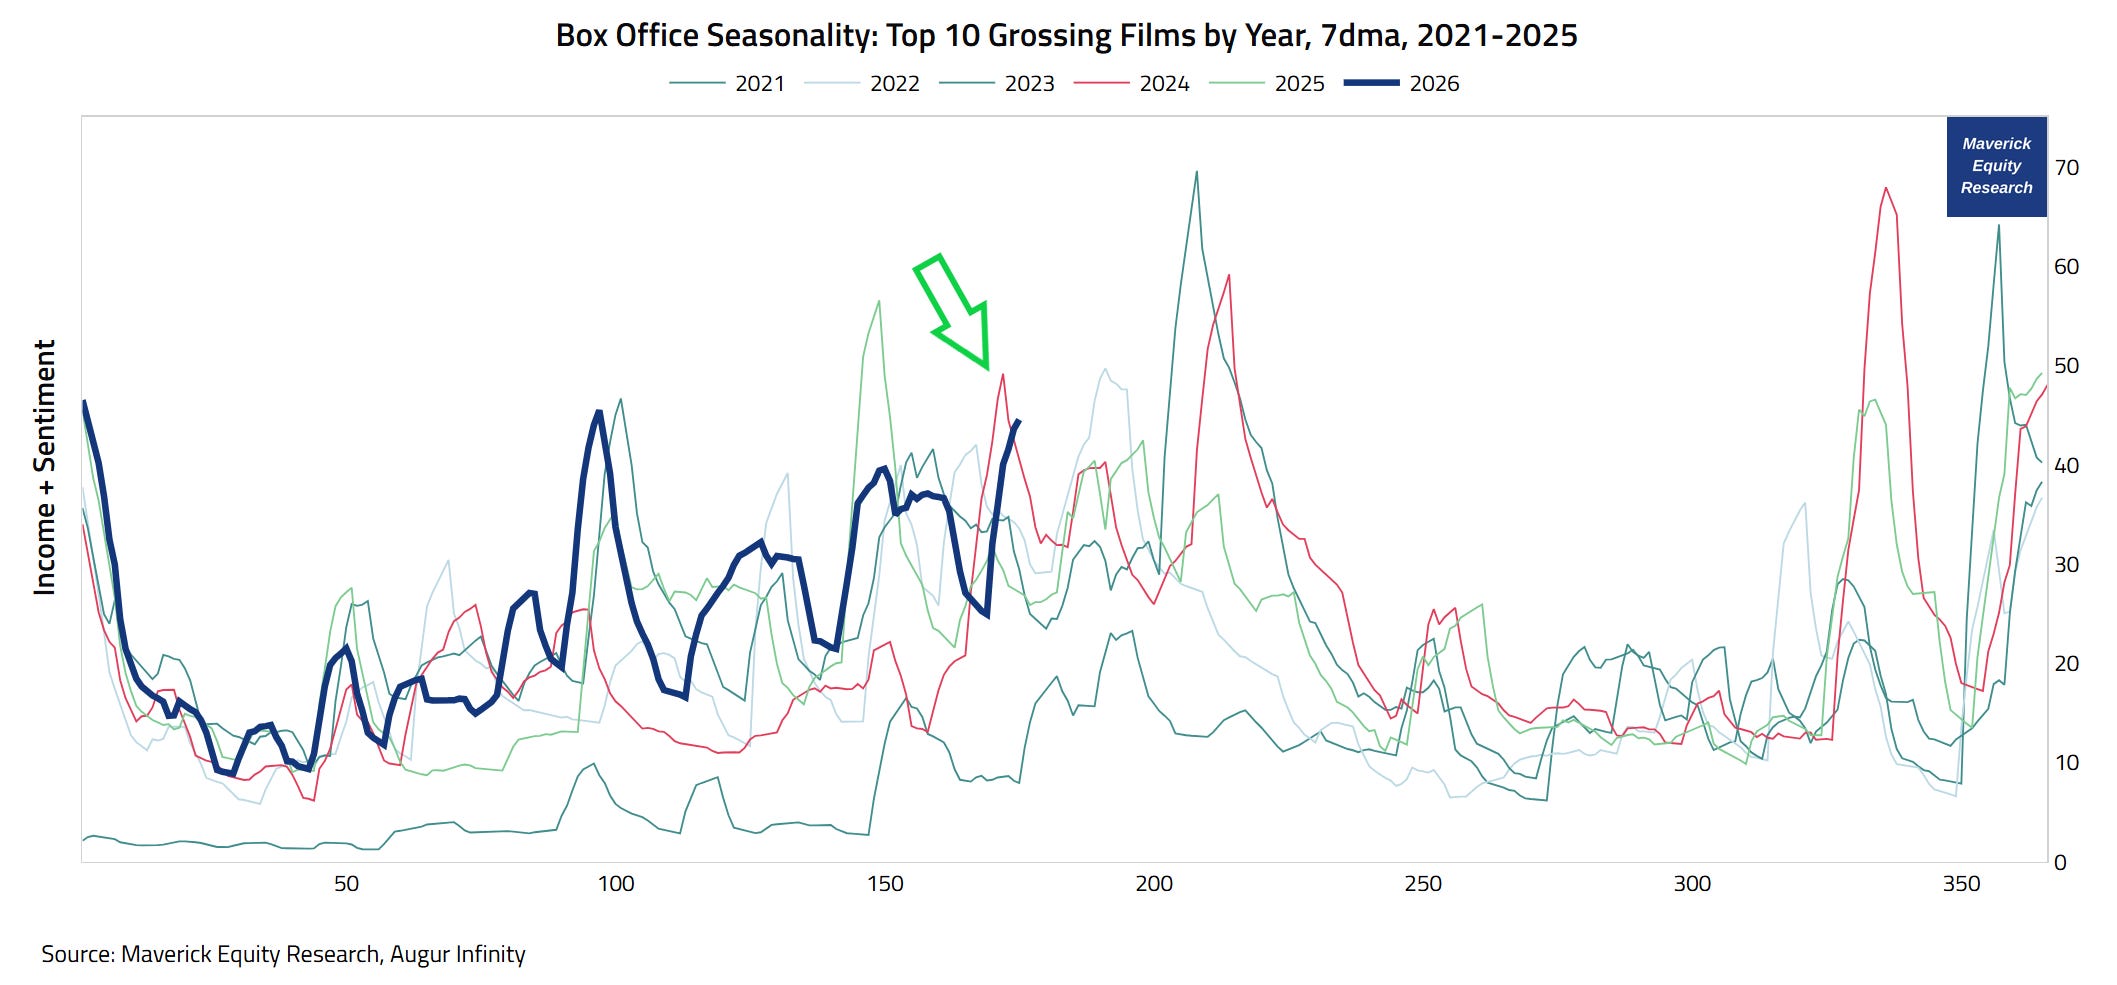
Box Office Seasonality: Top 10 Grossing Films (7dma, 2021-2025):
👉 2026 (blue), another good year topping most previous years (via the latest fresh number from just 4 days ago, 24th of June)
👉 pointing to robust discretionary demand, and a very strong consumer appetite for out-of-home entertainment
👉 as a high-frequency proxy for consumer demand in the entertainment sector, it can also be seen as a Leading Indicator through its timely daily values — hence, warranting close monitoring for big swings alongside other complementary metrics
Business
📊 New Business formation: “It’s Personal & Business, Skin In The Game, Baby”
The key to a vibrant and flexible economy is its entrepreneurship, risk appetite, business dynamism as it can signal healthier expectations about demand, easier access to financing, and confidence among consumers and prospective entrepreneurs.
Hence, for Leading Indicators we also look at entrepreneurial & new business formation activity where there are various key measures — we will start from the general one, to a headline type, and ultimately to a valuable high signal one!
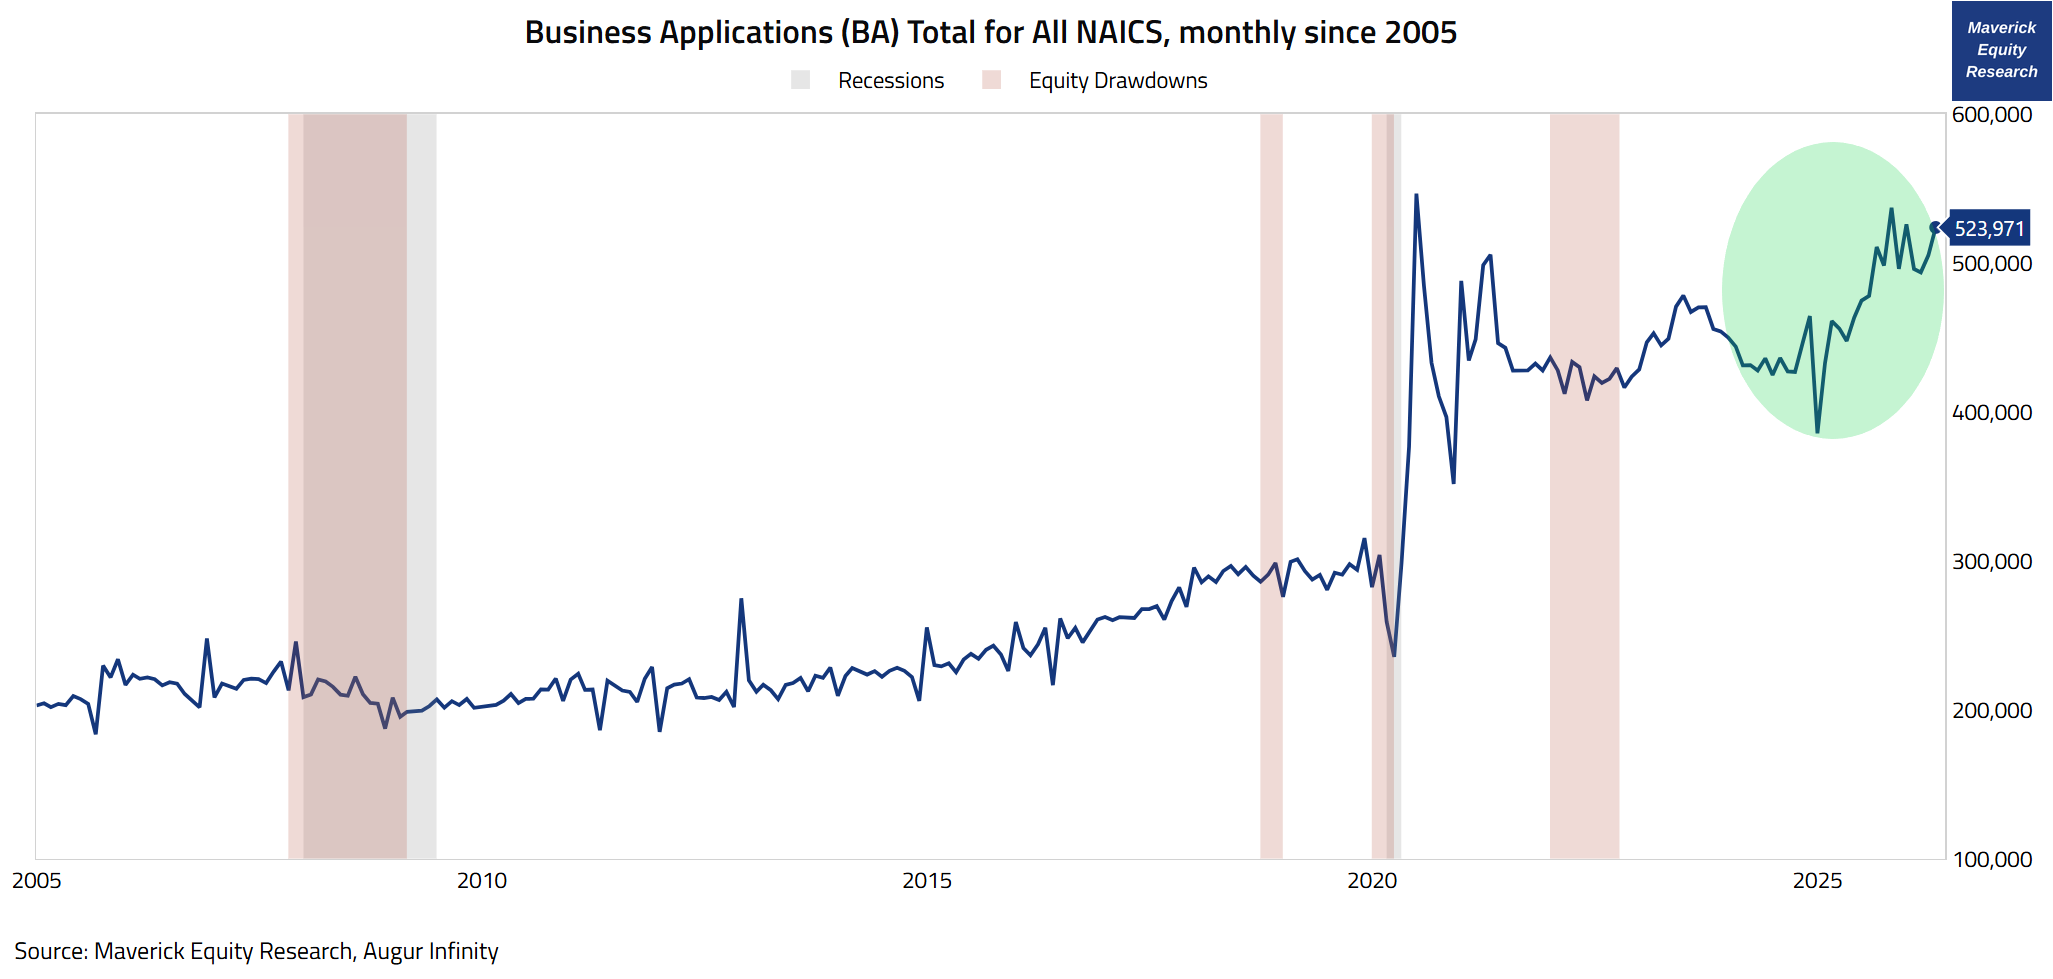
Business Applications (BA) Total for All NAICS, monthly since 2005:
👉 523,9711 new business applications for May 2026
👉 +3.71% from April 2026, and +17.04% compared to last year May 2025
For the past 6 months, we are averaging +500,000, and if we maintain this pace (very likely), we will have 6 million new potential start-ups in 2026 which are very good numbers — 10 years ago in 2016 the average was +250,000 for 3 million!
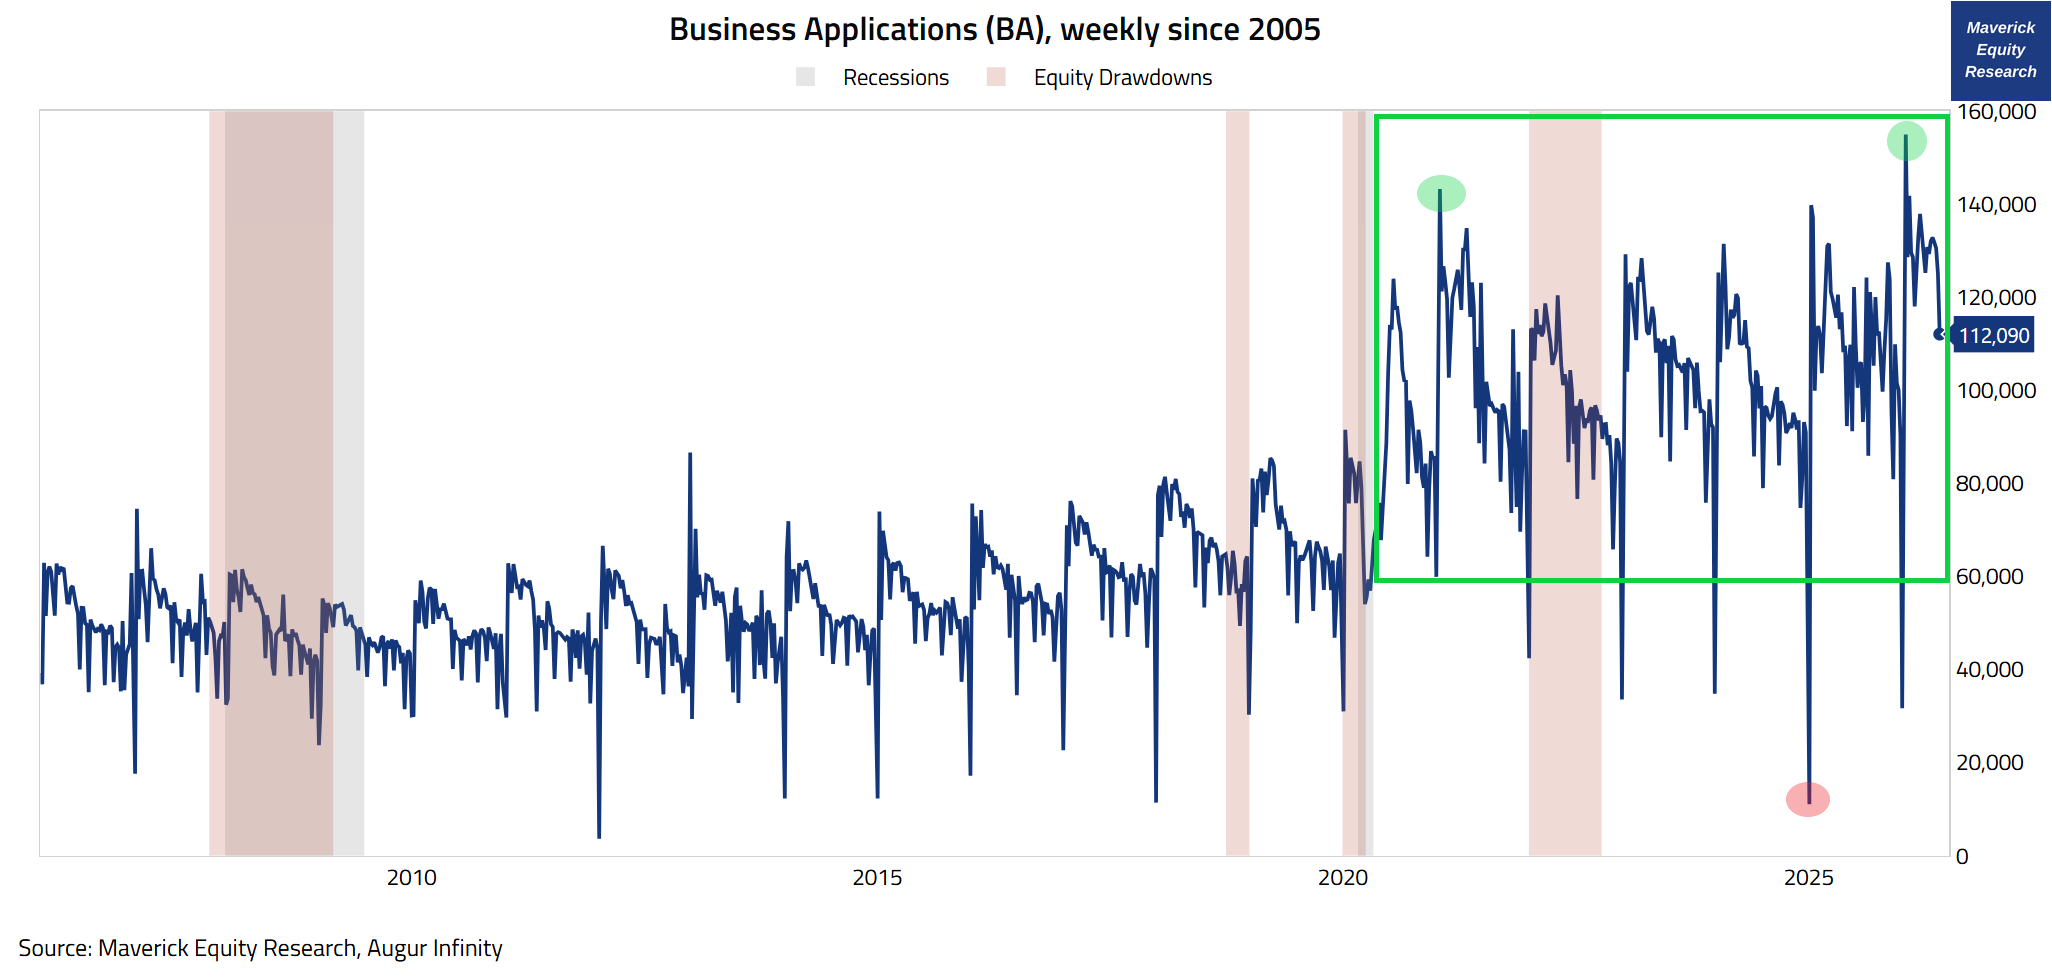
Progressing from the total monthly business applications, to a headline more cleaner and weekly measure of new applications which excludes certain non-business filings (tax liens, estates, trusts, and certain financial filings).
Business Applications (BA), weekly since 2005:
👉 112,090 new business applications for May 2026, and 155,020 as an all-time high recently in January 2026 (a weekly data series, hence more granularity while still released monthly)
👉 it did surpass the 2021 madness when the post-Covid recovery started, and note also the 2025 Trade War 2.0 dip, but also the very fast recovery!
👉 qualitatively, this tells us not just that “someone filed business paperwork” but “someone filed business paperwork with a decent chance of becoming a payroll business”
Hence, as a subset of the previous Total Business Applications (BA), economically this is a better series for judging real business formation!
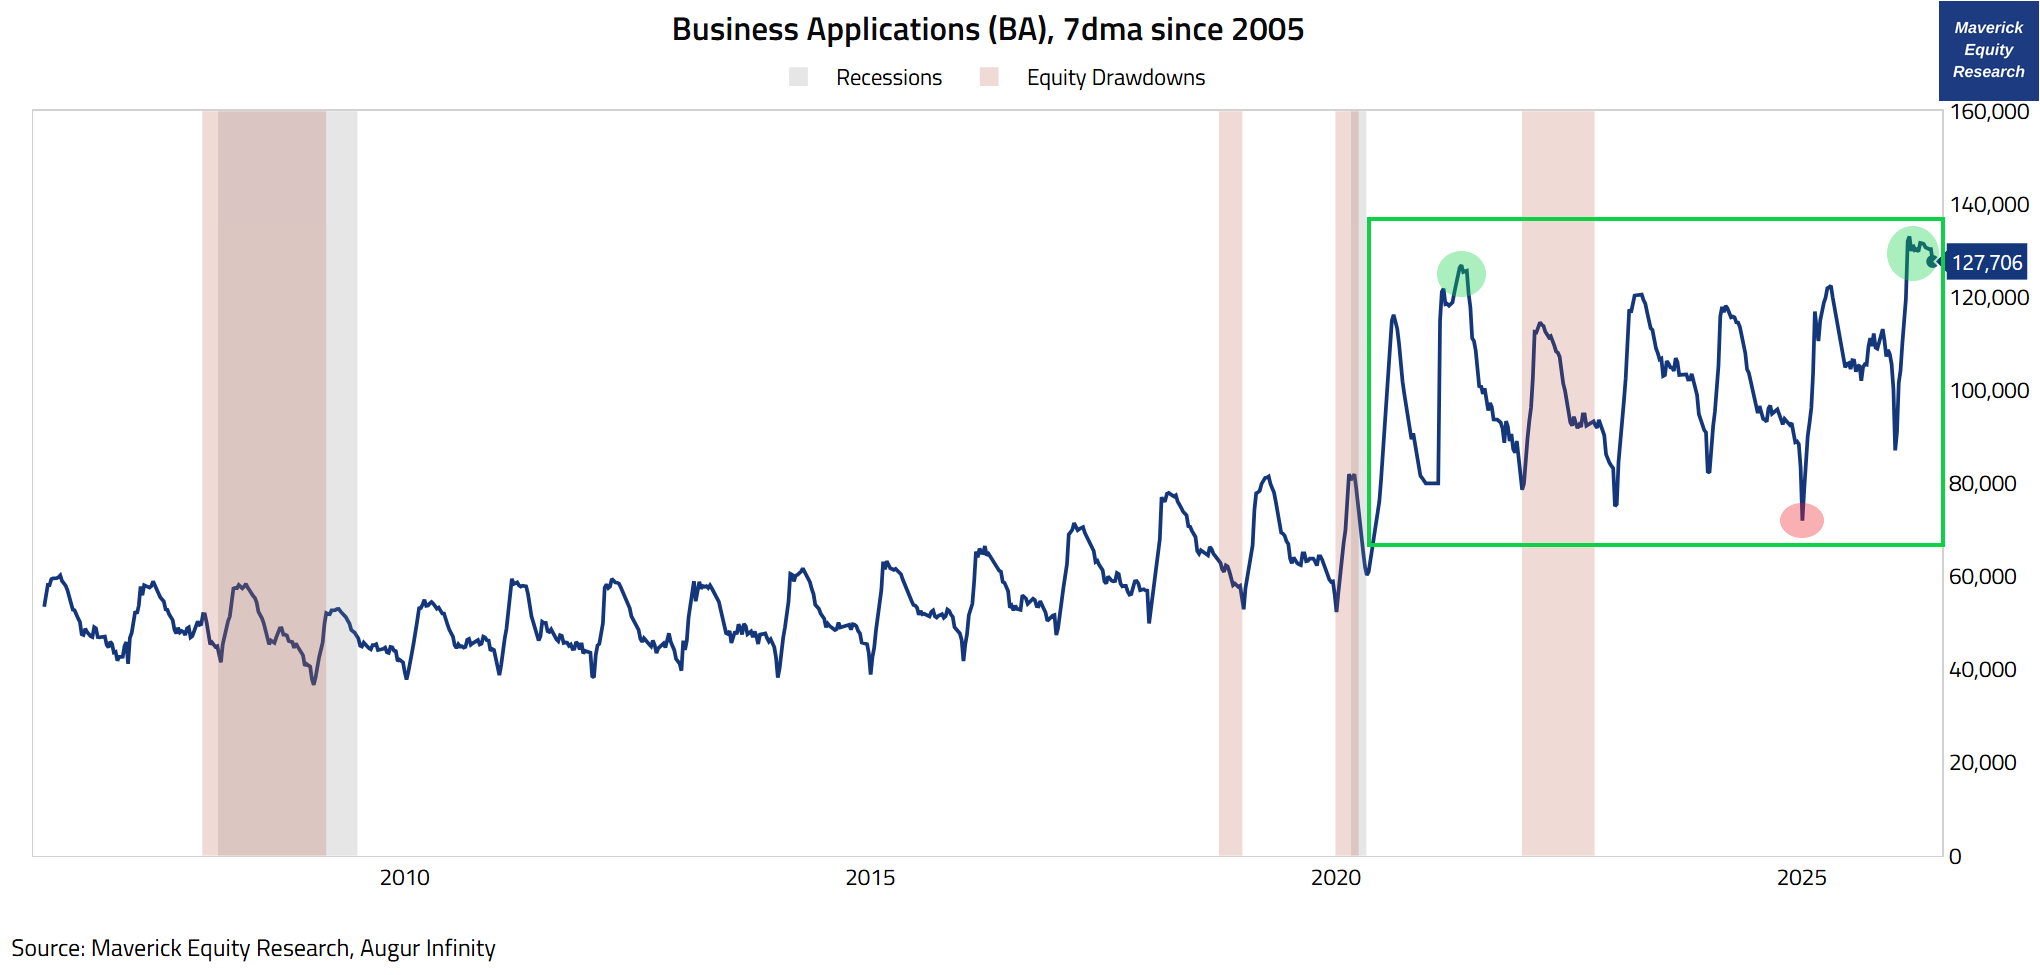
You might have noticed the regularity of seasonal variations through each year which is not ideal — hence for a ‘smoother’ and less ‘noisy’ view, the same chart but with a 7-day moving average (not the weekly raw data series):
Business Applications (BA), 7dma since 2005:
👉 127,706 for May 2026, close to the very recent all-time high of 133,083 reached in February 2026, and with a great recovery after that 2025 Trade War 2.0 dip
👉 overall, the recent dynamic become very strong after the 2020 pandemic-related recession — with more than 100,000 new applications becoming rather the norm
👉 close to all-time highs, it signals further new business formation momentum, which can be supportive for future hiring, capex, and local overall economic activity
👉 in general, an erratic behavior is quite natural as an economy reassesses, recovers, shedding weak businesses during the recession & regaining new ones in the recovery
👉 key note: this pattern is stronger than usual this time around as it seems there’s some reorganization happening in the labor market through AI and the "Gig Economy"
Overall, the recent stronger pattern is very encouraging. It signals we entered into a higher base level of business dynamism which would be structurally great over the medium to long term for the U.S. economy!
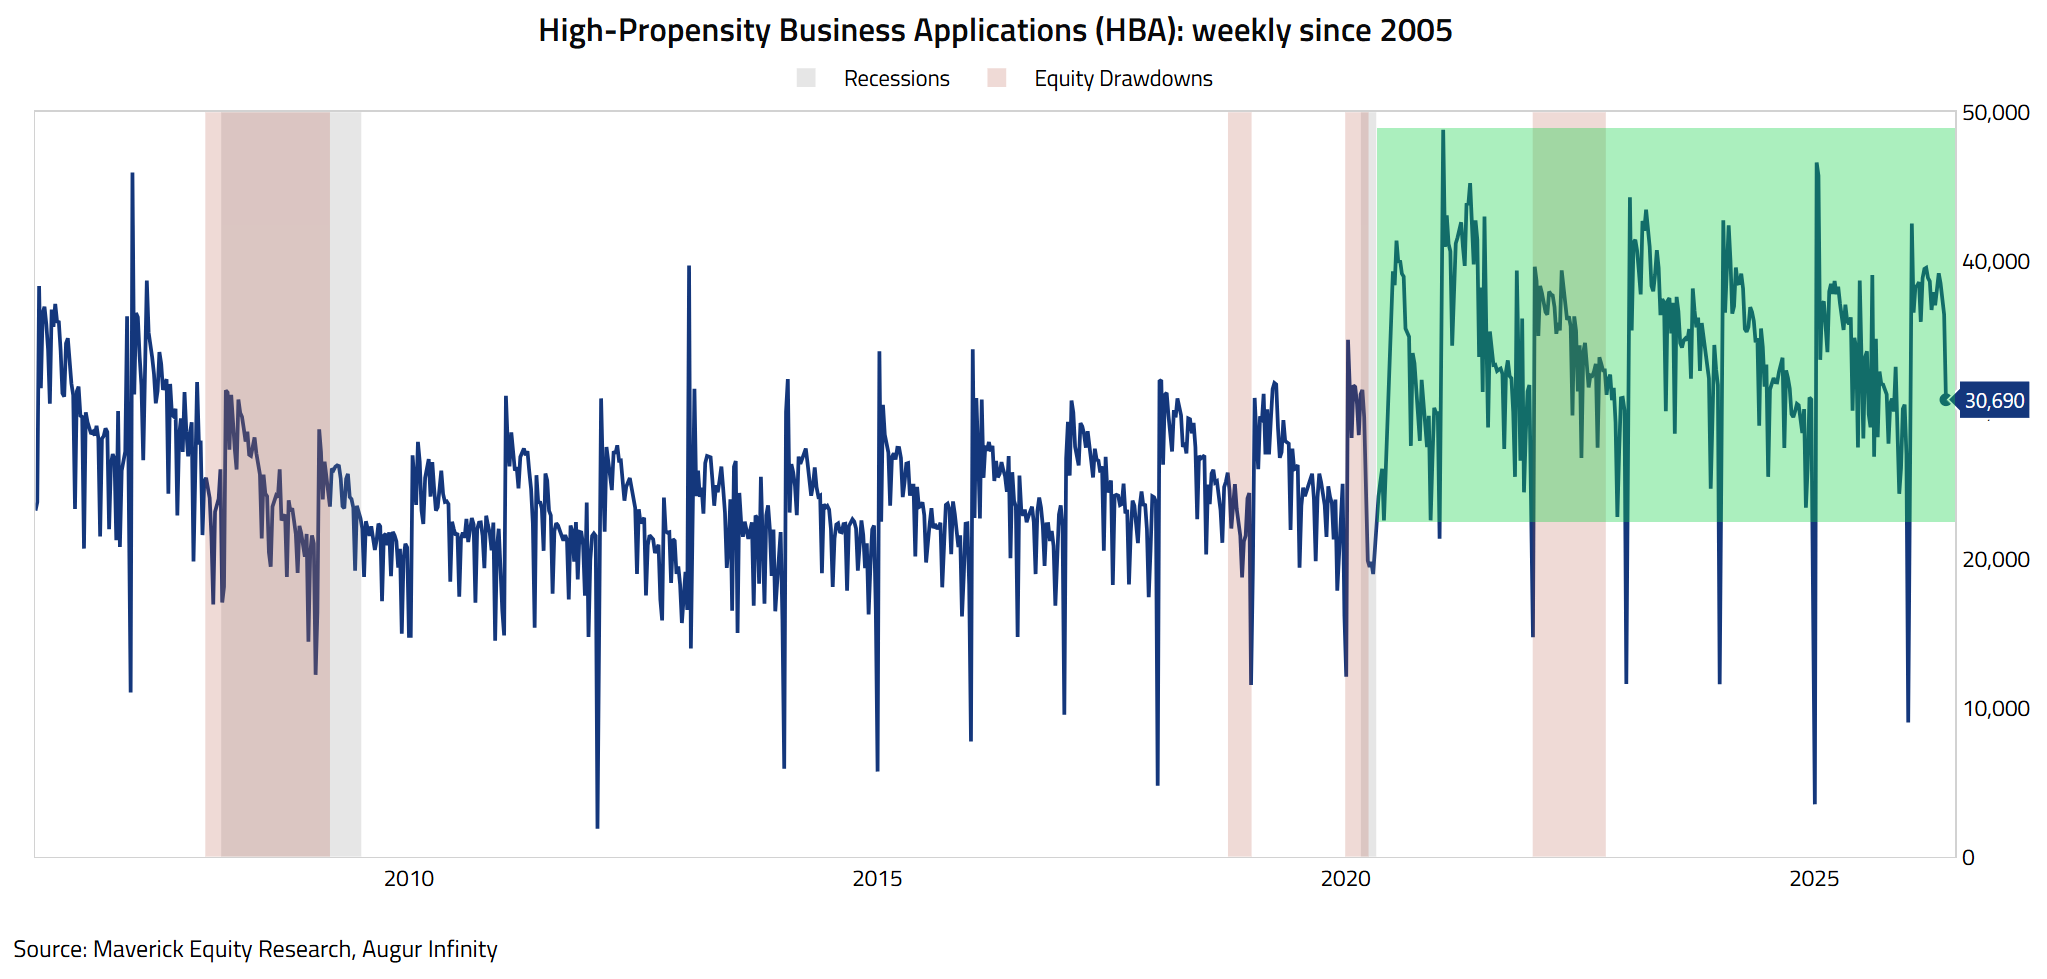
Progressing further, we go deeper, or as some say more ‘granular’, and we look at:
High-Propensity Business Applications (HBA), weekly since 2005:
👉 the key word here is “High-Propensity“ which we can define as a “High-Probability“ of a business application turning into a real active business with a payroll — in other words, it is not just signaling “someone filed business paperwork” for a new business, but “someone filed business paperwork with a stronger chance of becoming a payroll business”
👉 30,690 new high-propensity business applications for May 2026 — solid readings in 2026, and since 2020, many readings have been above 30,000, even 40,000, also signaling we have a new higher base level
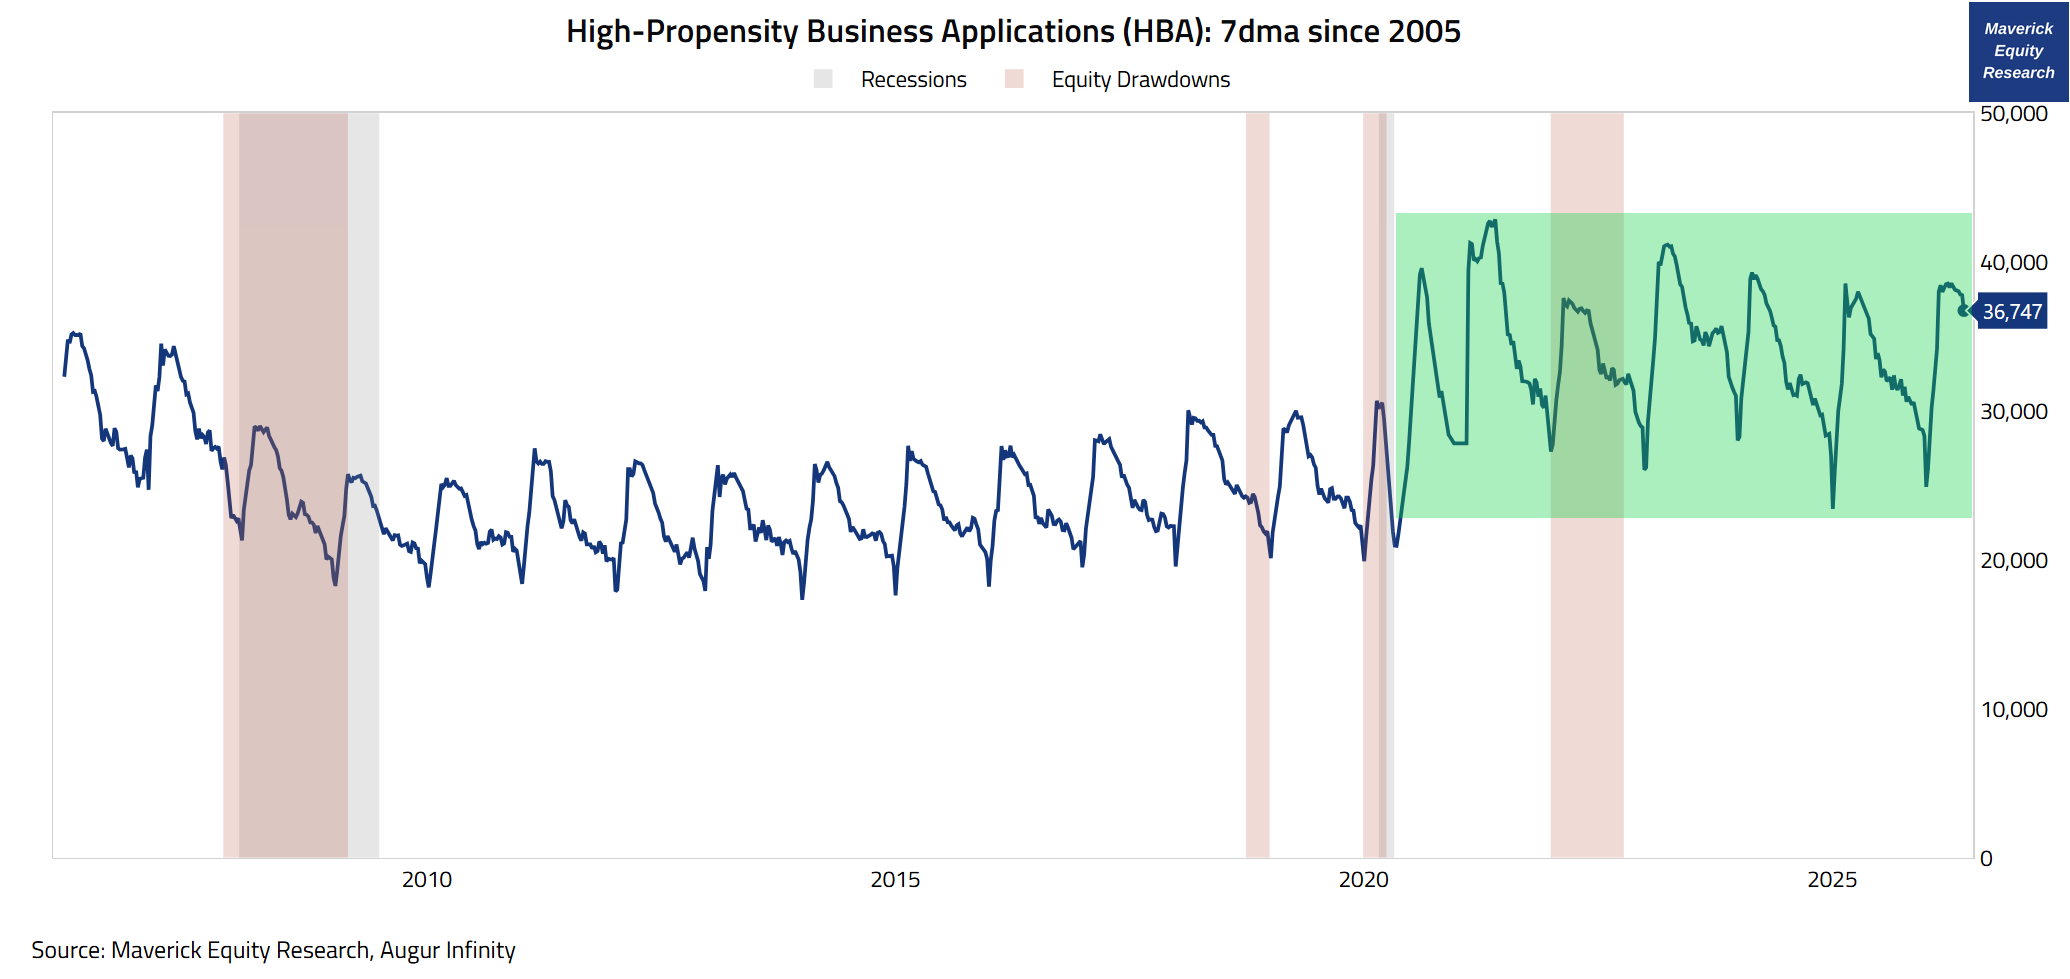
High-Propensity Business Applications (HBA), 7dma since 2005:
👉 38,091 same chart as before, but as a 7-day moving average as it looks less ‘noisy’
👉 the new higher base level is now even more evident!
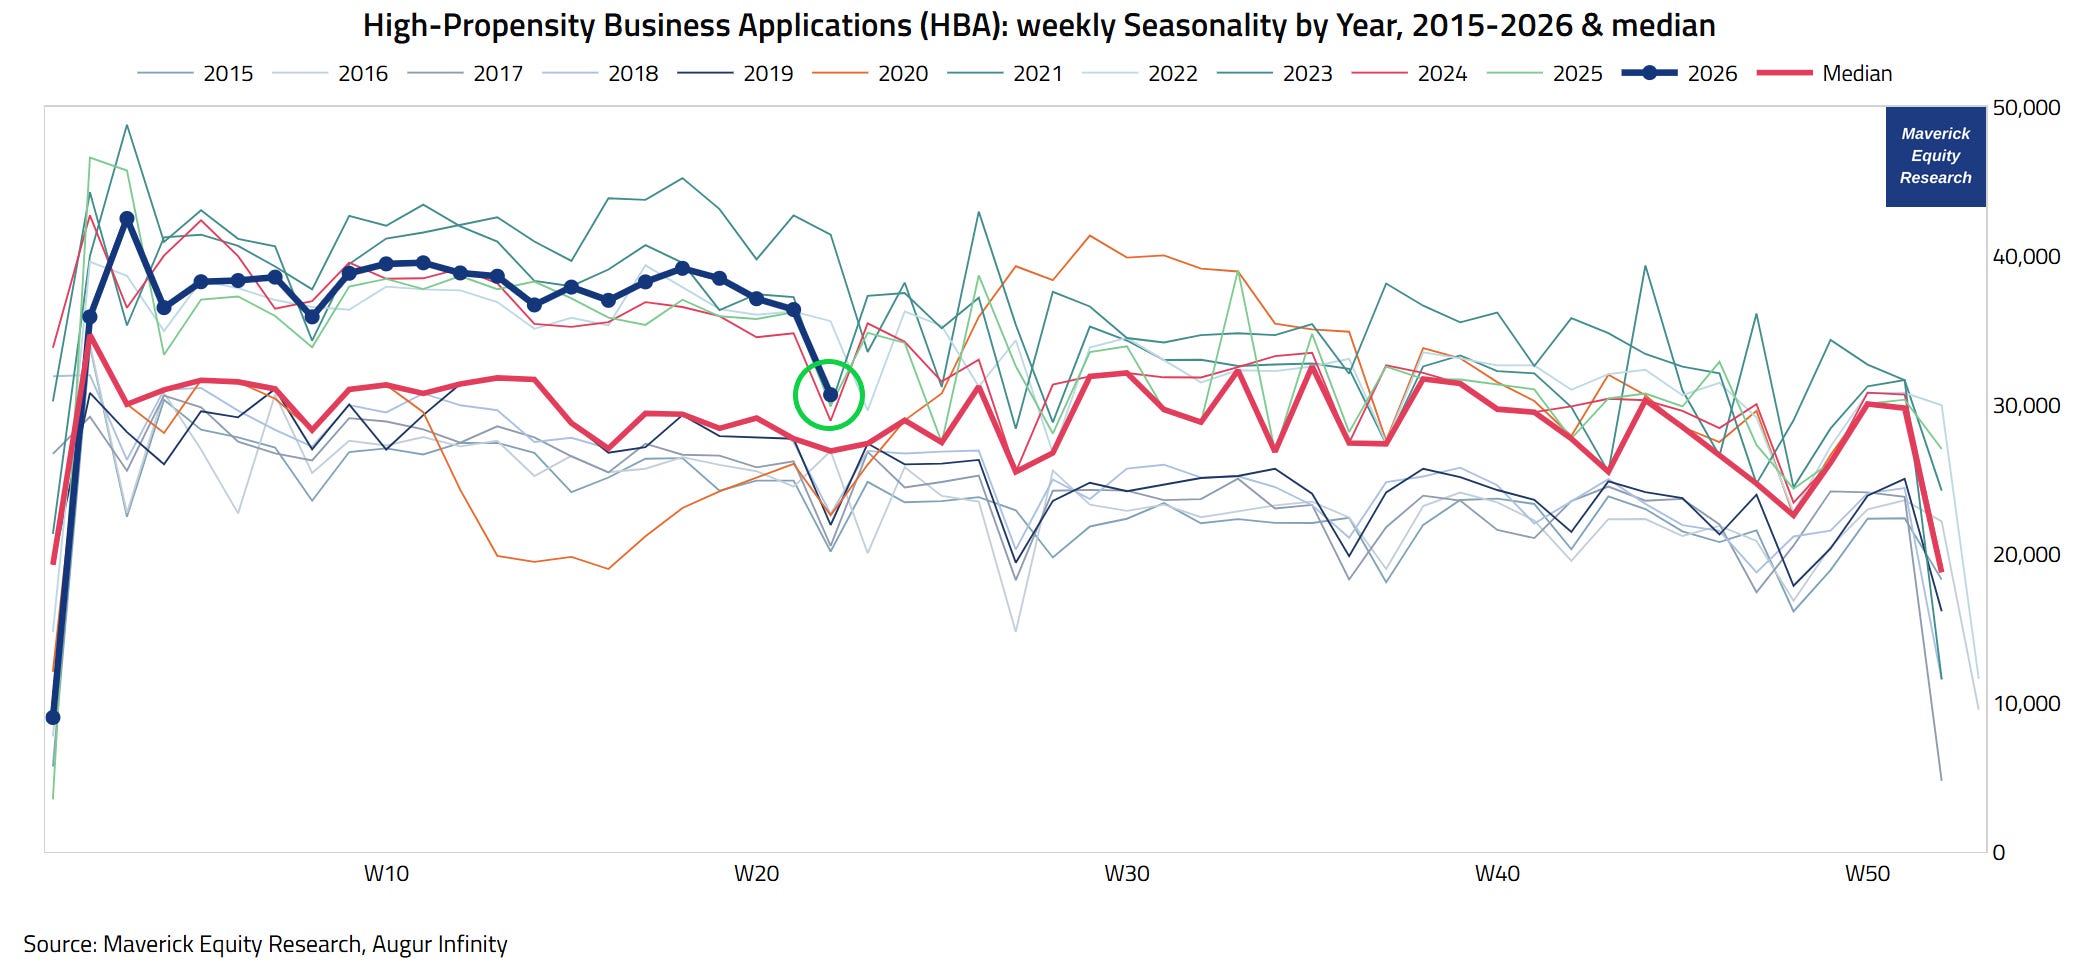
High-Propensity Business Applications (HBA): weekly Seasonality by Year, 2015-2026 & median, a great view in order to capture the yearly Seasonality:
👉 2026 (blue) with 30,690 new applications, way above the 26,910 median (red), and numbers above most previous years = a solid reading also from the seasonality angle
👉 simply put, new business appetite is solid — plenty of businesses with a high probability turning into a real, active business with payroll
Overall, as a subset of the previous headline Business Applications (BA), High-Propensity Applications (HBA) are economically the better series for evaluating real business formation, hence providing better insights!
Maverick’s Net Take on New Business Applications and Connecting the Dots:
One key question is what is driving this new big wave of business applications — especially the ones with a high probability of turning into real businesses? What’s going on behind the numbers, especially since 2020 when the base level is bigger?
👉 tech since 2020, and now AI with huge investments are simply showcasing how they created substantially lower barriers to pursue ideas, innovation, risk-taking from which new real businesses eventually emerge
👉AI/LLMs lowering the barriers to entrepreneurship is also seen through the recent Software sector disruption, an industry that had it too easy in the last 10-20 years
👉 solo founders are driving nearly all of the growth, and if even a fraction of these firms scale, the economic implications would be significant!
👉 also, the “Gig Economy” is real with more freelancers and self employed people
American business is thriving, taking risks, and innovating! On that, recall Warren Buffett's commentary on American economic dynamism in his 2016 shareholder letter:
“Americans have combined human ingenuity, a market system, a tide of talented and ambitious immigrants, and the rule of law to deliver abundance beyond any dreams of our forefathers.”
Supply Chains
📊 Hormuz Strait: “The Current Hot Topic, Buddy’!”
Number of Crossings through Strait of Hormuz: daily values in 2026:
👉 Context: Hormuz Strait = the world's most critical energy chokepoint 21 miles wide, a place where 20% of global oil supply is running — huge vessels crossing daily before March 2, and then the shutdown as Operation Epic Fury started
👉 Tanker traffic is recovering with 21 bi-directional crossings
👉 after 3 months of blockages, we are still far from the 50–80 crossing range seen during normal operations, yet the rebound, for starters, is solid!

My most likely scenario on the Hormuz Strait:
👉 solution and full normal flow is just a question of time, yet it’ll take some time to reach pre-war levels, and some further hiccups are to be expected
👉 also, some countries and oil companies might reorganize structurally around this, as one cannot depend on it to simply switch on and off overnight
👉 in any case, as we resume normal traffic, the pressure on Oil prices should ease!
Naturally, this was not a U.S. based analytical data point. Yet, given how critical oil is for the U.S. economy, especially for consumers, where it effectively acts as a tax on household budgets, it was worth covering. As a casual reminder, everything we see and touch day in and day out is either directly or indirectly made from oil.
N.B. side note / connecting the dots: recall that when oil was negative during 2020, this was the only thing you had to know to be a buyer, no big thesis is needed sometimes, that is how big dislocations are occasionally — hence the opportunity!
Further on opportunities, recall Buffet’s opportunity on investing in stocks:
👉 Volatility = Opportunity, and not Risk:
in Buffet’s 2024 letter he says that while great businesses are very hard to be bought in their entirety (an issue for Berkshire, but not a problem for us), small fractions of these gems can be purchased very occasionally, and at bargain prices
this applies basically to any good business/stock out there, independent of size, which is also the huge advantage of the small investor

Single stocks deep dives, many under-covered names that you likely never heard of!
P.S. I will cover great single stocks/businesses via the dedicated section: many under-covered names that you likely never heard of!
✍️ Full Equity Research
📊 Global Supply Chains: “Bring the Goodies Home, Fast & Cheap, Please!”
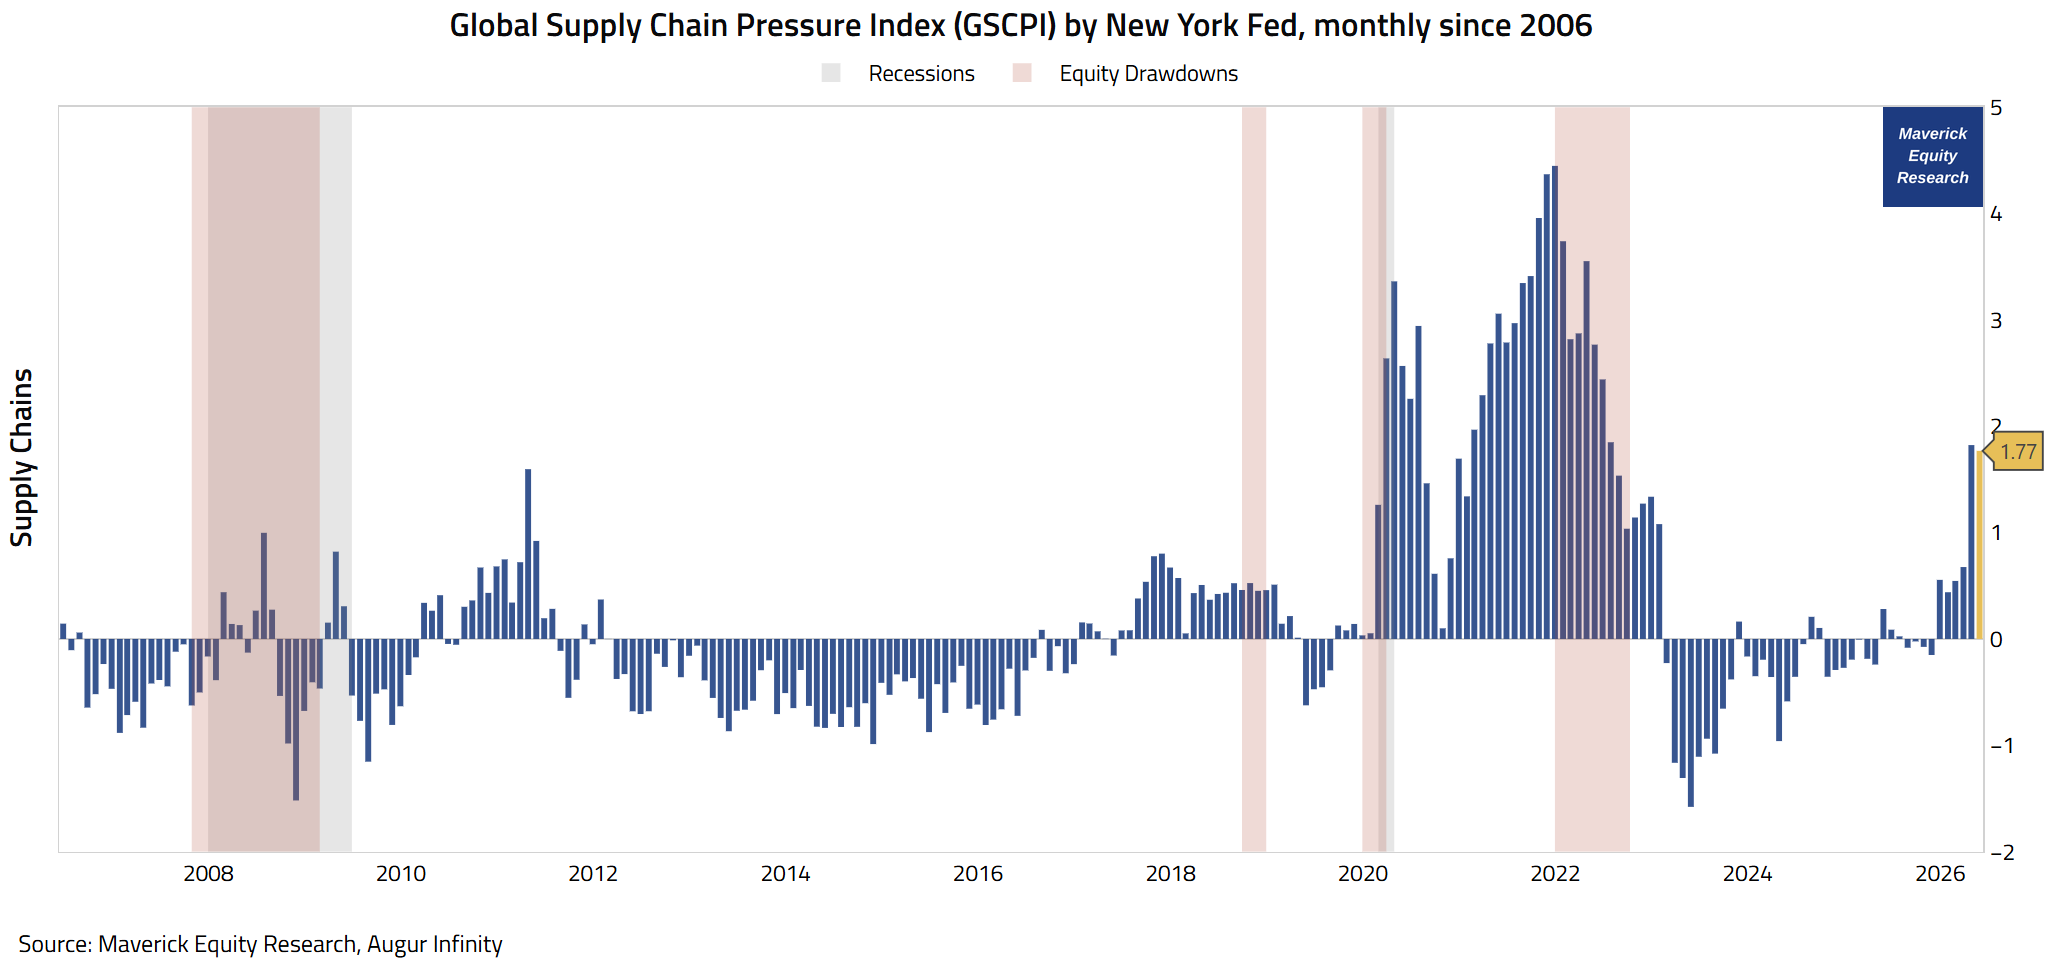
Global Supply Chain Pressure Index (GSCPI) by New York Fed, monthly since 2006 — it aggregates data from several sources: shipping costs (Baltic Dry Index, Harpex), airfreight costs (BLS), and manufacturing Purchasing Managers’ Index (PMI) surveys from seven highly interconnected economies:
👉 1.77 in May after the 1.82 April reading (GSCPI measure standard deviations from the index’s average, hence now 1.77 standard deviations above its long-term mean)
👉 that is up from 0.68 in March, hence raising fast in 2026, after being mostly negative in 2023, 2024 and 2025
👉 while it's way down from its December 2021 supply chain mega disruption, it has returned to its highest level since January 2023 — as a result, we see headline inflation increasing lately, yet core inflation measures remain quite steady
👉 overall, some mild signs of distress, yet quite unlikely to intensify much this year!
Trade Policy
📊 Trade Policy Uncertainty: “Let’s Do Business, Not Trade Wars, Buddy’!”
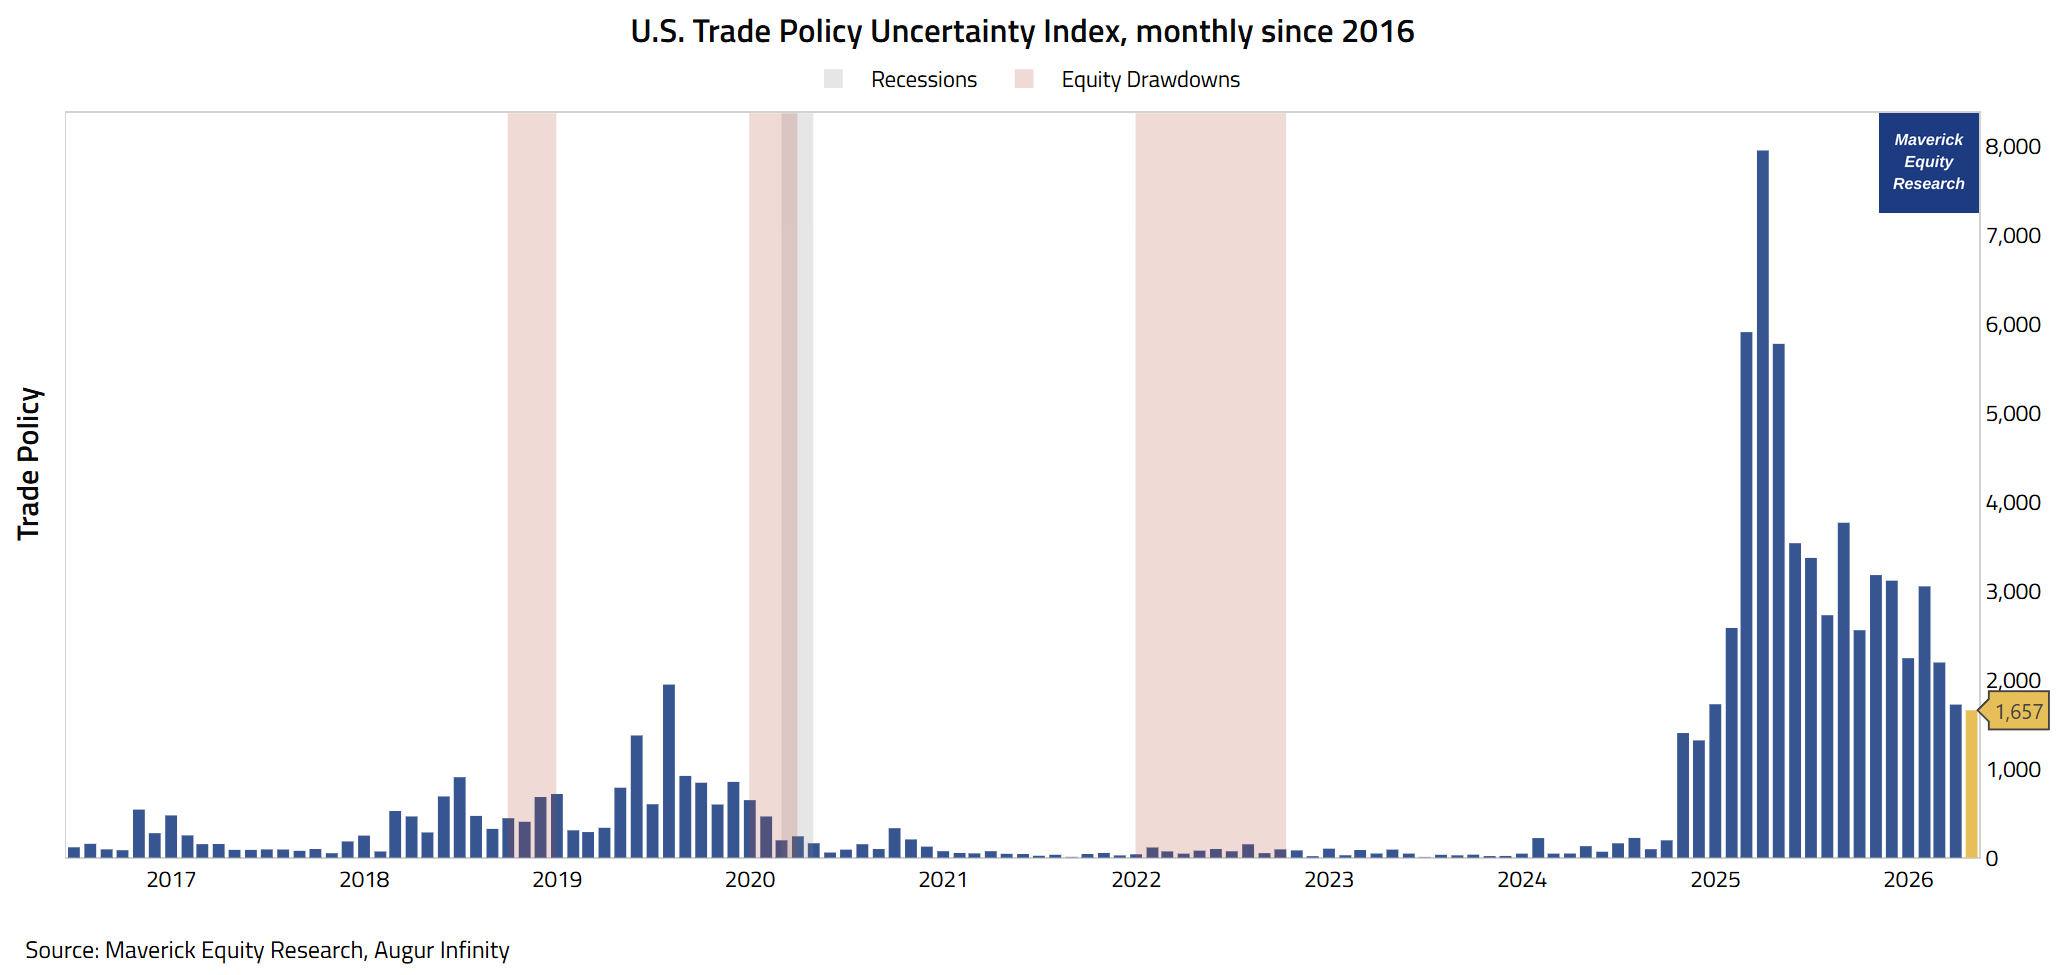
U.S. Trade Policy Uncertainty Index, monthly since 2006:
👉 1,657 in May, dropping fast from the 2025 Trader War 2.0 saga when it it almost reached 8,000
👉 good developments on a key topic that makes making business way harder/easier!
Economic Policy
📊 Economic Policy Uncertainty: “More Clarity = More Business, Buddy’!”
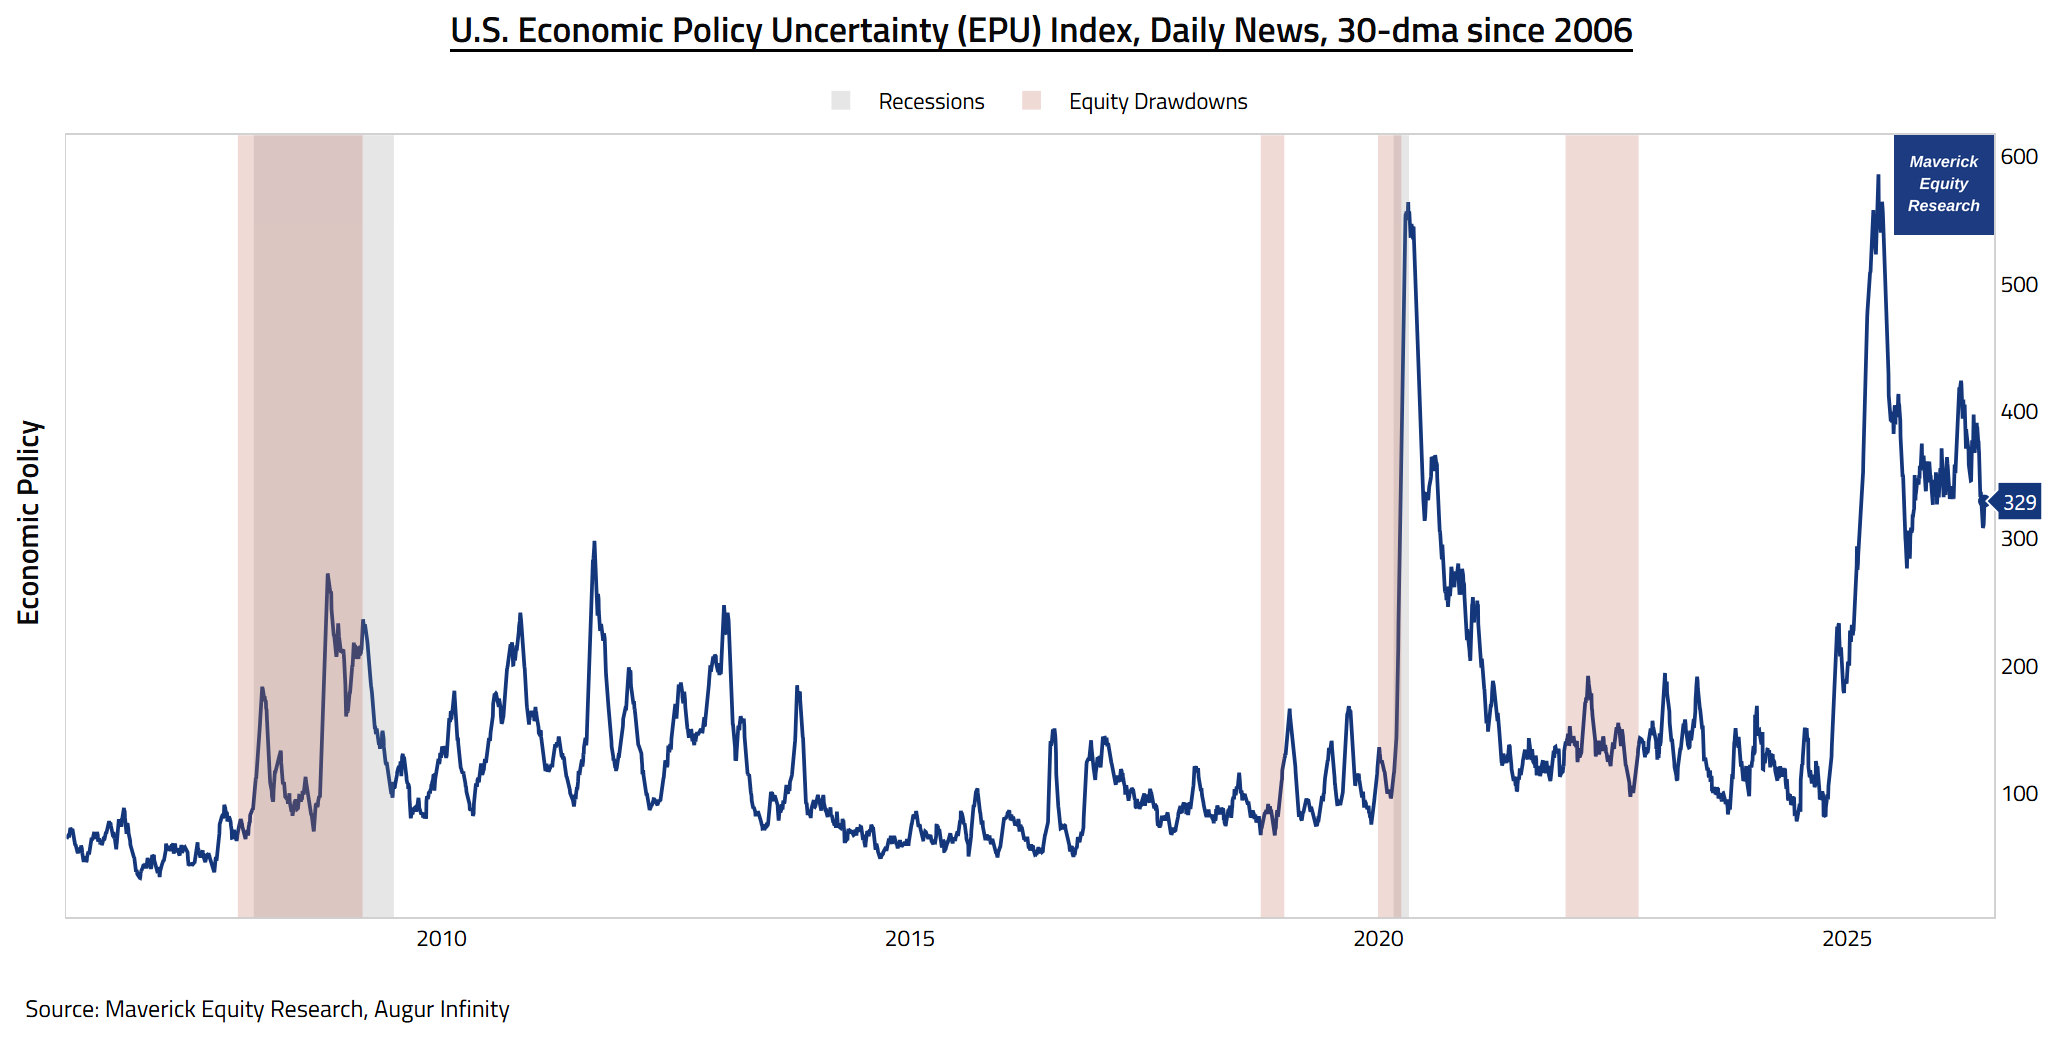
U.S. Economic Policy Uncertainty (EPU) Index, Daily News, 30-dma since 2006:
👉 387 as of June 21st, just a week ago (daily data shown as a 30 day moving average)
👉 this has fallen sharply from its 2025 Trader War 2.0 peak of 586, which was itself higher than 2020’s COVID-era level of 564
hence back in 2025 this news based index was exaggerating — chasing for clicks & views for ad-money (the daily news overflow entered another level since 2020)
therefore, judgement is to be made whenever this one gets very volatile
👉 More Clarity or Less Uncertainty = More Business which is Good for Business!
Bonus: GDP Near-Real-Time Tracking
And now 2 big questions:
do all the numbers from above reflect general economic activity?
if yes, how do they feed into near-real-time tracking of economic activity?
To answer, we will first set the scene with the latest realized Q1 2026 GDP data and then proceed to the most timely, near-real-time economic metrics for Q2 2026.
Actual GDP: “GDP, Ohh Mighty Realized GDP!”
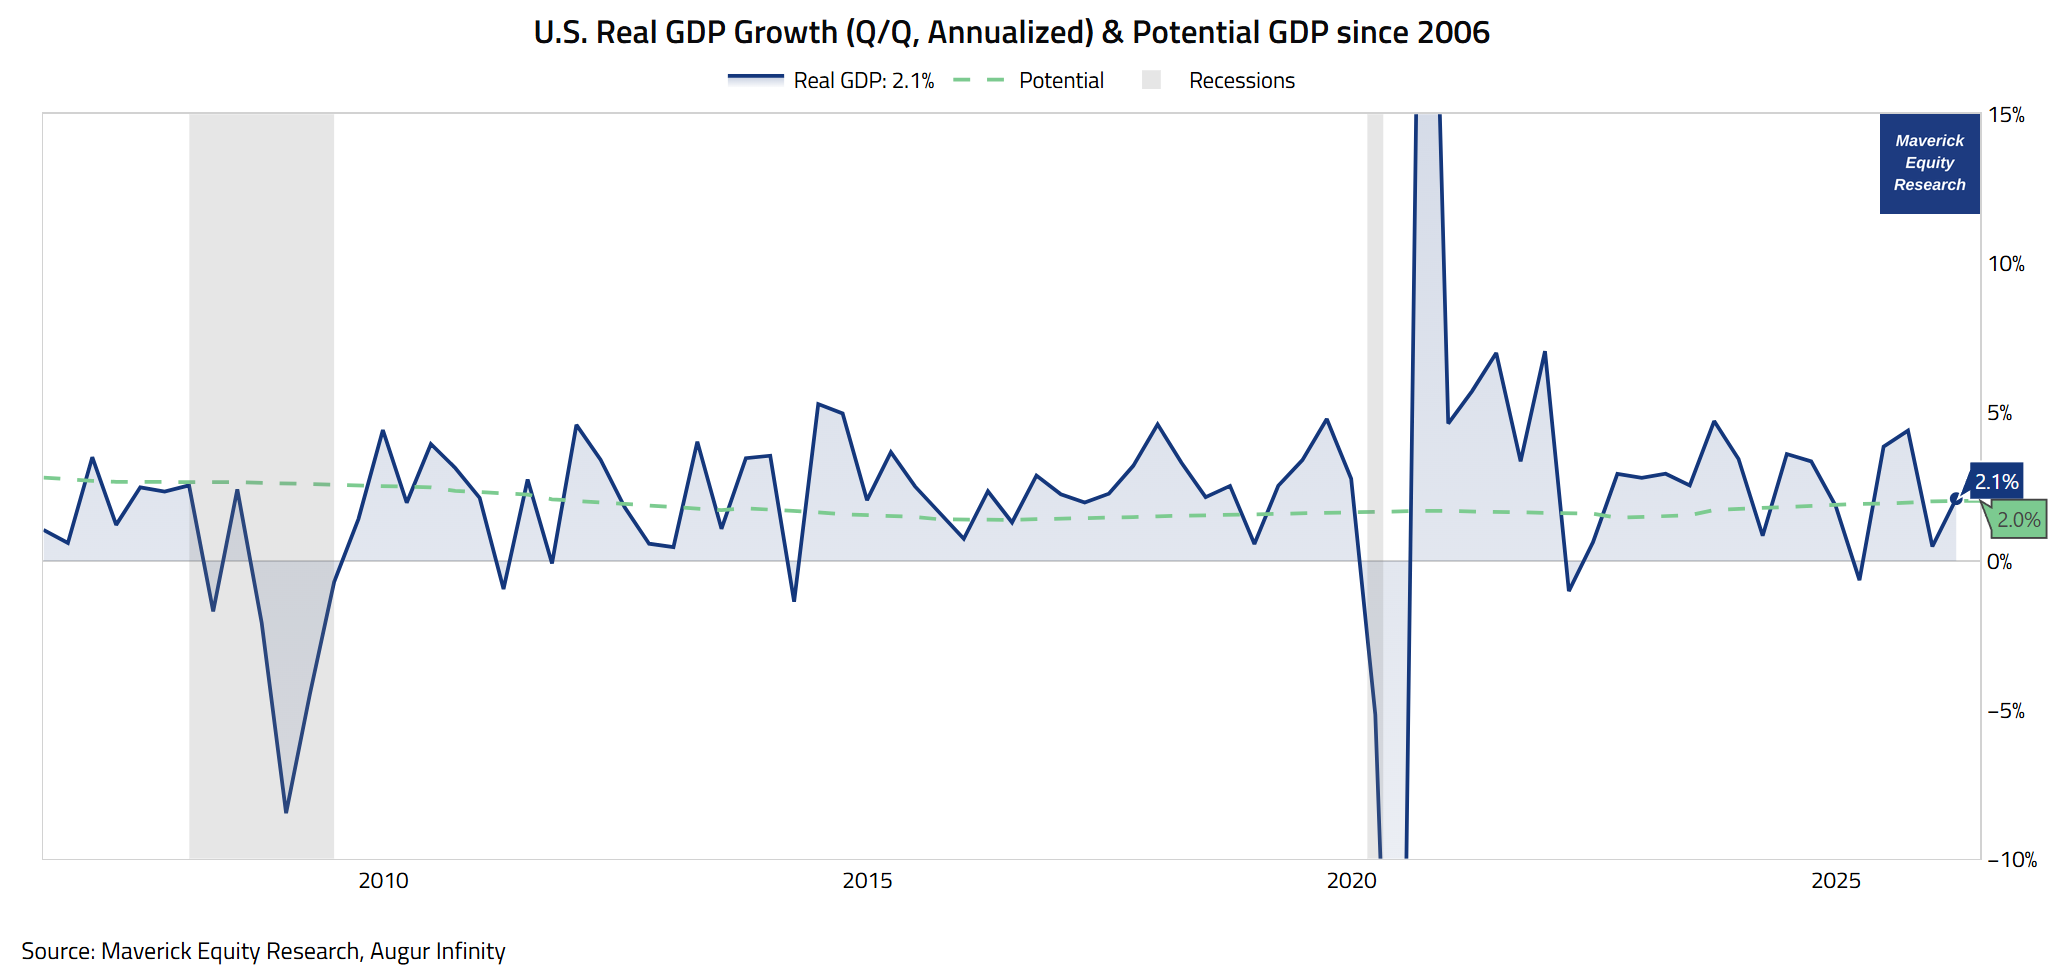
U.S. Real GDP Growth (Q/Q, Annualized) & Potential GDP since 2006:
👉 Q1 2026: 2.1% real GDP annualized growth rate
above the 1.6% consensus estimate, a material improvement from 0.5% growth in Q4 of 2025, and also a bit above the 2% potential GDP
nominal GDP growth (unadjusted for inflation) came in at 5.7% annualized
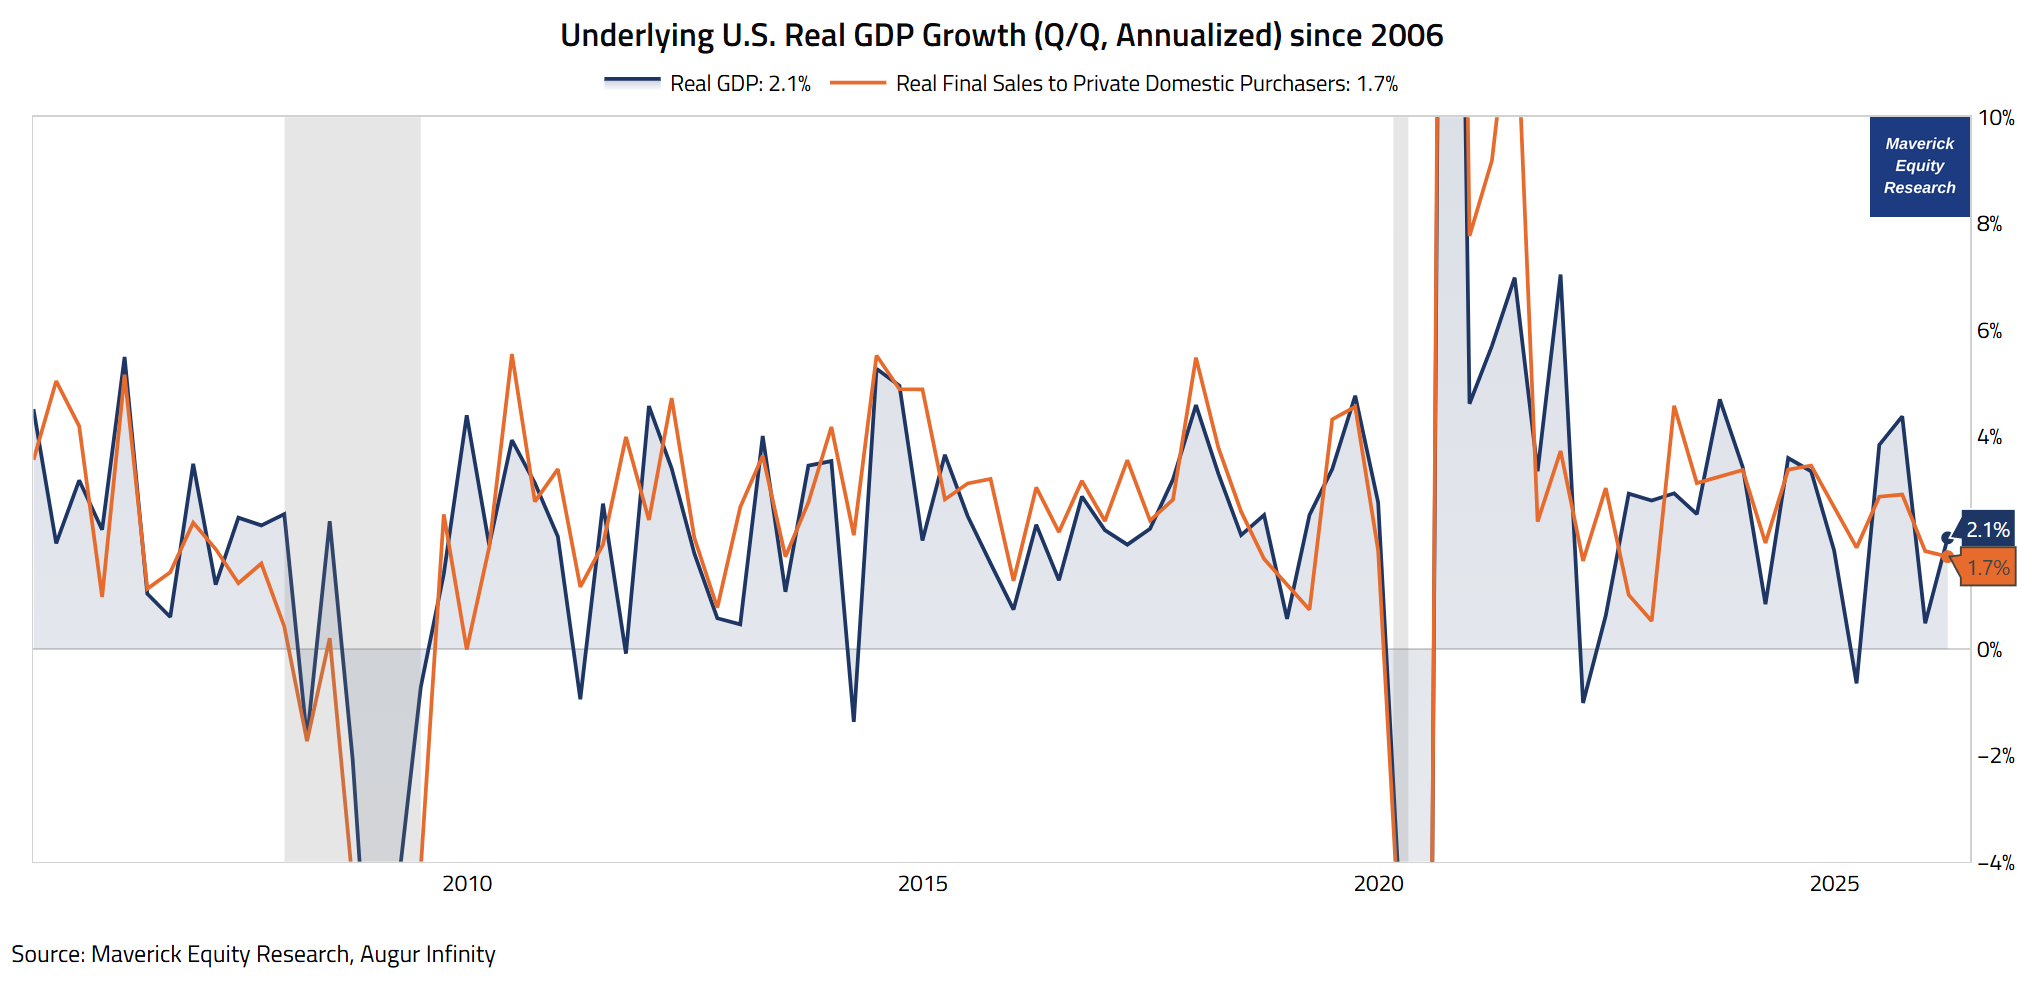
What about the underlying U.S. Real GDP Growth?
Underlying U.S. Real GDP Growth (Q/Q, Annualized) since 2006:
👉 Stripping out government spending, net trade, and inventories, Real Final Sales to Private Domestic Purchasers (orange) came at +1.7%, also a decent reading!
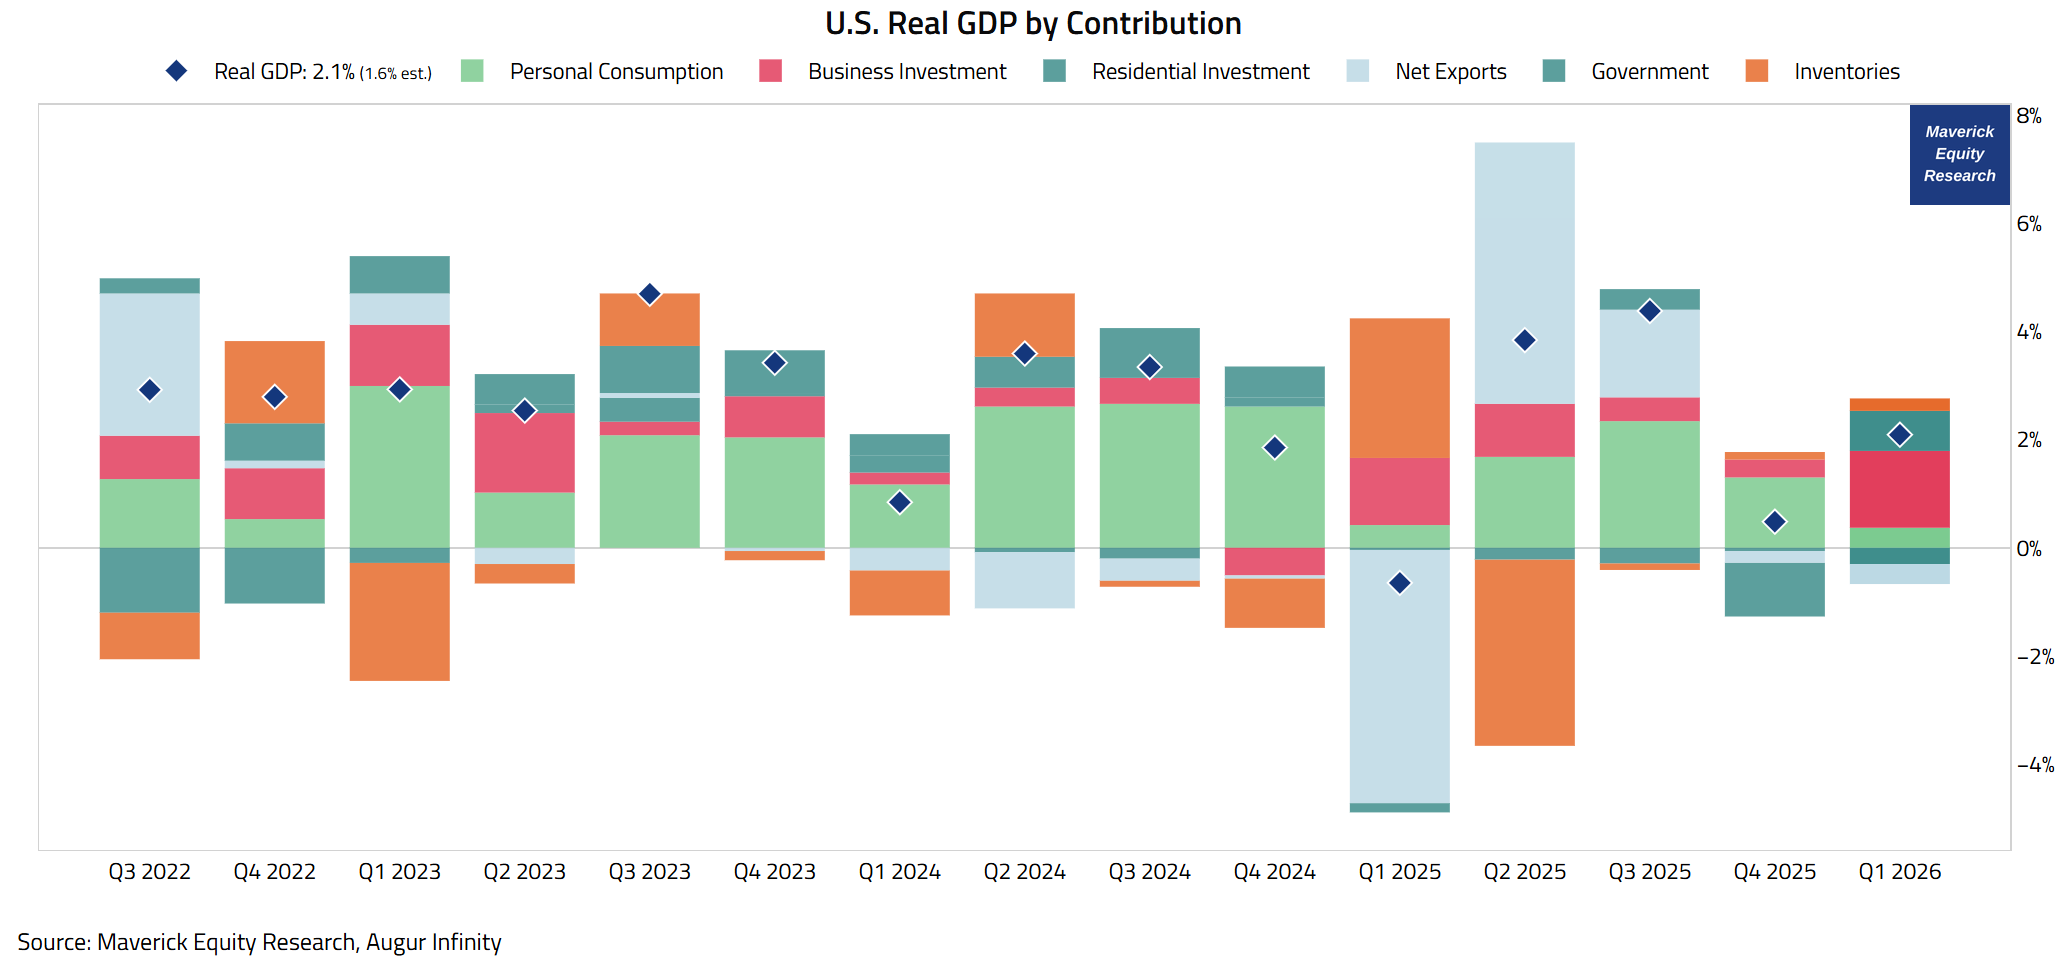
U.S. Real GDP by Contribution to answer: “Which ones are the drivers, Mav?”
👉 Personal Consumption PCE: +0.37% (light green)
👉 Residential Investment:-0.30% (green)
👉 Net Export up (Trade Deficit): -0.37% (light blue)
👉 Government: +0.74% (dark green)
👉 Inventories: +0.23% (orange)
What is the big positive contributor?
👉 Business Investment (red) 1.42% contribution, driven by the boom in AI-related investments, but also the general U.S. current CAPEX cycle
Overall, a solid reading!
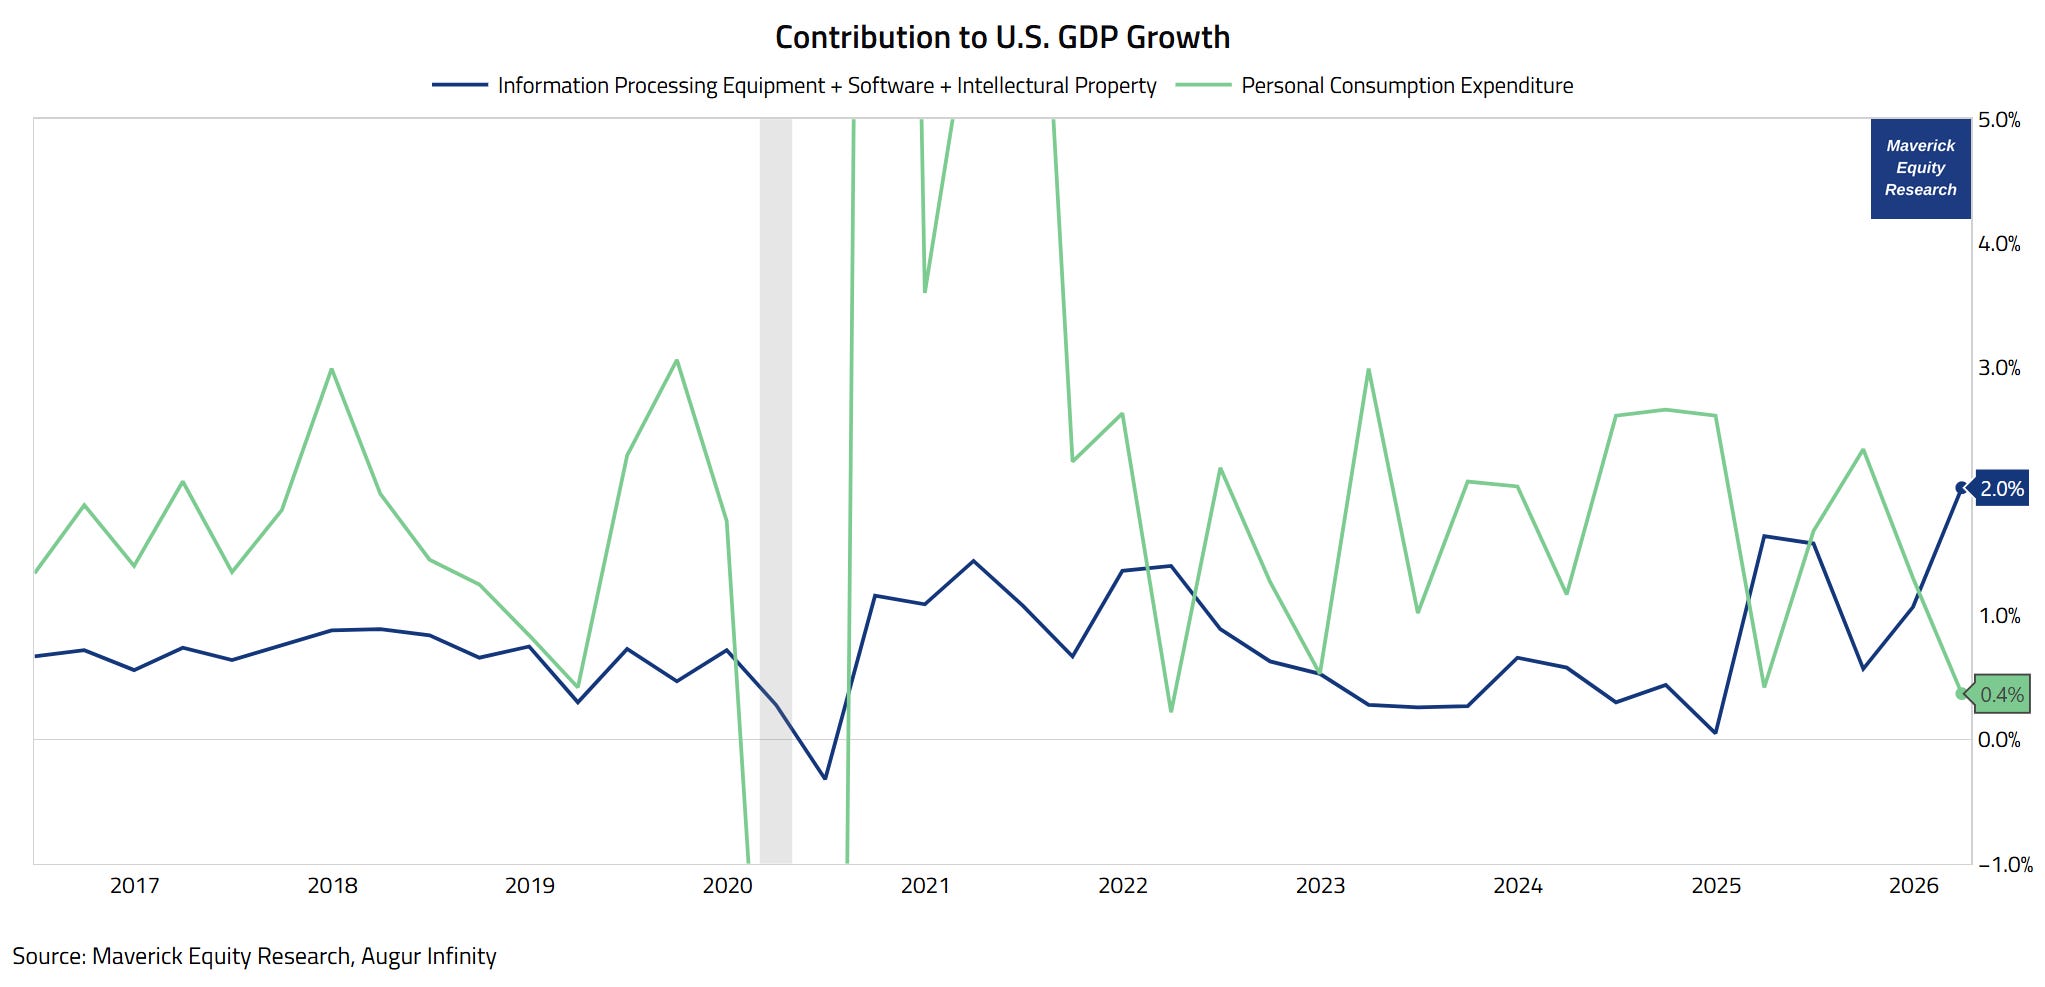
“On the AI investment effect, how does one go from an oral narrative to real data, Mav?”
Information Processing Equipment + Software + Intellectual Property (as a proxy for the contributions made by the AI-related investments):
👉 at +2%, it is quite ‘stealing the show’!
Second of all, we now look further at near-real-time quantitative tracking!
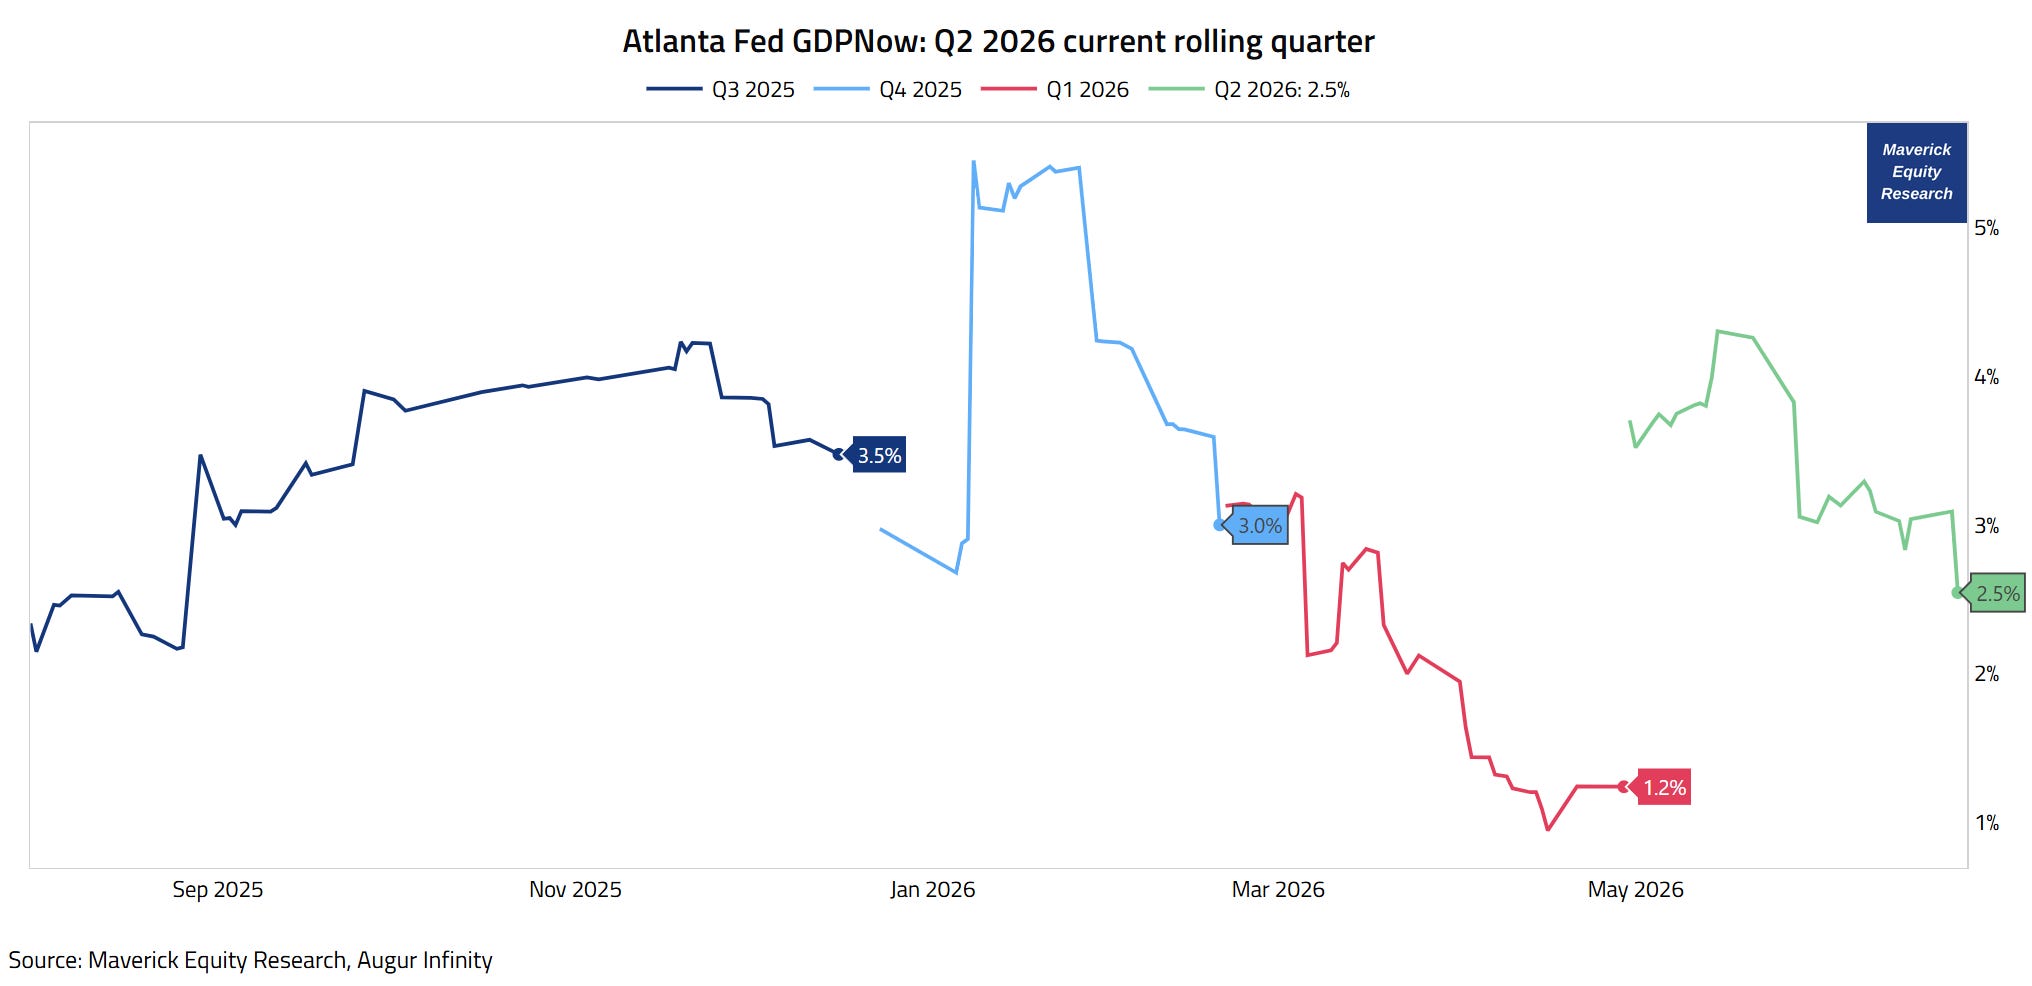
GDPNow: “GDP, Ohh Mighty Now GDP!”
Atlanta Fed ‘GDPNow’: Q2 2026 current quarter
👉 Q2 2026: 2.5% real GDP annualized growth rate according to the latest release from just 3 days ago, 25th of June!
👉 Overall, also a solid reading!
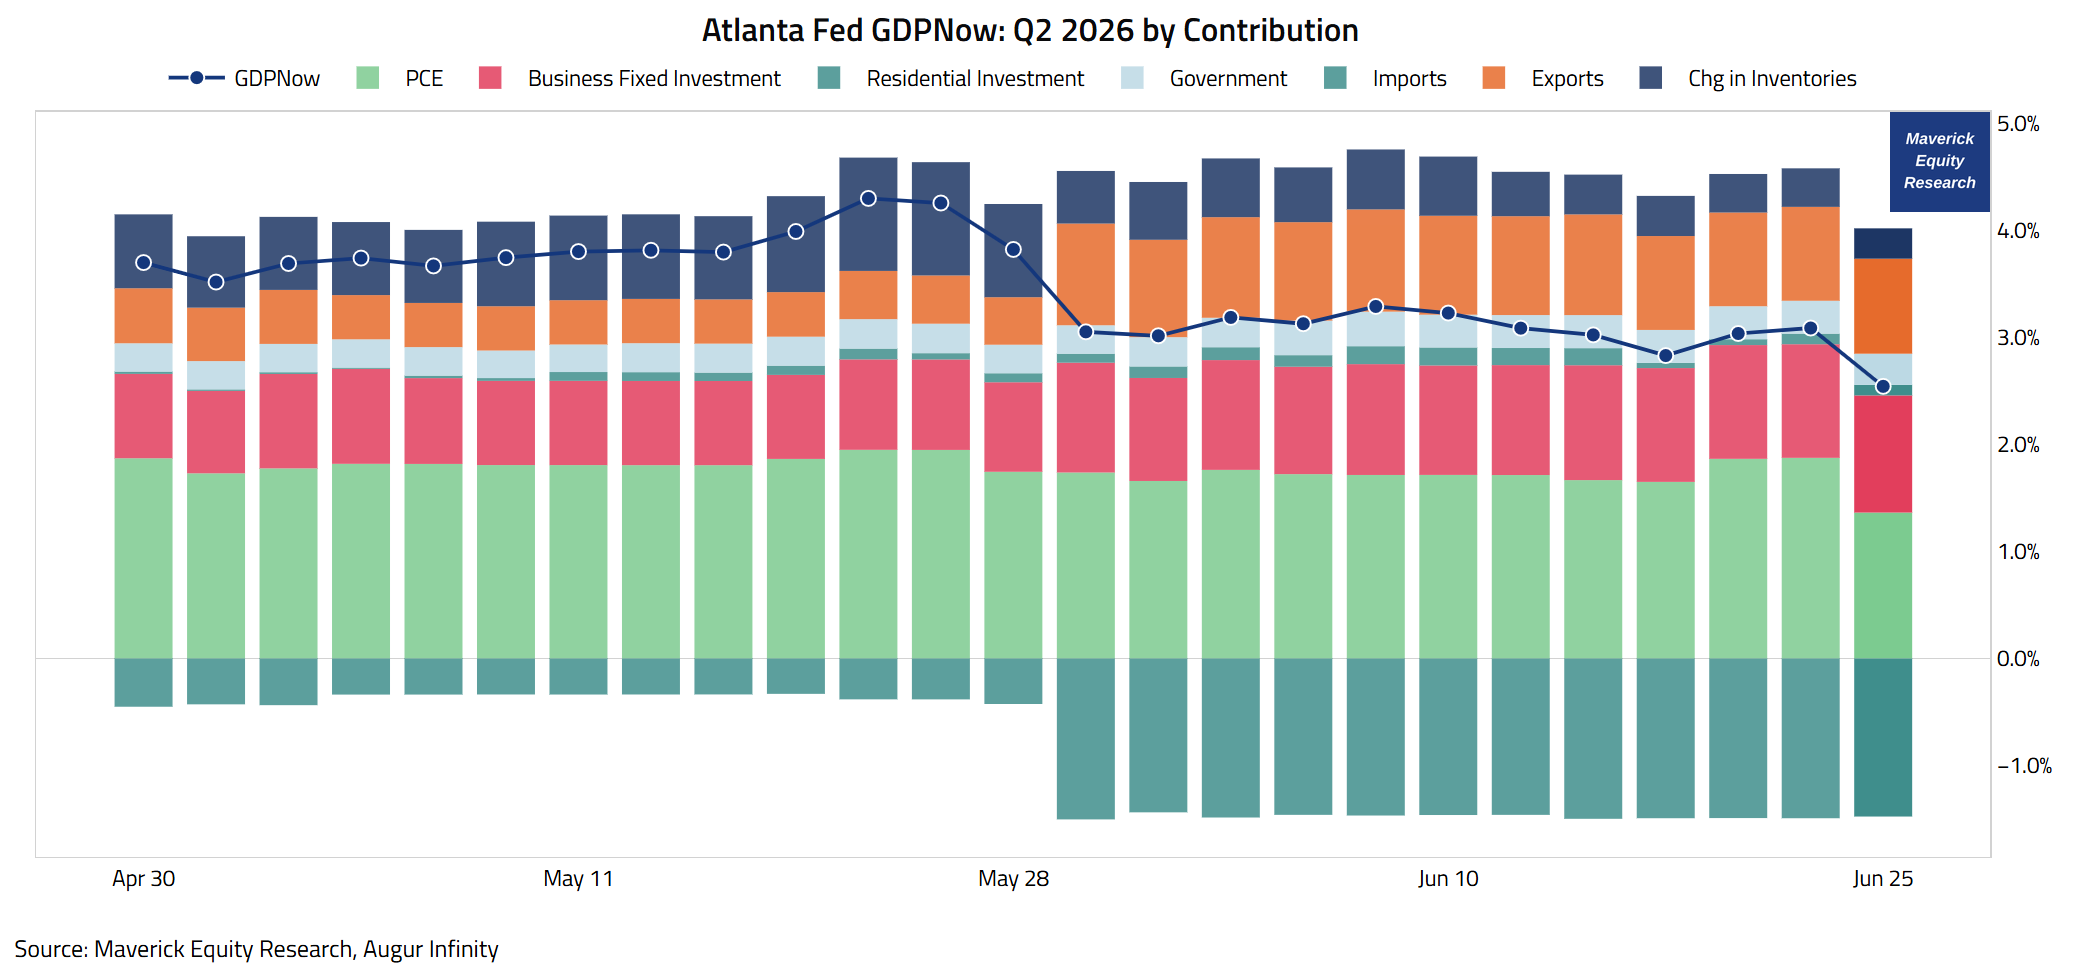
Atlanta Fed GDPNow: Q2 2026 by Contribution
👉 Personal Consumption PCE: +1.36% (light green)
👉 Business Investment: +1.09% (red)
👉 Residential Investment: +0.098% (light green)
👉 Government: +0.292% (light blue)
👉 Imports: -1.47% (green)
👉 Exports: +0.88% (orange)
👉 Inventories +0.283% (blue)
Overall, a solid reading!
Background info:
Atlanta Fed GDPNow tracks the Bureau of Economic Analysis (BEA)’s advance estimate of real GDP growth for the current quarter, using incoming economic data releases to update the forecast in real time
it is an accounting/bottom-up model — more precise mechanics
more volatile early in the quarter when little data has been released, hence it is more useful in the final weeks of a quarter when data is nearly complete
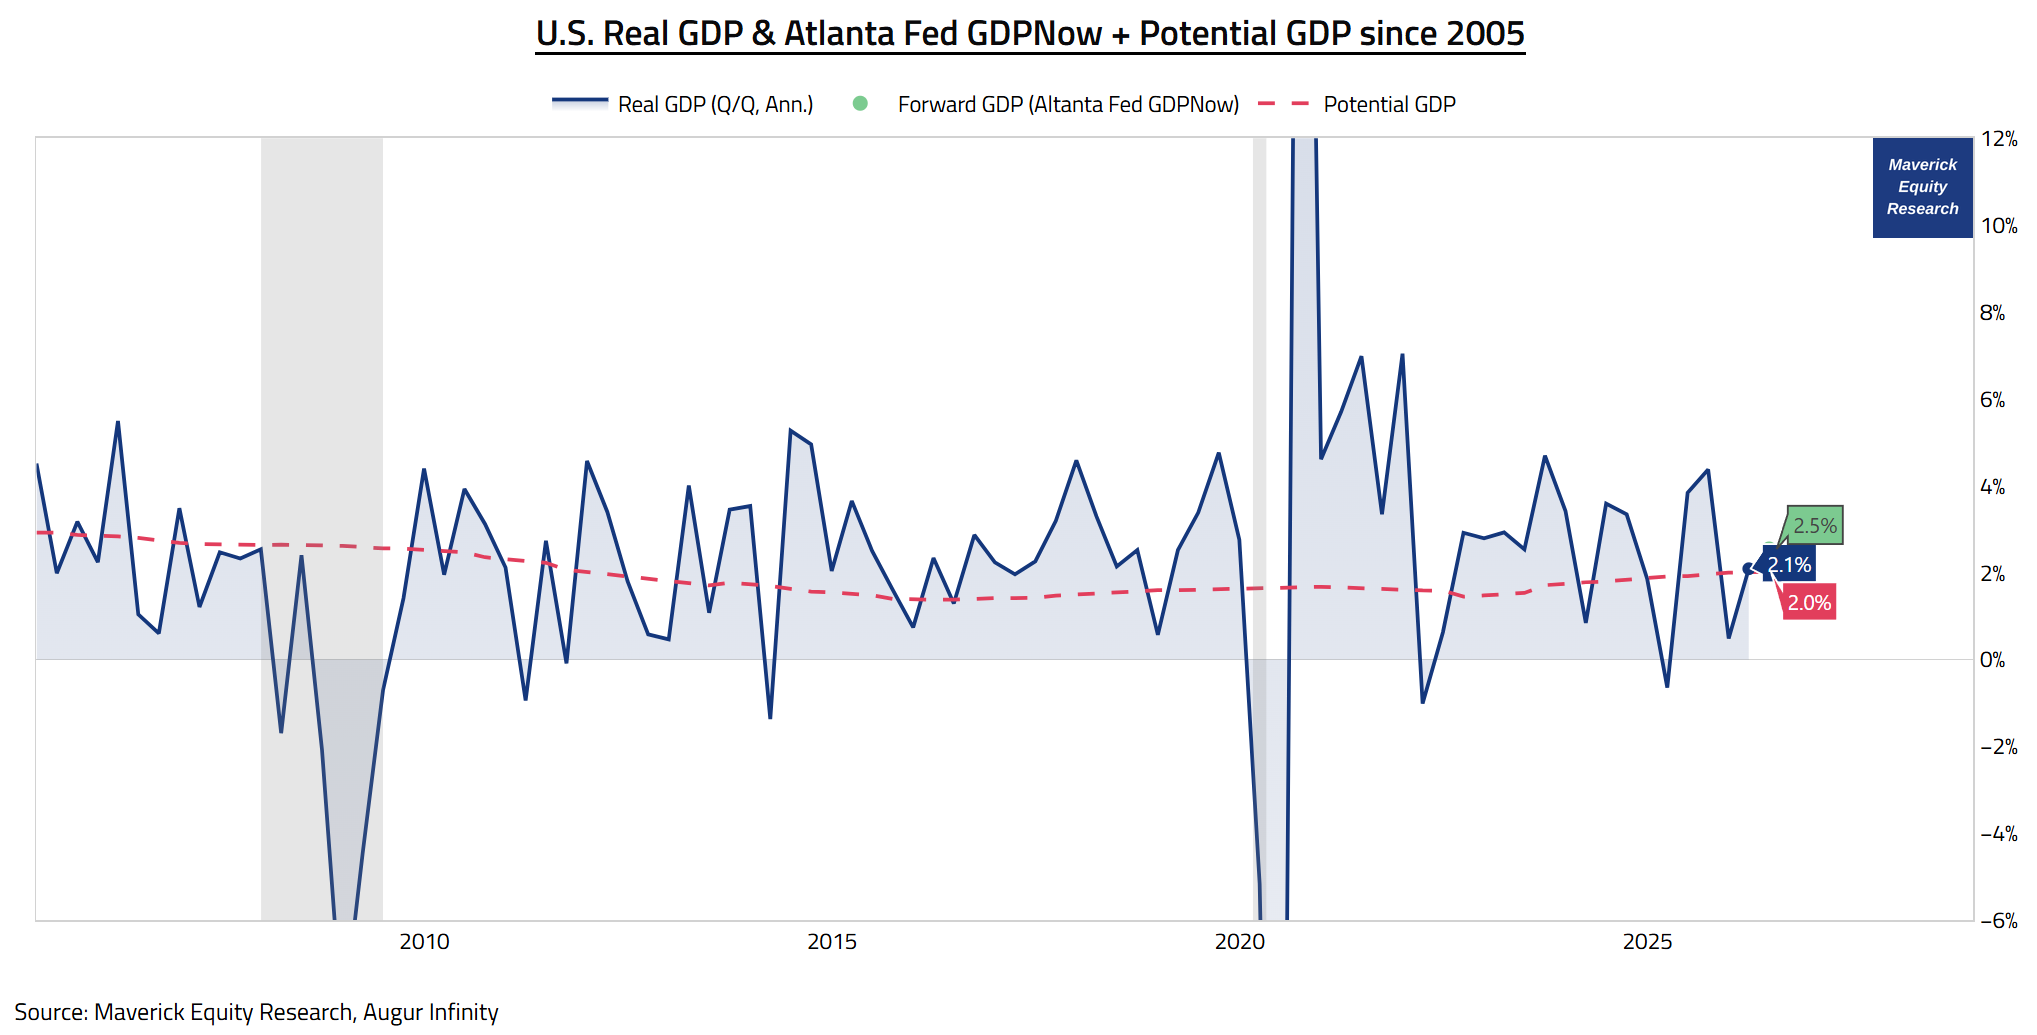
U.S. Real GDP & Atlanta Fed GDPNow + Potential GDP since 2005, overview:
👉 Actual GDP: Q1 2026 real GDP (blue): 2.1%
👉 GDPNow Atlanta Fed (green): +2.5%
👉 Potential GDP (red) : +2.0%
Nowcast: “GDP, Mighty Smoother GDP!”
New York Fed ‘Nowcast’: Q2 2026 current quarter
👉 Q2 2026: 2.7% real GDP annualized growth rate according to the latest release from just 2 days ago, 26th of June!
👉 A decent reading!
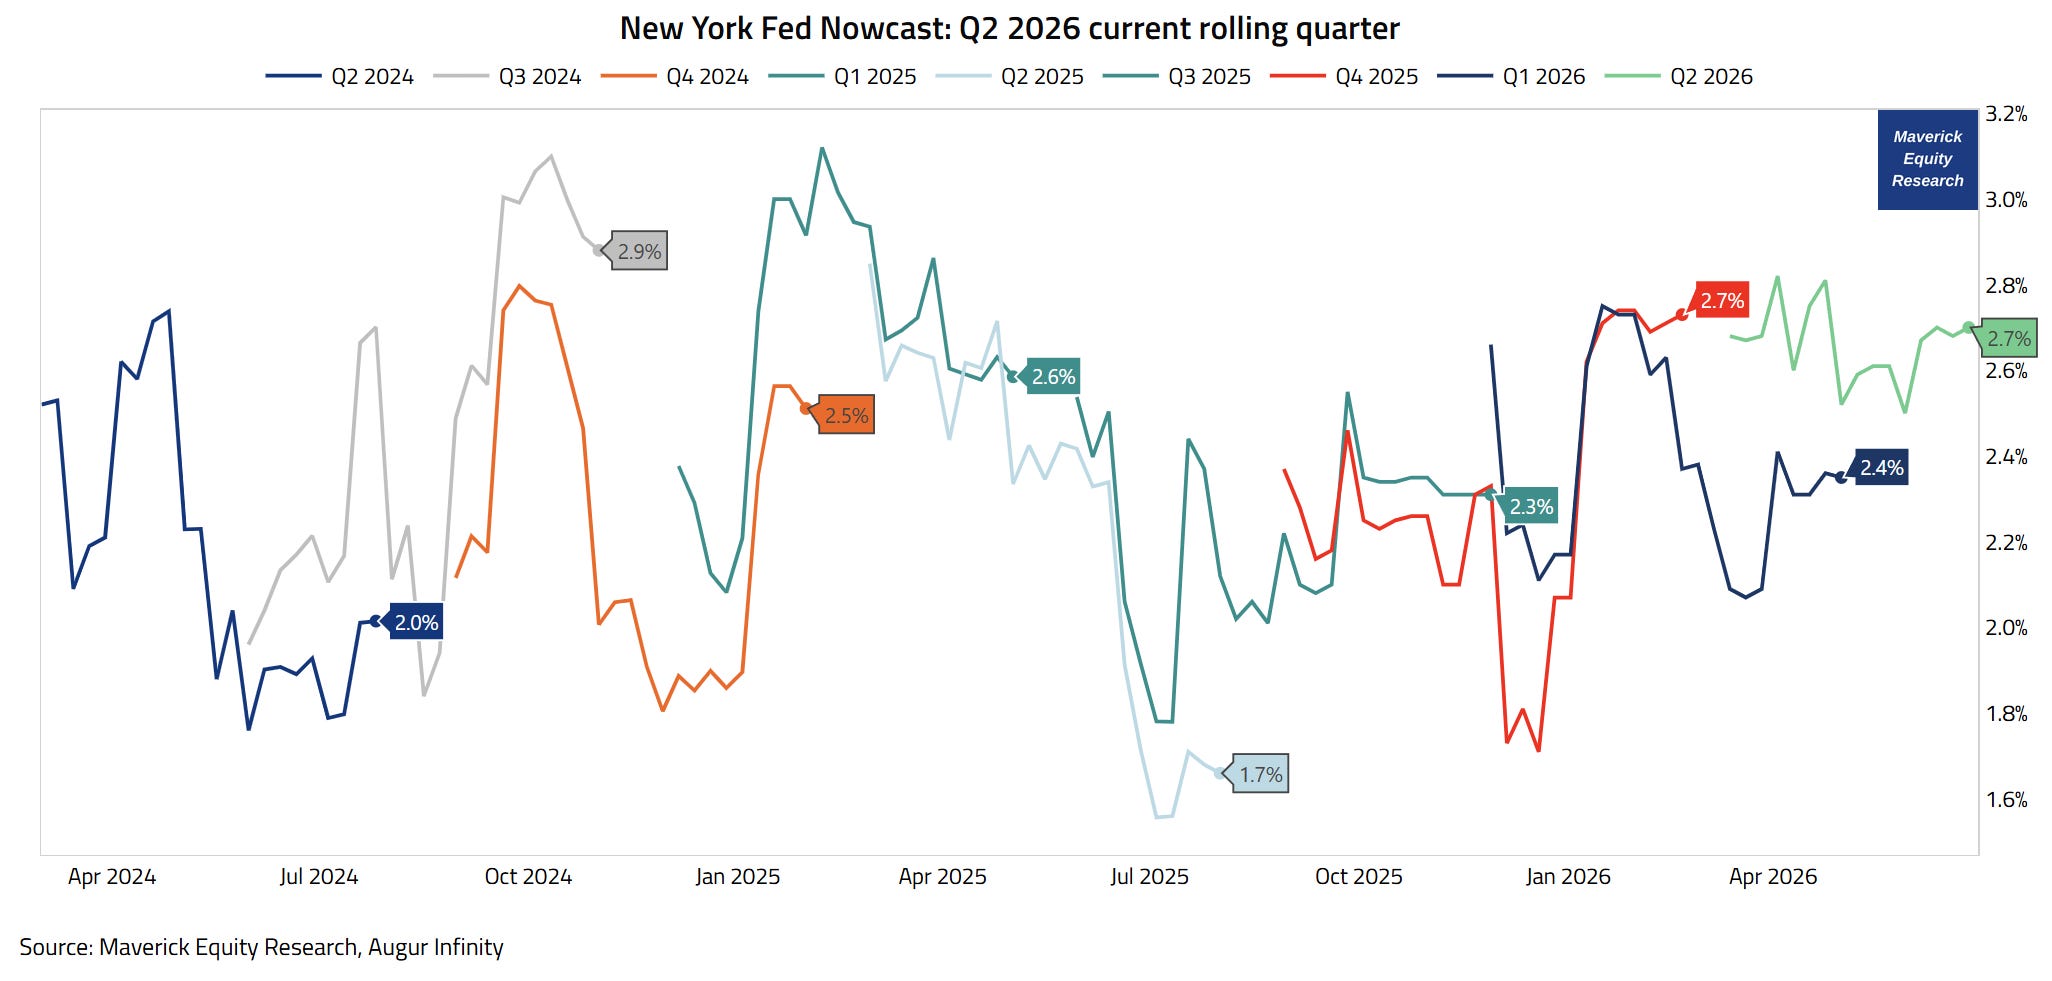
Background info:
New York Fed Nowcast uses a dynamic factor model that incorporates a broad set of macroeconomic indicators (labor market data, surveys, industrial output, etc.) — it basically reads the real-time flow of information and evaluates its effects on current economic conditions
it is statistical/top-down/model-driven approach — this approach incorporates a reliable big data framework that captures the salient features of macroeconomic data dynamics in a parsimonious way
useful reading broad economic momentum mid-quarter, when you want a smoother signal less prone to single-release swings
👍 Weekly Economic Index: “My Dear ‘Big Data’ Signal of the State of the U.S. Economy!”
Weekly Economic Index (WEI) by Dallas Fed, a good GDP proxy as the index is scaled to align with year-over-year GDP growth, which gives it a concrete interpretive anchor beyond just being a directional signal:
👉 2.50% (blue) for the week ended June 20, and 3.10% for June 13 according to the latest release from just 3 days ago, 25th of June!
👉 my preferred view is the 13-week moving average for 2.83% — this is compared with 2.68% four-quarter GDP growth through first quarter 2026.
👉 not only defying also the recent headwinds, but accelerating strongly lately — hence also a strong signal for a strong Q2 in 2026!
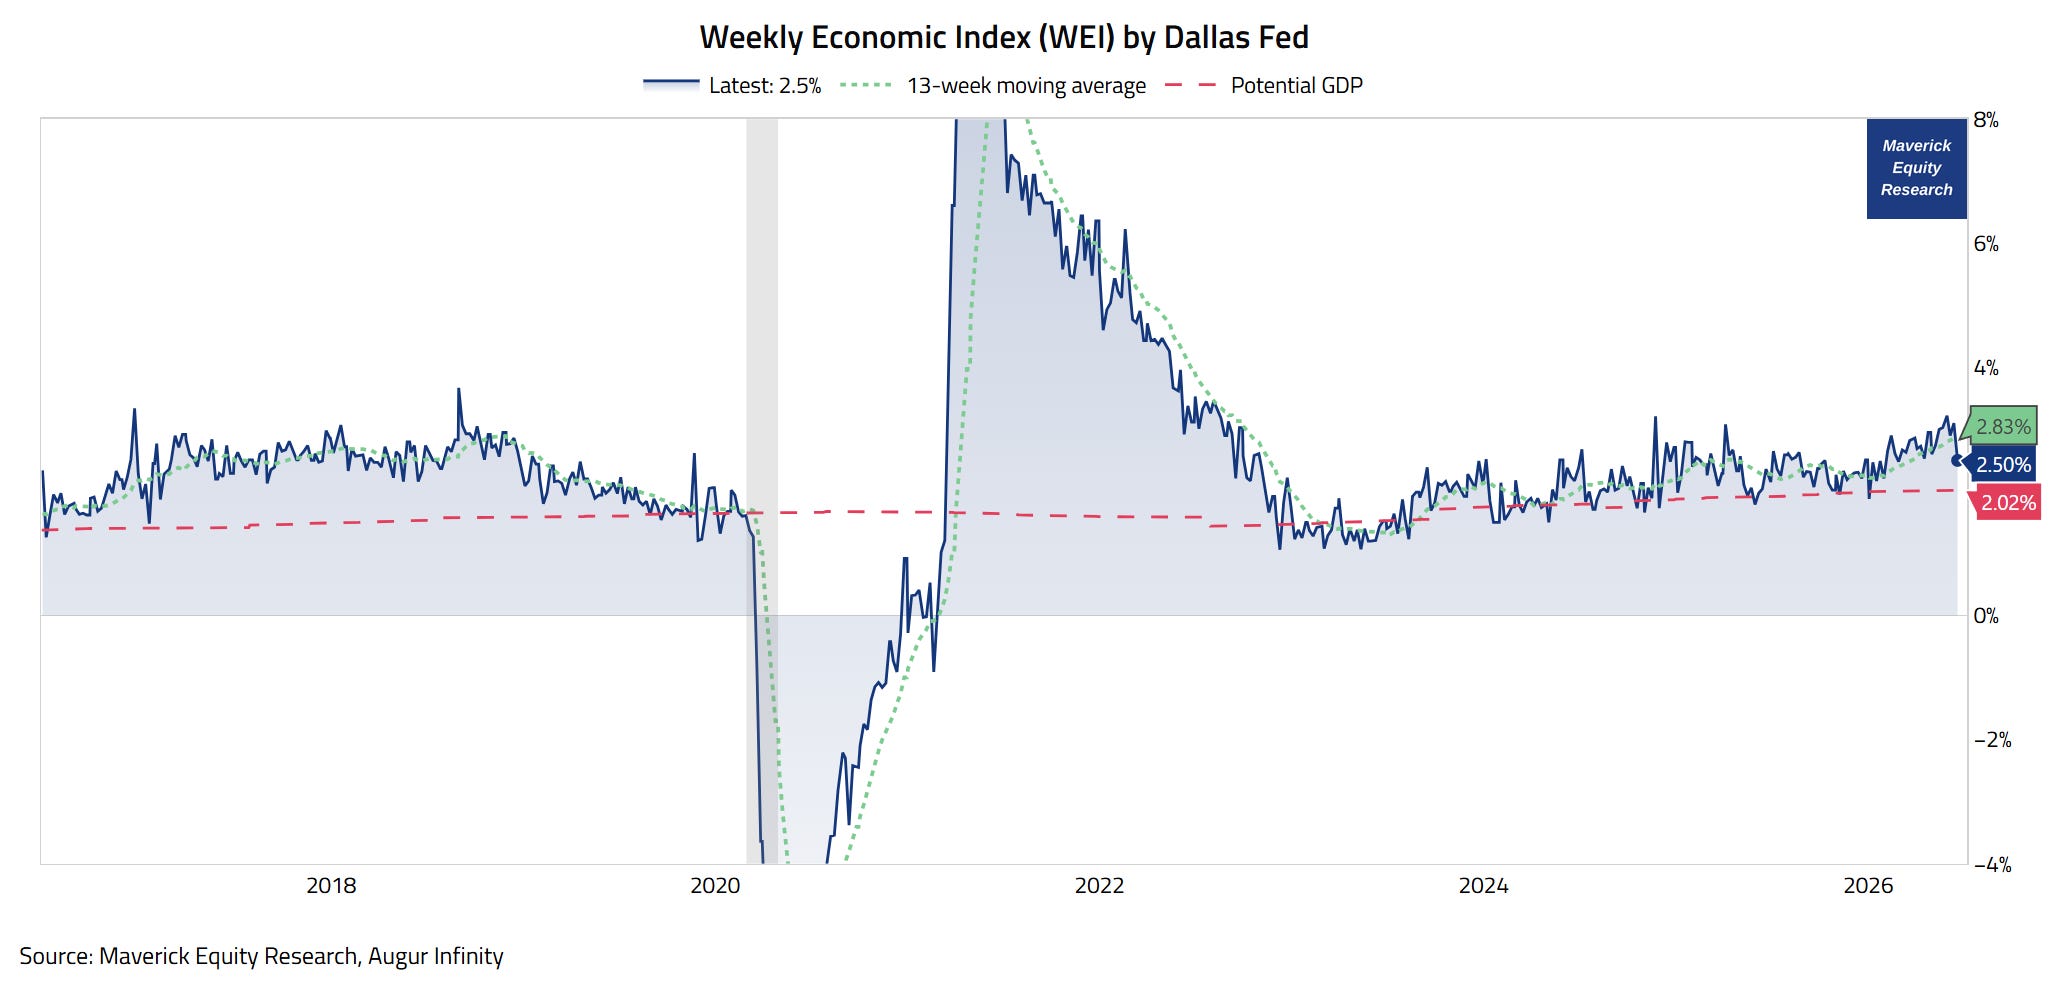
Background info:
the ‘weekly’ part in the name does not do enough justice in terms of how timely and good it is because it provides a signal of the state of the economy based on data available at both a weekly and daily frequency — hence we can say it reflects economic conditions with only a ~1-week lag, in which also daily data is present!
it represents the common component of 10 different daily and weekly series covering consumer behavior, financial/fiscal flows, the labor market & production
therefore, it is one of my preferred high-frequency trackers of the U.S. Economy, especially since 2020 COVID, as it was capturing the historic March–April 2020 collapse and subsequent recovery in near-real-time
Conclusions
Takeaways & Incoming Independent Research
📊 Takeaways: “After Work, The Reward, Baby!” & “Risk On, Baby!”
The U.S. economy is remarkably resilient and still acing stress tests as general economic activity remains robust
Americans are out & kicking: working hard, travelling, taking holidays, investing, innovating, consuming, and they earned it! “After Work, The Reward, Baby!”
that isn’t what many headlines say, the gloom & doom is perpetual (“Bear Po*n”), especially since the Rise of Negative Media for clicks & views for ad-money
What are the implications for financial markets and investing? “Risk On, Baby!”
All in all, I really believe this is unique, interesting and useful Macro research for both investors & traders (of all types), entrepreneurs, bankers, journalists, and beyond!
This is planned as a quarterly report that will evolve through improved visuals incorporating real-time, high-frequency, and alternative data!
This Macro is what I call: “The Marco Essence” and “Macro Intelligence vs. Macro Noise”:
daily macro commentary is hindering more than helping — my idea is to both stop the Macro noise overflow, yet get the valuable insights out of the Macro
mindset wise, in general it just pays off to be a Professional Realist-Optimist vs a Professional Pessimist, Ultra-Skeptic or a Cassandra!
📊 Incoming Independent Research: “What Research is Coming Soon to Town, Mav?”
On Berkshire Hathaway, Warren Buffett and new CEO Greg Abel:
✍️ Buffet’s Berkshire: The Legacy Continues! Stash Away Baby! Fundamentals, Buybacks, Optionality, Valuation, and … Patience!
Single stocks deep dives, many under-covered names that you likely never heard of!
✍️ Full Equity Research
On the S&P 500:
✍️ S&P 500 Report: Valuation, Fundamentals, Special Metrics & Leading Indicators
✍️ S&P 500 Report: Performance, Sentiment, Seasonality, Technical Analysis
✍️ Is the U.S. Stock Market in a Bubble?
On the U.S. Economy, a deep dive covering the main sectors & key macro variables through traditional data, but also, special, leading and recession probability metrics:
✍️ The State of the U.S. Economy in 75 Charts
On the so called “K‑shaped Economy” and the “Inequality” key topics:
✍️ How Truly “K-Shaped” is the U.S. Economy?
✍️ Inequality, Wealth Concentration, Taxation, Equity and More
On the current U.S. general CAPEX investing cycle:
✍️ U.S. CAPEX Boom! Invest Baby, Invest!
On AI and its big implications:
✍️ Is AI in Bubbly Territory?
✍️ AI & Jobs – The Ultimate Question & Elephant In The Room
And way more … step by step … as always, with a big focus on quality!
Research is NOT behind a paywall and NO pesky ads here unlike most other places!
Did you enjoy this by finding it interesting, saving you time and getting valuable insights? What would be appreciated?
Just sharing this around with like-minded people, and hitting the 🔄 & ❤️ buttons!
That’ll definitely support bringing in more & more independent investment research: from a single individual … not a corporate, bank, fund, click-baity media or so … !
Like this, the big positive externalities become the name of the game! Thank you!
Sharing = 3x win: you + your close ones + me!
Have a great next week, and a wonderful 4th of July holiday! And never forget, keep compounding: family, friends, community, capital, knowledge, research and mindset!
With respect,
Mav 👋 🤝
“Compound interest is both the ultimate and biggest natural hedge!” Maverick Equity Research
