
✍️ Recession Probability, Sentiment & History. Maverick Macro Charts of the Week #41
7 Maverick Charts that say 10,000 words: Recession talk, Business Investment, Labor Market, Housing & the Consumer + Gold in Goldilocks Mode

Dear all,
after the Maverick Equities Charts of the Week from 3 days ago, to the economy so that we cross nice & easy the Macro-Finance bridge, connecting the dots for insights.
7 cherry picked Maverick Charts of the week say 10,000 words or more = the ‘How’!
Table of contents = the ‘What’:
📊 Maverick Charts: Recession talk, Business Investment, Labor Market & Housing
📊 Bonus: Gold in Goldilocks Mode
Objective: both data-driven insights + valuable food for thought = the ‘Why’!
📊 Maverick Charts 📊
48% U.S. recession probability in the next 12 months through Moody’s model:
👉 48% = highest since the 2020 pandemic
👉 48% = very close to the 50% recession threshold
👉 historically, such a high probability never occurred outside of recessions

My own framework shows a probability that is way lower than 48%: I will cover that in detail via my 4th edition deep dive into the U.S. economy:
✍️ The State of the U.S. Economy in 75 Charts, Edition #4
4th edition work in progress for a while as it aims to come with big improvements in all areas: structure, flow, insights via traditional + special & alternative data & indicators + enhanced also by leading indicators & recession probabilities
I plan to run these reports each quarter + ad-hoc when needed, hence 4-8x/year
some of the special metrics and leading indicators will be released now in the 4th quarter, while the others in 2026 as good things take time (and data costs)
until then, you can check the 3rd edition with my 2024 stance, quick summary:
P.S. Fun Fact on the Economy and Sentiment in general:
most of the time when I talk with most people about the economy, it’s almost like they WANT me to say “the recession is here”, hence many are puzzled when I say the probability of a recession is currently LOW (like in the 2024 research)
this was not the pattern more than 10 years ago, it is rather recent, and it’s not because I meet more negativistic people, more or less the same environments
when one ask somebody about an opinion, especially a professional one, one should aim for their objective view (and ideally their independent one, which btw is not a given many times), not the extreme negativity nor the extreme positivity: “I tell you what you need to hear, not what you want to hear. If you want me to tell you what you want to hear, I am not adding any value to you … no echo chambers here!”
I think this kind of sadomasochistic mentality is mainly due to the 24/7 news, ‘always connected’, polarisation, negativity which are boosted by the algos, which in turn hijacks unfortunately too many brains - we aren’t made for that as humans
being calm, cool, rational and collected is not easy, buy very very important …
“Problem identified, but got any solutions Mav?”
I will show how to combat this also in a future special edition, I think that would help many people and independent of their views, background and objectives
naturally, via the future reports you will objectively have my take if the recession probability = very low, low, medium, high, or very high (no sad nor happy feelings)
A special one: Business Investment activity aka core CAPEX - it is UP!
👉 New Orders for Non-Defense Capital Goods (excluding aircraft) with a very sharp rebound since the 2020 pandemic, and currently at a high level of $76.7 billion (also known as ‘core CAPEX’ or simply put ‘Business Investment’ so that you can connect the dots, and/or do not get confused with other research or media reports)
👉 while it did slow down a bit in the 2022 bear market, a solid up-tick since 2024, hence signalling a positive outlook and economic strength in the months to come
Key notes:
the core message behind this is that it reflects very broad trends in Business Investment and Private Sector confidence, both very important for the investment-production-consumption loop
the key insight = purely focused on orders for long-lasting business equipment, and removing large fluctuations from defense and commercial aircraft orders
core CAPEX is regarded as a key factor driving the economy and one of the leading indictors of Business Activity or Business CAPEX
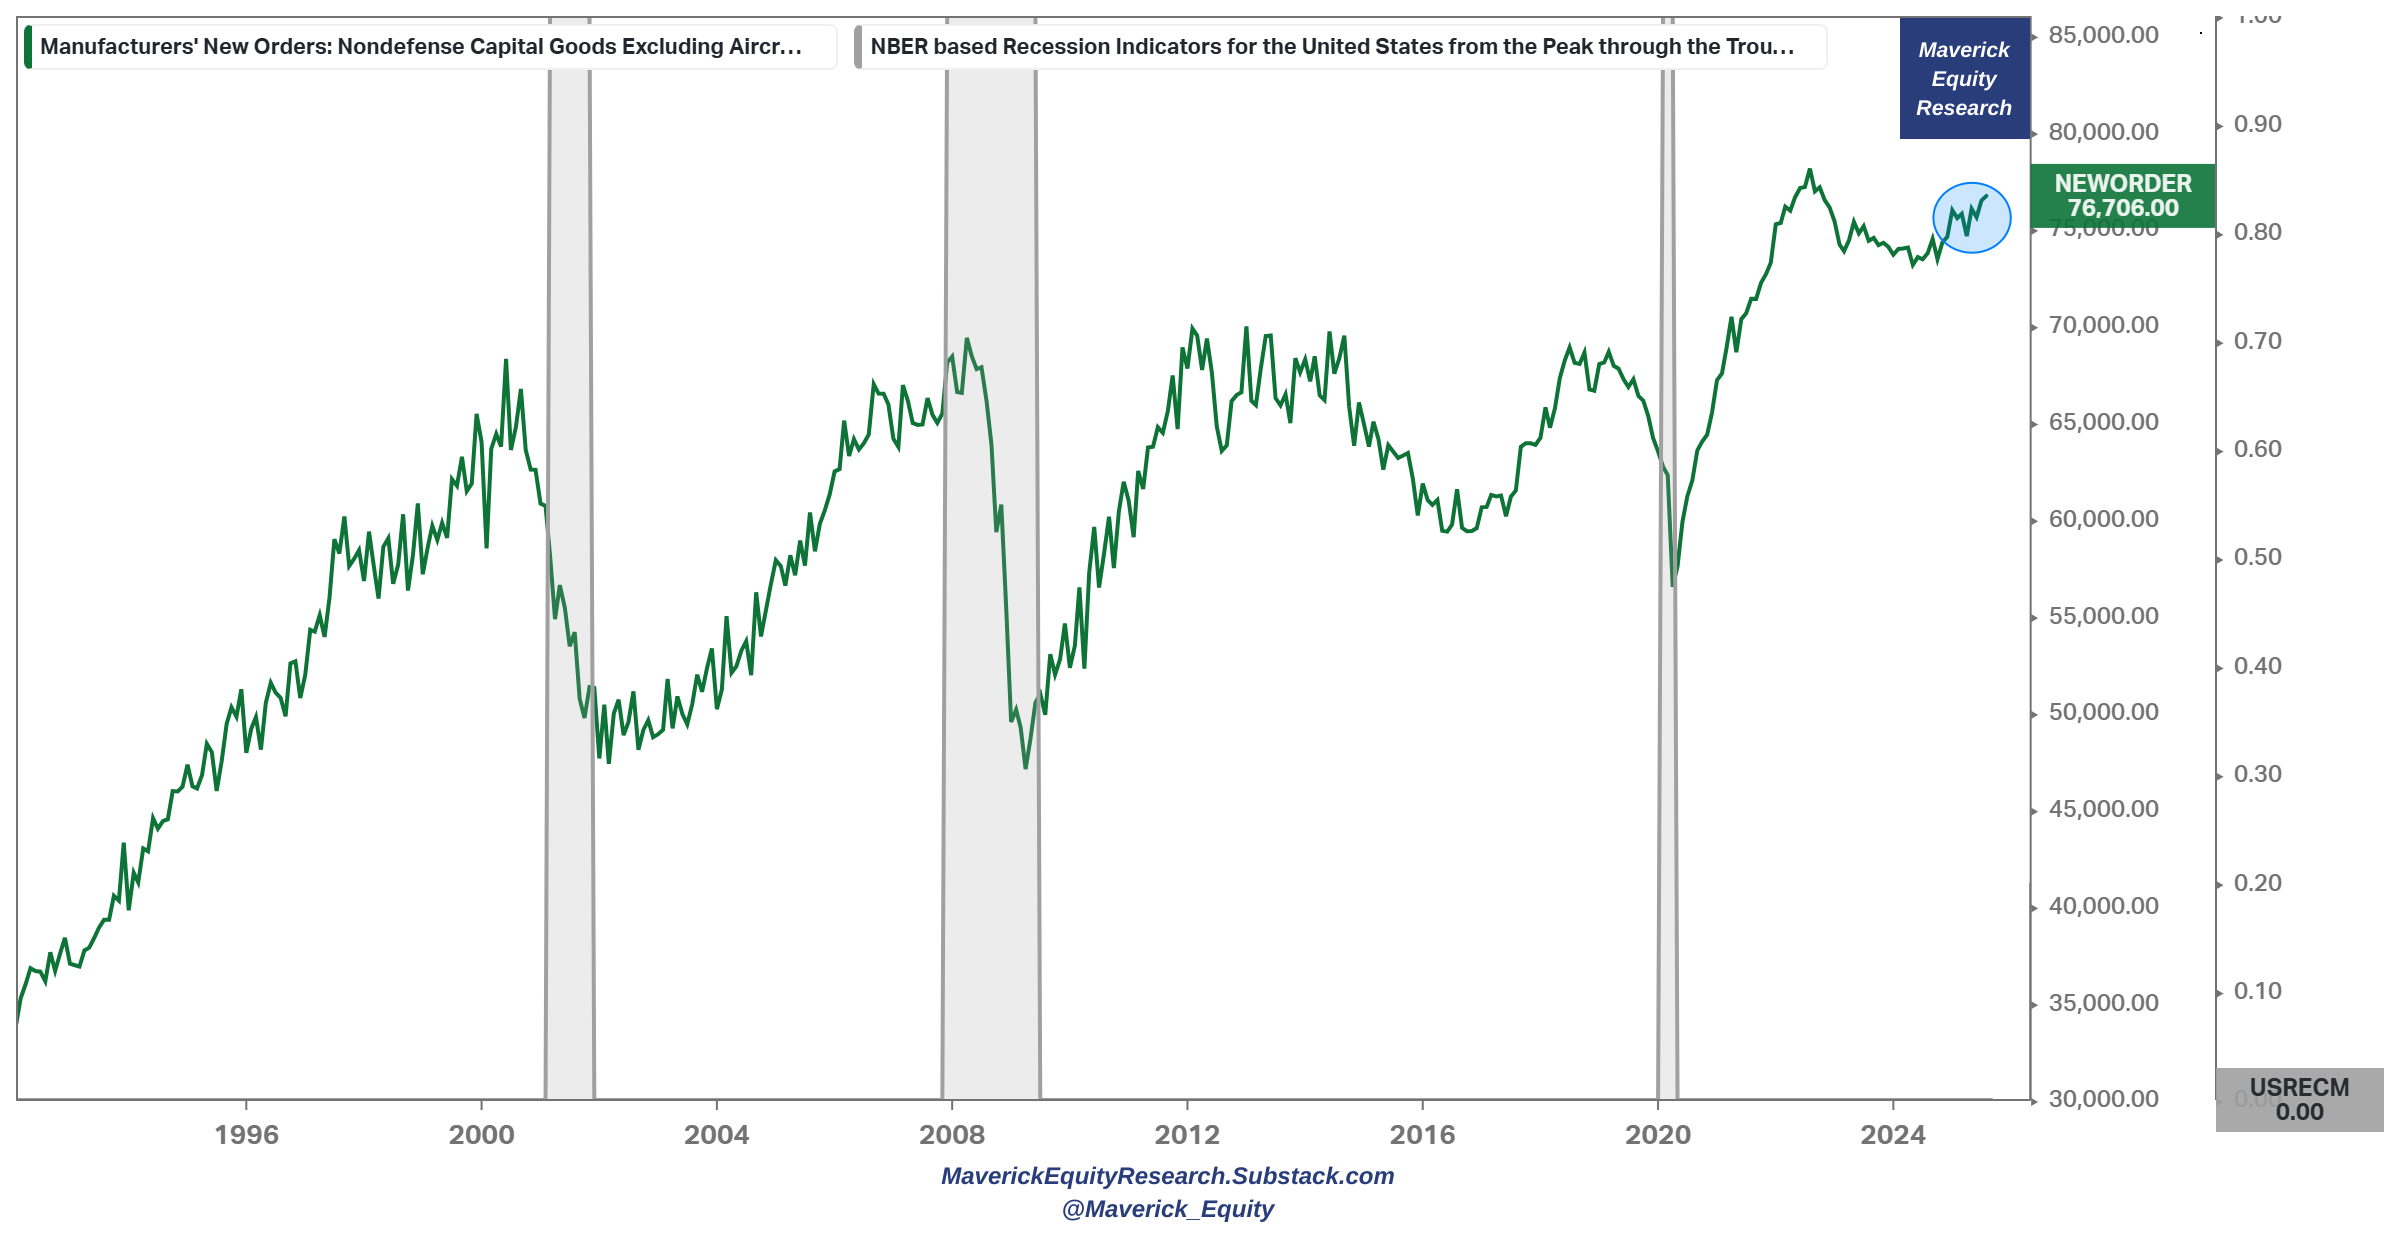
Long time readers will recognise this chart from my previous reports, hence updated.
This will be monitored & updated for any big swings be it up or down: see how it relates well to the business cycle with the grey bars showing the recession periods.
How is the Labor Market doing lately? It is not tight anymore by any measure:
👉 2nd month with more Unemployed People (red) than Job Openings (green) = the first time since April 2021
👉 7.227 million job openings VS 7.384 million unemployed people = as a ratio that is 0.97 in August from 0.99 in July
👉 simply put, not an ‘employees market’ anymore which will quite likely push down Wage Growth (which is still quite good), and that would cut Consumption, but on the other side it will help with inflation (Wage Growth is a “sticky” inflation variable)
Maverick’s net takeaway:
Unemployed People and Job Openings ‘matrix’ is a nice monthly visual overview, while one can always go deeper with other metrics for more insights & timeliness
via the future reports I will outline, explain and provide further insights via various live/daily/weekly metrics that are way more leading and forward looking
until then, a preview: the labor market is not tight nor hot, quite balanced overall

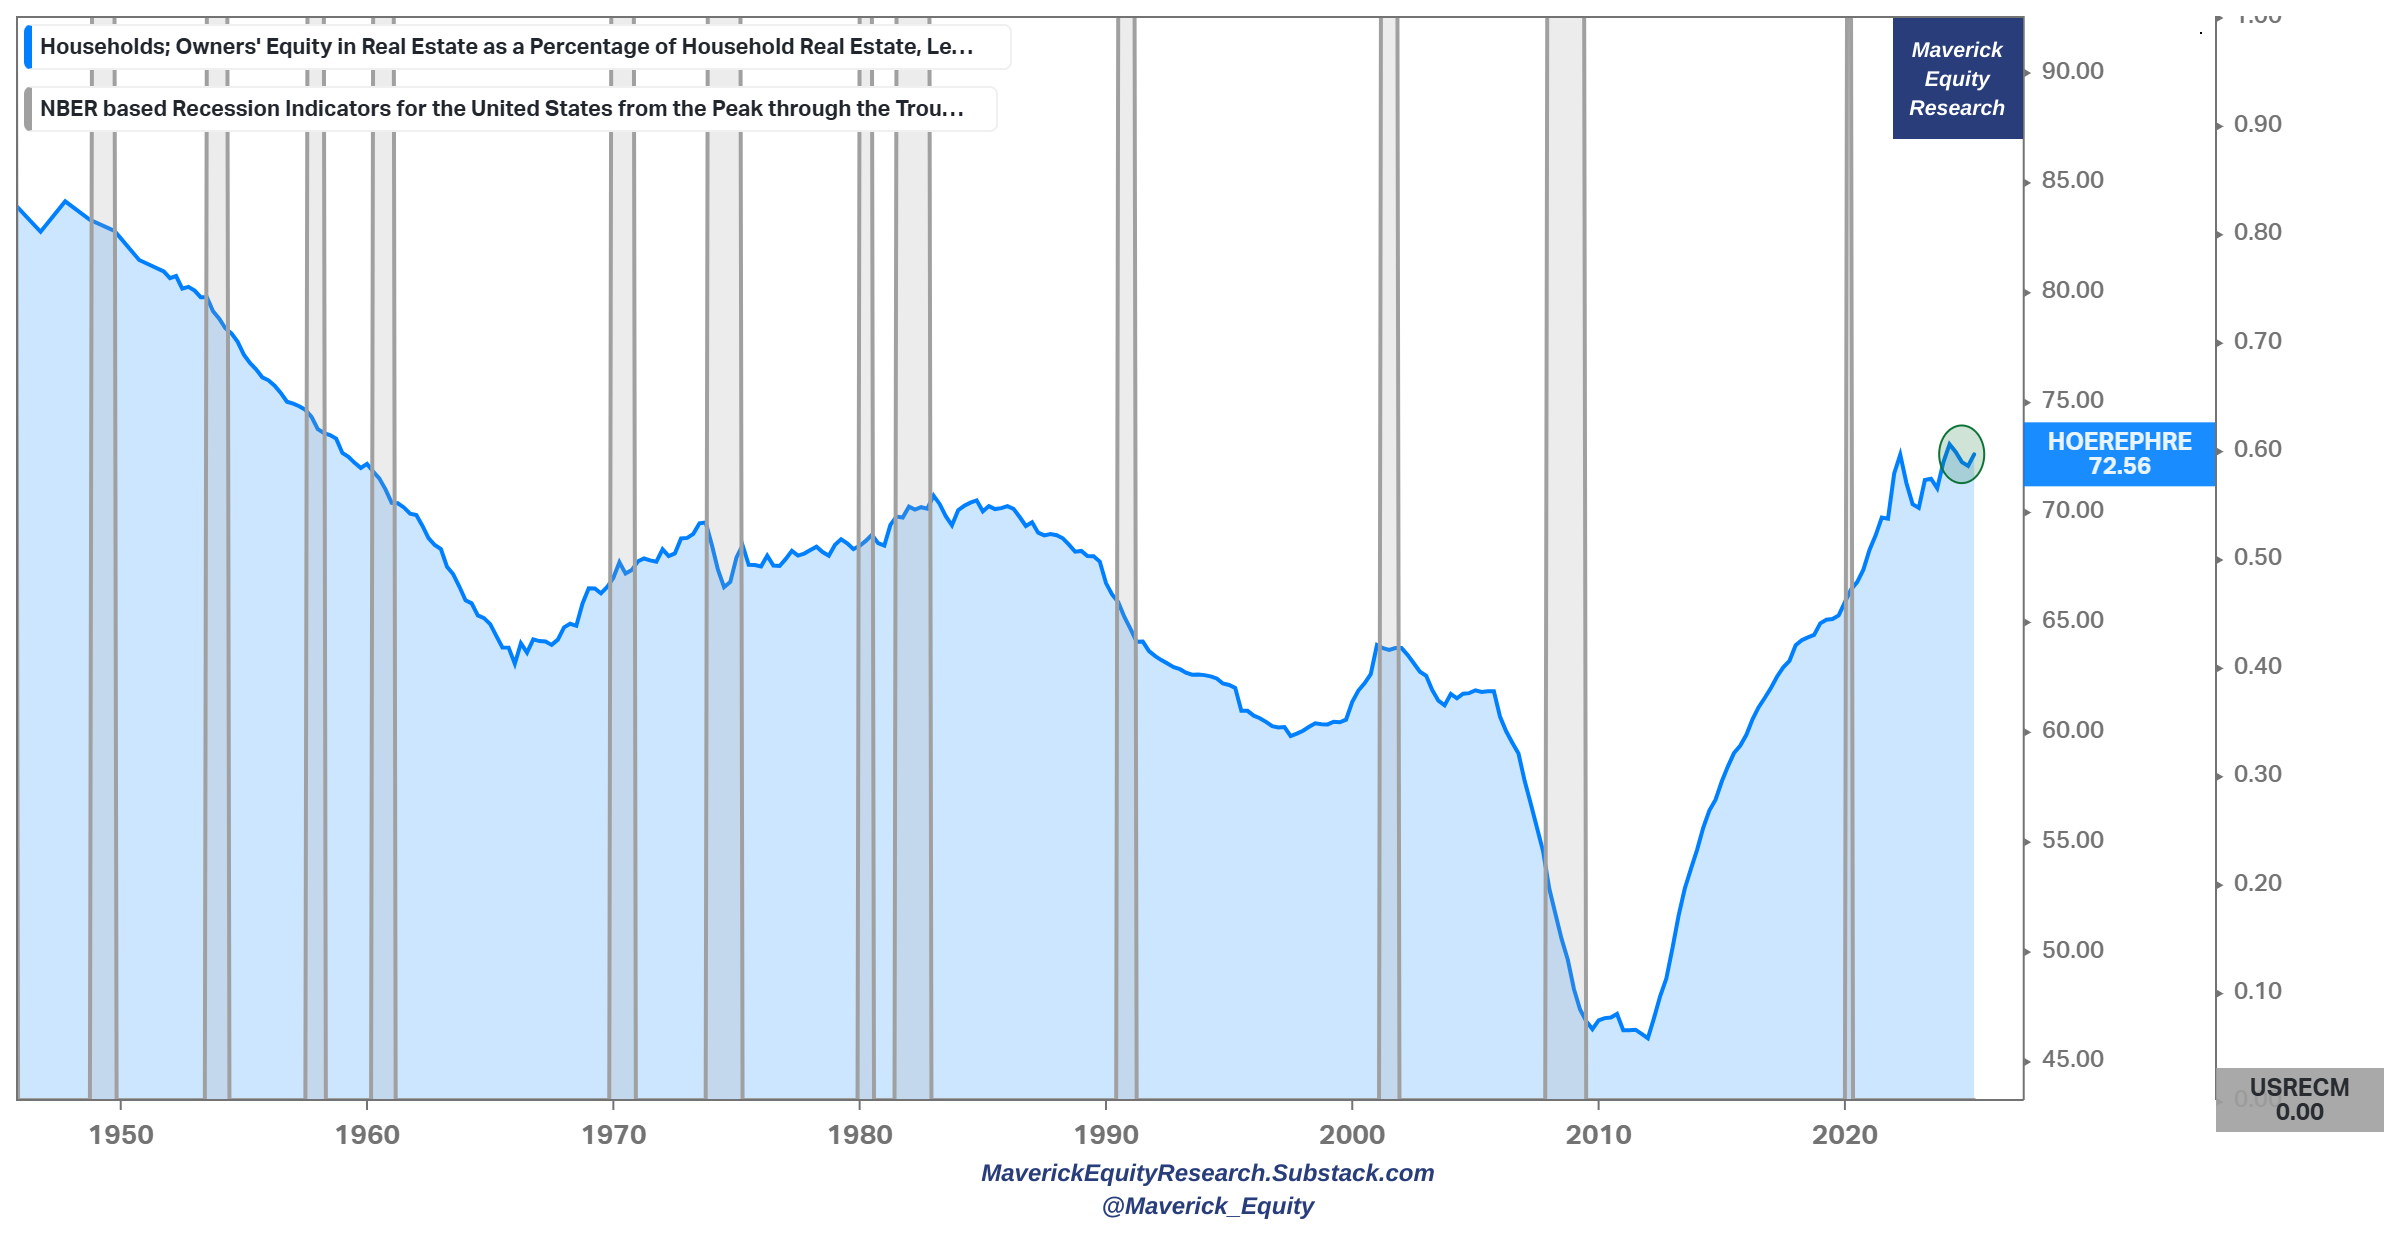
What about Housing & the Consumer? Well connected & stable? For that let’s look at the home equity values compared to the total value of household real estate
👉 Owners’ Equity in Real Estate as a % of Household Real Estate, solid at 72.56%
👉 the longest continuous stretch above 70% since the late 1950s, hence, we have the strongest Consumer-Housing Balance Sheet in 70 years
👉 “But what about affordability for new homeowners Mav?” Well, yes, it is low, but that is a side story, and in general, at any given point, it can’t be be ‘good’ for everybody (i.e. we cannot have high equity in the homes, high home values & great affordability for new/extra housing to buy)
Maverick’s net takeaway:
Housing will NOT take DOWN the Economy which I hear quite a lot these days
Owners’ equity in their homes is important via the ‘wealth effect’ which is real: higher confidence/sentiment, higher buffers, higher consumption patterns, invest more into stocks, bonds, Money Market Funds (MMFs), HELOC loans etc.
in general, Real Estate is a big part of the economy and with its many facets it is complex - therefore I will offer more dedicated insights via the next report:
✍️ The State of the U.S. Economy in 75 Charts, Edition #4
A natural flow of the above is the following: A History of American Recessions! And if there was subtitle for it, it would be: There Used to be MORE Recessions!
Frequencies:
👉 we had 34 recessions since 1855! Way less than most would guess! Especially nowadays, ‘judging’ by politicians and big parts of the media, the ‘feeling’ can easily become that we have a recession ALL the time …
👉 fewer recessions lately: 13 since World War 2 (1939)
Durations:
👉 Longest recession = 65 months from Oct 1873 to Mar 1879
👉 1930s Great Depression = 43 months from Sep 1929 to Mar 1933
👉 ‘The Great Moderation’ from the mid-1980s to 2007 = low and stable inflation with milder business cycle fluctuations
👉 Average overall = 17 months
👉 Average in the 20th & 21st centuries = 14 months
👉 Shortest = 3 months during 2020 Covid from Feb to Apr
Maverick’s net takeaway:
the business cycle is the business cycle and it will be around, I highly doubt we will ever properly tame it = Econ 101
with less recessions since WW2, note that we do on average get one every 6.5 years
knowing where we are in the current business cycle at any given point, hence the probability of a recession happening is important
yet the best thing to do at any given time = be prepared (should we not foresee it)

📊 Bonus: Gold in Goldilocks Mode 📊
Gold, the yellow shining metal has been shining brightly lately:
👉 it just topped $4,000 for the 1st time ever in history
👉 +54% in 2025 = best year in more than 4 decades, doubled in less than 2 years, and outpaced rallies during the pandemic and 2007-09 recession
👉 1979 madness = when it more than doubled as investors despaired of ever seeing the end of inflation
👉 as always I like to say, a 3-5% allocation to a diversified & balanced portfolio is a very good idea, it definitely serves very well these days

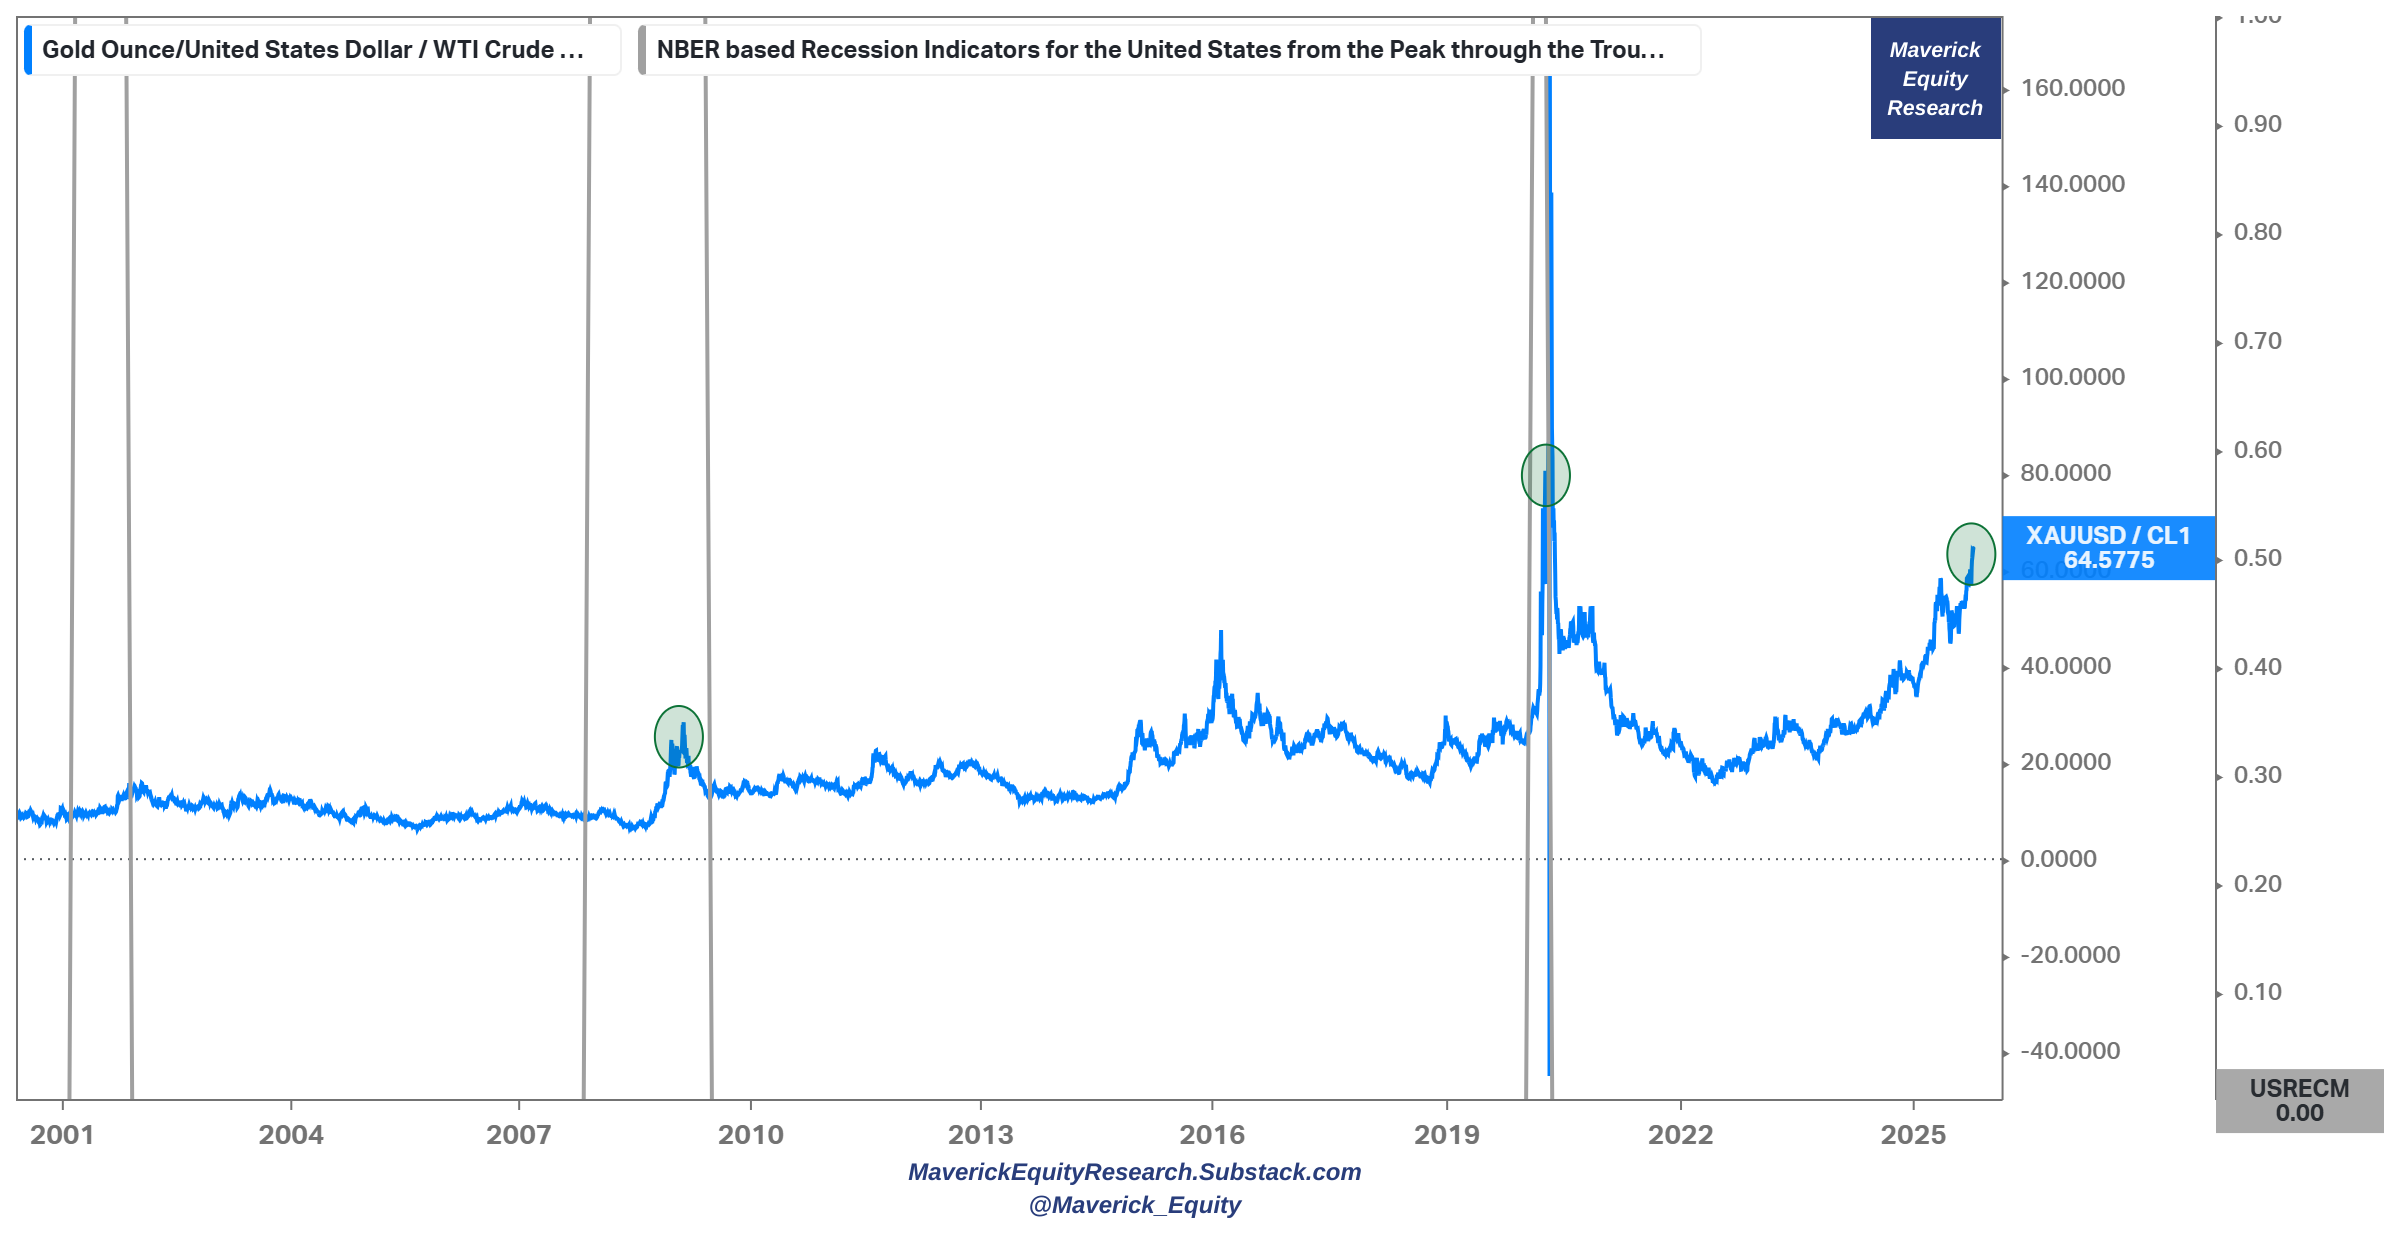
Every time there are big moves in Gold and/or in Oil, I like to make the ratio of the two and infer from there various insights and forward looking ideas:
👉 Gold-to-Oil ratio = 64.5, and the classical interpretation when the ratio surges is that of a rather warning signal (grey periods = recessions): rising gold prices reflecting growing fear and risk aversion, while conversely a dropping price in Oil indicating weak demand, aka weak confidence in the global economy
👉 I actually think “it is different this time” and the situation is not that bad: there are different variables at play this time around
Way more on Gold via a future dedicated Maverick Special report, stay tuned!
In case you missed my previous 7 Maverick Special reports, there you go, title & link:
✍️ Maverick Special Report #7: Margin Debt (Leverage/Borrowing) by Retail Investors
✍️ Maverick Special Report #6: U.S. Public Debt Reduction = Hard but Feasible
✍️ Maverick Special Report #4: Warren Buffett’s Cash Pile ... & More!
✍️ Maverick Special Report #3: U.S. Presidency - Does It Really & Deeply Matter?
✍️ Maverick Special Report #2: Value vs Growth ... or ... Value & Growth?
Additionally, I had a special situation/trade on Gold back in March, check it out:
✍️ Maverick Special Situation #6: 🪙 Gold Special Seasonality Pattern
Maverick Charts 39th edition done, 7 key charts with many insights!
You can check all the previous 38 editions in the Maverick Charts section!
Research is NOT behind a paywall and NO pesky ads here unlike most other places!
Did you enjoy this by finding it interesting, saving you time and getting valuable insights? What would be appreciated?
Just sharing this around with like-minded people, and hitting the 🔄 & ❤️ buttons!
That’ll definitely support bringing in more & more independent investment research: from a single individual … not a corporate, bank, fund, click-baity media or so … !
Like this, the big positive externalities become the name of the game! Thank you!
Have a great day! And never forget, keep compounding: family, friends, hobbies, community, work, independence, capital, knowledge, research and mindset!
With respect,
Mav 👋 🤝

As I mentioned before, gold is the only thing keeping me out of the red in my investment/retirement portfolio. Everything I read indicates future demand, but now speculation (and RSI) are flashing warnings. Last week was a small pause in the weekly rally, but today it kicked back into gear again. How this pans out is unknown, but the lack of data for decisions by the FED and the upcoming CPI, which determines TIPS returns will surely weigh heavily on investor sentiment. I currently have a four month plan, which will hopefully be met, AND provide a little more clarity for the short-term future. I'm considering going back to cash, but my thinking is now being modified by the highly unusual (and continuing) financial context. I never thought I'd see anything this crazy, but here we are. (my GDX holding is up 95% since March 5th)
I really appreciate the comments on home equity and its stabilizing effect. I worry about debt more than I used to, and we're looking to pay off the remaining mortgage balance and reduce our debt load by 25%. Less debt, less worry.
Thanks Maverick.
The gold-to-oil ratio was indeed a good indicator in the past, but with the advent of the new energy era, the demand for oil may not be as great as imagined in the past. This means that the price of oil is unlikely to rise significantly, so the gold-to-oil ratio may rise more because the oil price in the denominator is relatively low.