

Dear all,
4 + 1 cherry picked Maverick Charts of the week say 10,000 words or more = the ‘How’!
Table of contents = the ‘What’! Executed in a succinct manner with the aim of a high density of ideas, because great research respects the reader’s time:
📊 Maverick Charts: S&P 500 Bear Market & 2 Markets, AI FCF
📊 Bonus: Cybersecurity and Cyber-Risk in the Age of AI
Objective: both data-driven insights + valuable food for thought = the ‘Why’!
📊 Maverick Charts: S&P 500 Bear Market & 2 Markets, AI FCF 📊
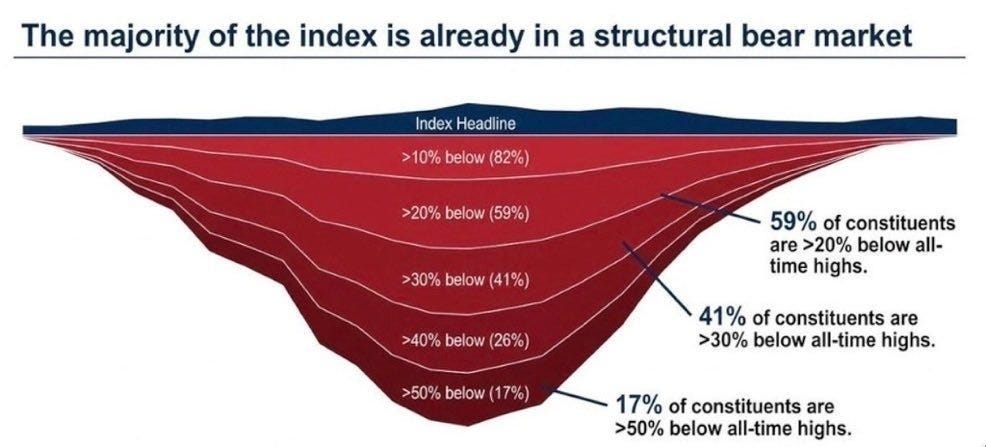
S&P 500 = Now in a Bear Market! Yes, despite very close to all-time highs!
Index drawdown dispersion, a very special & rare chart:
👉 82% of constituents are > 10% below all-time highs
👉 59% are > 20% below ATHs
👉 41% are > 30% below ATHs
👉 26% are > 40% below ATHs
👉 17% are > 50% below ATHs
= a case of a bear market inside a bull market with all-time highs!
= majority of the index, 59% is structurally in a bear market!
= a big chunk of it, 43% (26% + 17%) is in a big bear market: 40-50% below ATH
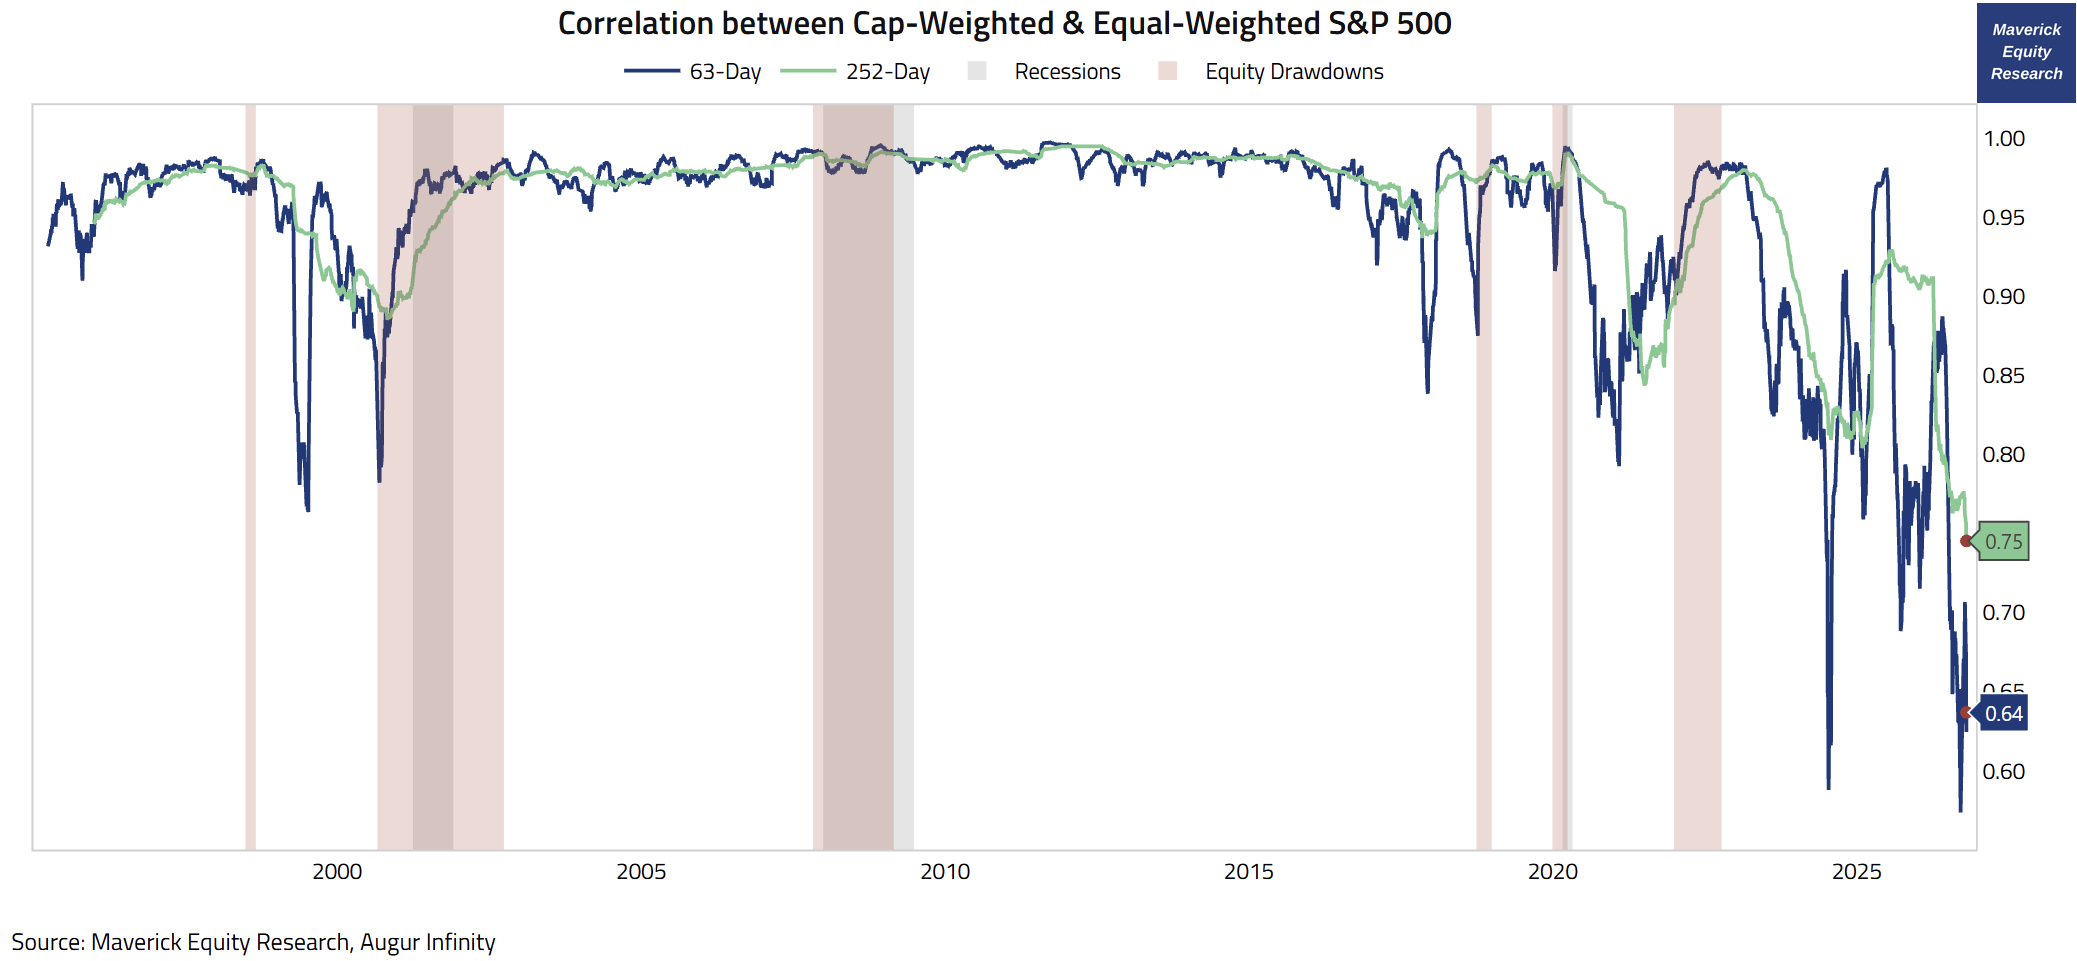
S&P 500 = one index, but two markets these days — we can say via the 3 & 12-months correlation between Cap-Weighted & Equal-Weighted S&P 500 since 1995:
👉 3-months / 63 day correlation (blue) = 0.64 vs 0.93 average since 2011 -- and it dipped even below 60 just 3 weeks ago when it was 0.57, the lowest in the series
👉 12-months / 252 day correlation (green) = 0.78, a record low also
AI big bet is masking what is beneath the surface. It takes more than a few companies to tango for the dance is nice & smooth, or ‘suave suavecito’, right? 😉
P.S. this is not all bad, it creates an opportunity to shop among high quality businesses at decent valuations, both inside the S&P 500, but especially among small & mid caps. I will cover these in the dedicated section, while until then, the preview is already out:
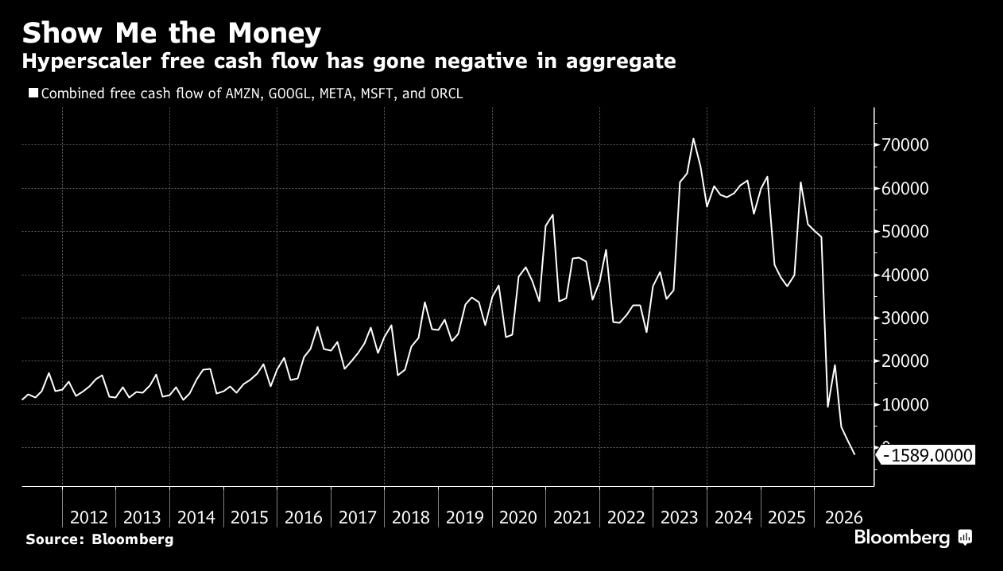
AI & Hyperscaler’s & Free Cash Flow (FCF) aka 'Show Me The Money':
👉 combined Hyperscaler’s FCF has just switched negative!
👉 from positive +$70b to negative -$1.6 billion in 3 years
👉 and let this one sink in: that $-1.6 billion is without counting the hundreds of billions they borrowed or the trillions in off balance sheet obligations …
The S&P 500, AI and way more will be covered by the future Maverick reports:
✍️ Maverick’s AI Long-Term View
✍️ AI ROI CAPEX = A Pressure Cooker
✍️ Is AI in Bubbly Territory?
✍️ S&P 500 Report: Valuation, Fundamentals, Special Metrics & Leading Indicators
✍️ S&P 500 Report: Performance, Sentiment, Seasonality, Technical Analysis
✍️ Is the U.S. Stock Market in a Bubble?
✍️ Market Pockets of Overvaluation, Animal Spirits Behaviour and Bubbly Territory
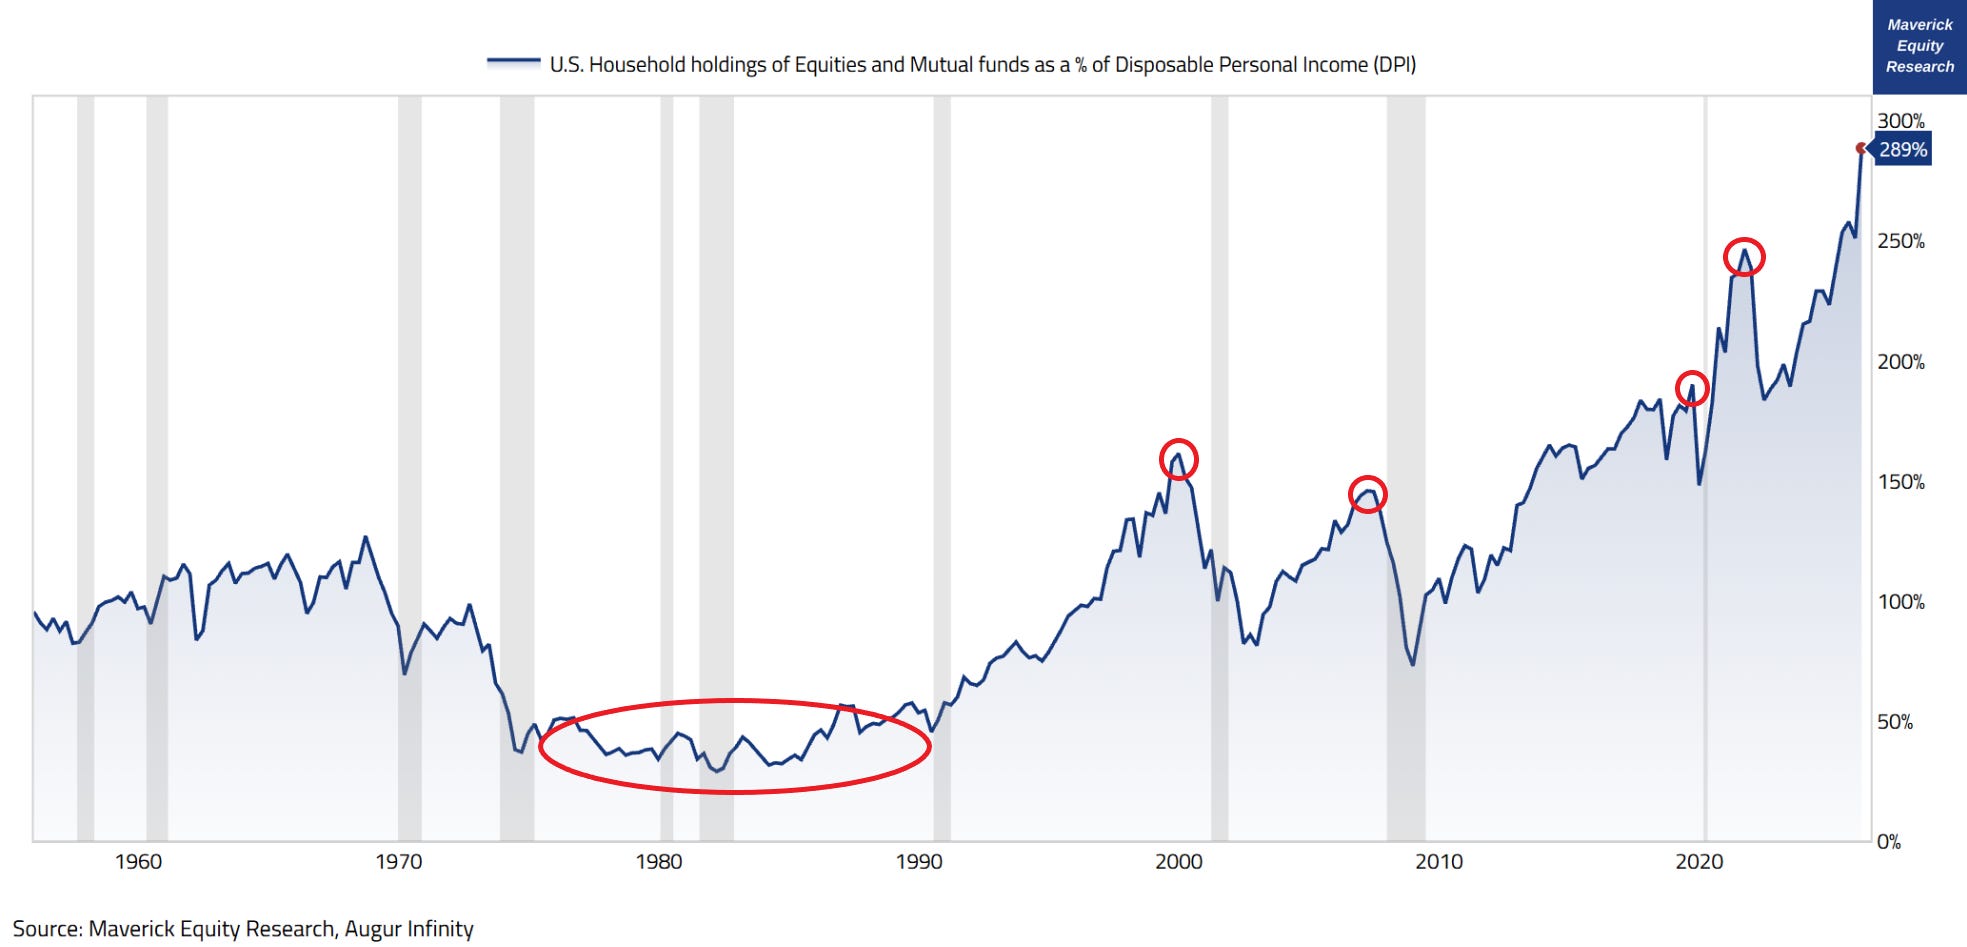
U.S. Household holdings of Equities and Mutual funds as a % of Disposable Personal Income (DPI) as after-tax income available for spending or saving so that I answer the question: “Mav, what is the relationship between Disposable Personal Income (DPI) people currently have, and their Equities and Mutual Funds holdings?
👉 1985 was the start of the U.S. high financialization / equity ownership culture, which was 5 years after 401(k) plans were introduced, and one of the most important structural drivers in my opinion — ratio was around 40% back then
👉 2000 = 160% ratio at the Dot-com peak
👉 2007 = 146% ratio at the GFC/Lehman peak
👉 2019 = 190% ratio at the pre-Covid peak
👉 2021 = 247% ratio at the Covid stimulus driven stock market mania peak
👉 2026 = 289% ratio, a whooping number = all-time highs and almost 2x since 2016!
Overall, U.S. households are very tied to equity markets, and these days, at historically unprecedented relative to disposable income!
Further key notes and food for thought for nowadays:
👉 The Wealth Effect is very real, and it works and cuts both ways:
consumption increases with higher sentiment riding on high(er) stock prices via the ‘wealth-driven consumption’ channel
the next selloff would hit spending way harder than it used to given that Income is what Households spend and use to absorb shocks:
at 2.89x times income, just a 20% equity drawdown wipes out over half a year (6.9 months) of income in paper wealth
30% equity drawdown wipes out 10.4 months
40% equity drawdowns wipes out more than a year of income, 13.9 months
all these are way bigger hits than at 1.6x times in 2000, and 1.46x in 2007
👉 Households are all in and big time the stock market
that is very good, as long as they have also some other assets, a buffer, a decent and safe job — people realised more and more that there is a big divide in the economy between capital and labor, and hence you have to be invested
from ‘can’t beat ‘em, join ‘em! to ‘I am part of this, I own, not just that I am not left behind, but I can even thrive!’ — this is a big factor why US productivity is way higher versus many other countries where equity ownership is lower or very low!
P.S. I see so much AI slop around lately, and now I fully understand why it is slop given that I tried to recreate this last chart with the help or entirely with AI. Steps:
I needed to have the idea
establish the possible derived insights as an objective from the initial idea
know which data you need
have access to the data, and where to get it from
data transformations:
2 raw data series here: one is in millions, one is in billions, hence had to transform one or the other to be in the same units
do the ratio of the 2 data series
decide which time period to use
visualise it nicely: add title, select chart type, choose color, adjust the scale, add recession periods, circles, annotations etc
add my logo = Skin In The Game (STIG) because 'STIG’ for the win!
understand the chart: the economic history, context and meaning
explain the visualised data / the chart by writing in order to deliver the insight!
So, all the ‘premium’ AI models I myself pay for could not do this ‘chart mini-project’!
that is the difference between AI, AI slop and doing the real work
also, there is a way bigger understanding when one understands the underlying data, works with it, hence the final delivered insight!
P.S. on the chart:
yes, 10 steps, time, data costs and work in order to do ‘just a chart’ — this is like cooking, way harder to buy the ingredients, cook, serve … than eat the meal 😉
I am a problem-solver, building what people will find valuable decades from now
all about building ‘something’ valuable, not about being ‘somebody’ (fragile egos)!
a realist-optimist, an explorer and a builder, a maker not a taker!
Additionally, a general yet important note for AI and investment decisions:
no matter how intelligent AI models will ever be, they will never replace or beat serious personal understanding, instill confidence
hence, the much needed conviction that we chose the right investment!
📊 Bonus: Cybersecurity and Cyber-Risk in the Age of AI 📊
= surging now … as expected! “Any special visual tracking this major one, Mav?”
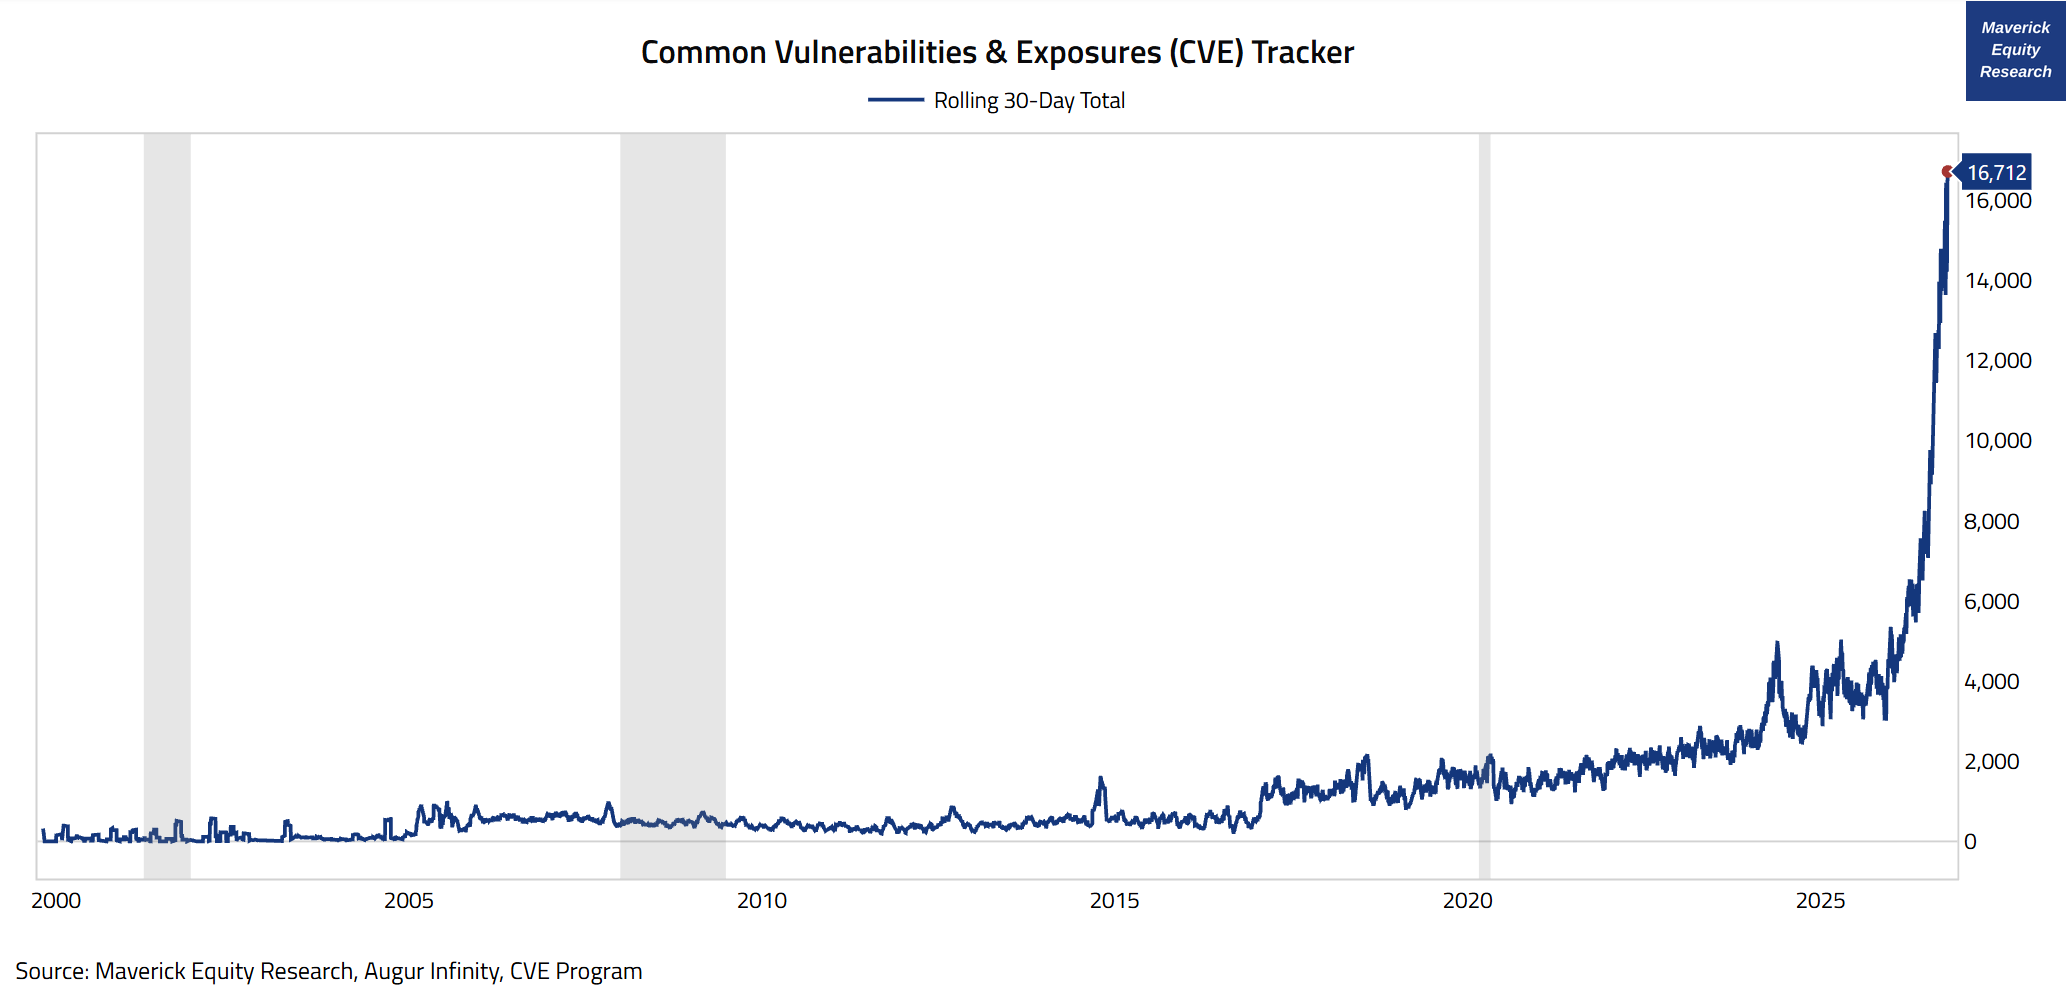
Common Vulnerabilities & Exposures (CVE) tracker:
👉 16,712 (rolling 30-day total) = a staggering daily velocity of security disclosures challenging SecOps teams across the world
👉 ‘PHP crisis’: PHP is an open source software that underpins much of the internet: banking, e-commerce, airlines, government services you name it!
👉 AI scripts and frontier models were used to find severe security holes that had gone undiscovered for more than a decade
👉 Palo Alto Networks estimates that 1/3 of the many vulnerable systems have legacy software that can’t be even patched
AI speed era will cause a lot of disruption, which can also be an opportunity …
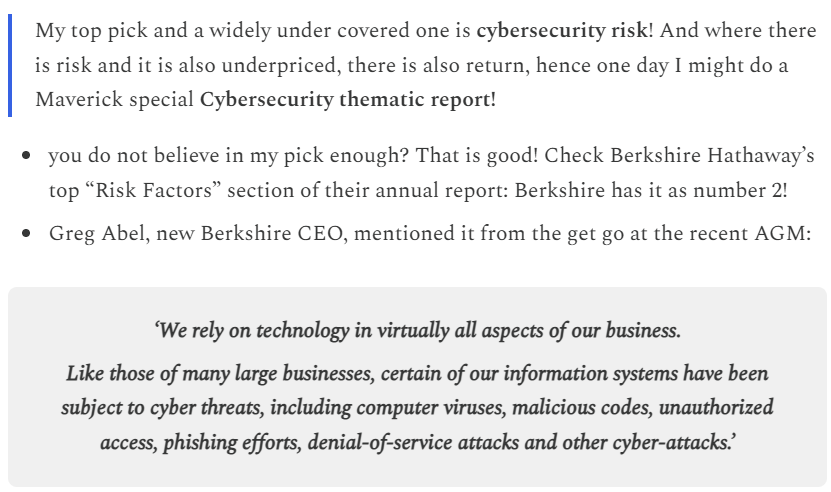
P.S. in the ✍️ Maverick Macro Charts of the Week #58 from July I had my number one risk as cybersecurity risk:
In case you missed my latest post, this one on the future model portfolios is key:
Maverick Charts 65th edition done, 4 key charts with many insights + 1 Bonus!
You can check all the previous 64 editions in the Maverick Charts section!
Mission accomplished for me if the following resonates with you:
‘Hmm I never thought it that way’, ‘now that chart said a whole lot’, ‘now that chart was really interesting’, ‘now that is something new’, ‘now I got it!’, ‘you managed to turn something complex into something actually simple’
hence, if you got to see something differently, my approach gave you a different angle, it did help you connect your key dots, then we all do well here!
Research is NOT behind a paywall and NO pesky ads here unlike most other places!
Did you enjoy this by finding it interesting, saving you time and getting valuable insights? What would be appreciated?
Just sharing this around with like-minded people, and hitting the 🔄 & ❤️ buttons!
That’ll definitely support bringing in more & more independent investment research!
Like this, the big positive externalities become the name of the game! Thank you!
Sharing = 3x win: you + your close ones + me!
Have a great day! And never forget, keep compounding: family, friends, community, capital, knowledge, research and mindset!
With respect,
Mav 👋 🤝
“Compound interest is both the ultimate and biggest natural hedge!”
Maverick Equity Research

The 3-month correlation between cap-weighted and equal-weighted S&P 500 at 0.64 versus a 0.93 average shows how much index strength rests on a narrow group of stocks.