✍️ S&P 500 Leading Indicator, Insiders Action, Equity Supply & Investment Themes by Decades = Maverick Equities Charts of the Week #57
4 + 1 Maverick Charts that say 10,000 words

Dear all,
first of all, it's a great occasion to welcome the +1,500 new subscribers from great and diverse backgrounds, for a total of 24,000 subscribers across all 50 U.S. states and 169 countries!
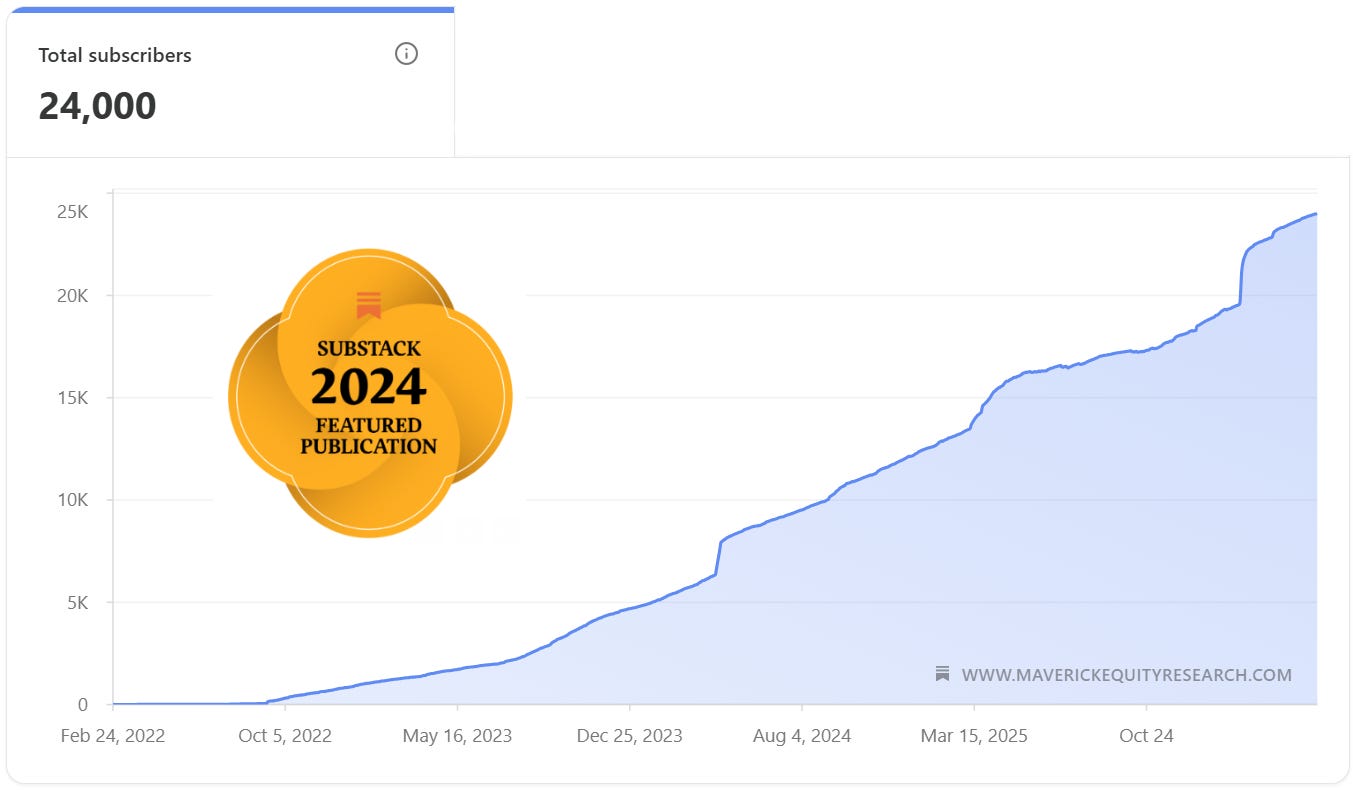
Table of contents & preview:
4 + 1 cherry picked Maverick Charts of the week say 10,000 words or more = the ‘How’!
Table of contents = the ‘What’! Executed in a succinct manner with the aim of a high density of ideas, because great research respects the reader’s time:
📊 Maverick Charts: S&P 500 Leading Indicator, Insiders Action, Equity Supply
📊 Bonus: Investment Themes by Decades
Objective: both data-driven insights + valuable food for thought = the ‘Why’!
📊 Maverick Charts: S&P 500 Leading Indicator, Insiders Action, Equity Supply 📊
As you all know, it is a Realist-Optimist doing the independent research here, hence humanity will continue to make progress, economies will evolve and financial markets will just reflect and price all that by going up over the medium-long term!
Yet, with this occasion I will highlight some rather cautious-bearish, yet key points:
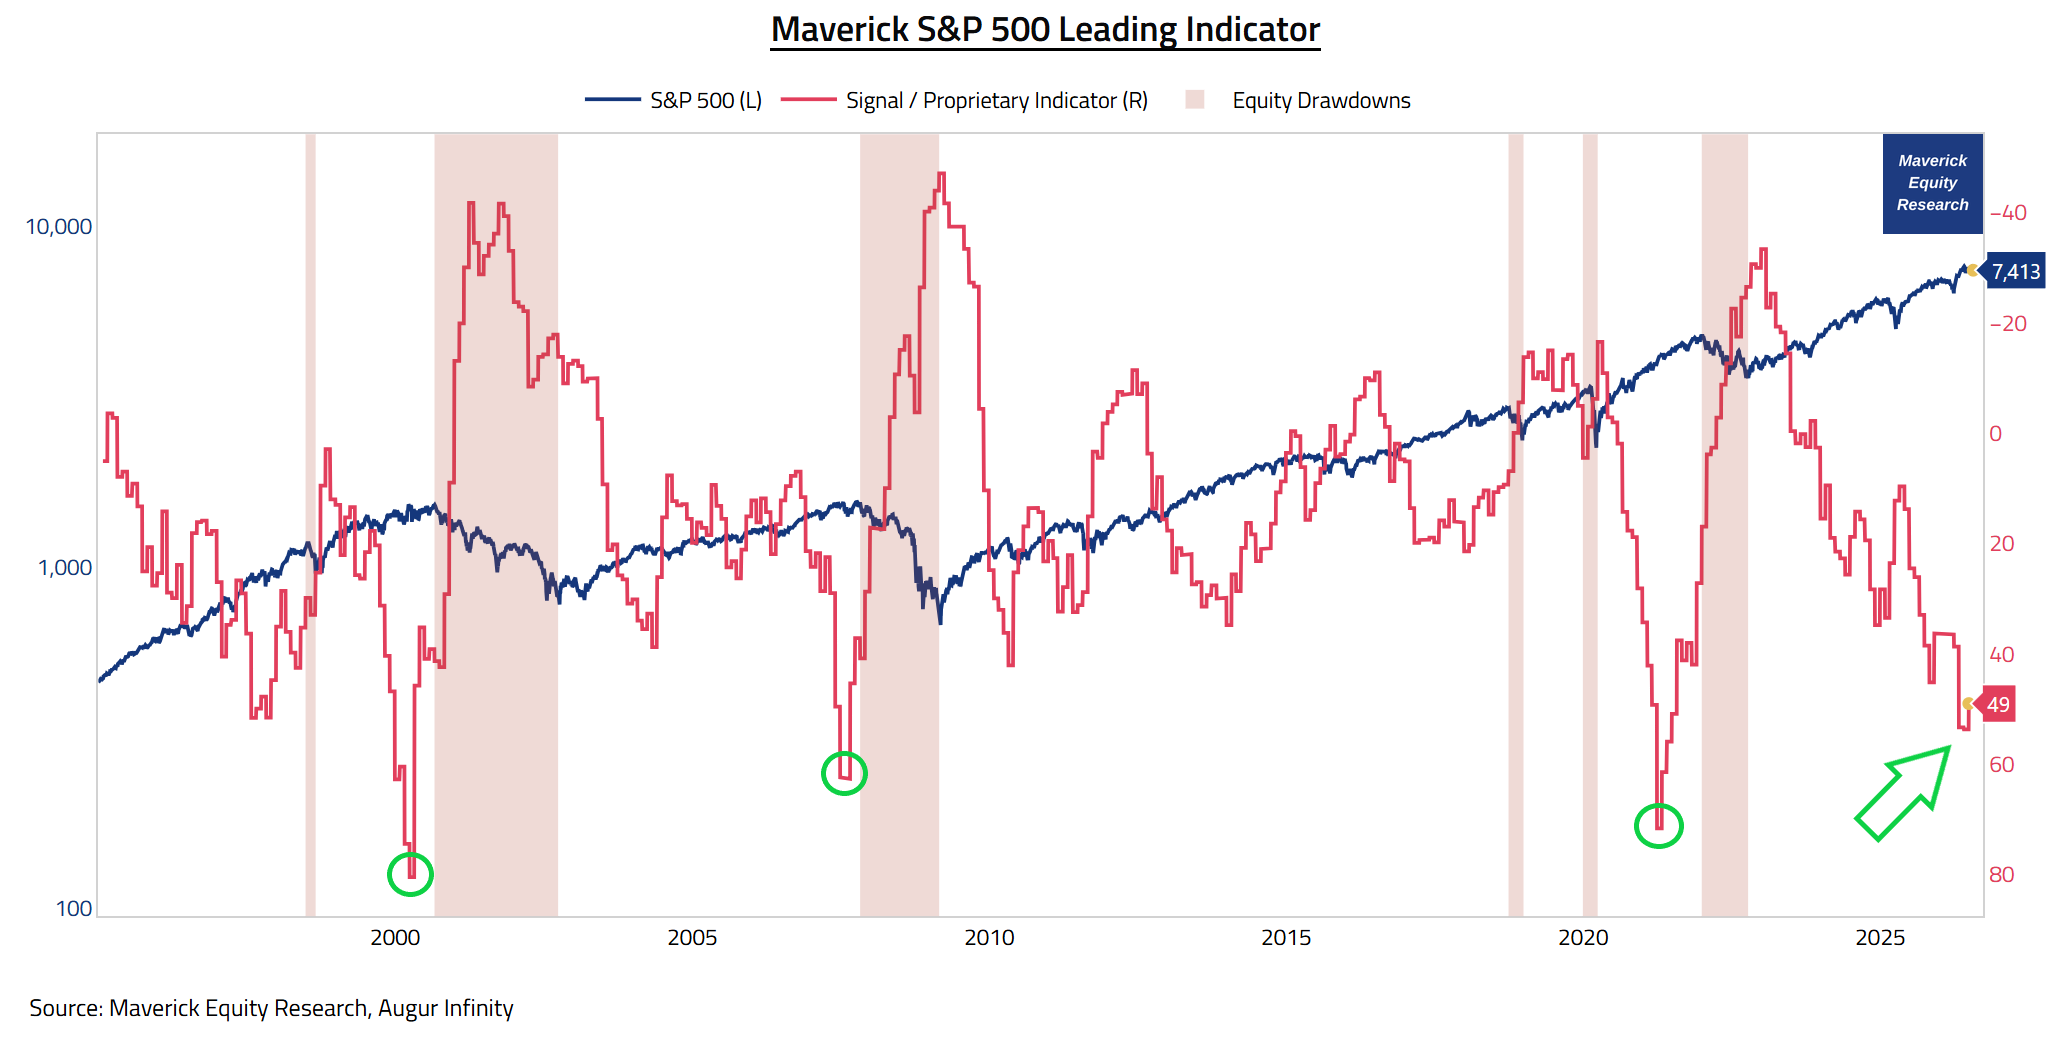
First of all, introducing the 1st Maverick S&P 500 Leading Proprietary Indicator:
👉 it did catch very nicely the last 3 major market peaks over the last 3 decades — shown in the chart as the red shaded areas corresponding to equity drawdowns:
2001 Dot-com bubble
2007-2009 Global Financial Crisis (GFC)
2022 bear market
👉 49 now, it has to cross 60 first for the signal to be very strong
👉 after it has to invert, and once inverted 3-9 months from there
Takeaway:
In the current cycle it did not cross 60, and lately it even reversed from 54 to 49, hence it is not flashing red, but more like an overvaluation warning sign for now.
N.B. indicator is NOT the Yield Curve, but has to invert like it … and like Maverick in Top Gun, hence only AFTER it is ‘flipping the birdie’ — pun intended 😉!
N.B. there also other indicators, and confidence increases materially when more and more independent signals start to align.
What are U.S. Corporate Insiders doing lately, buying or selling their own stock?
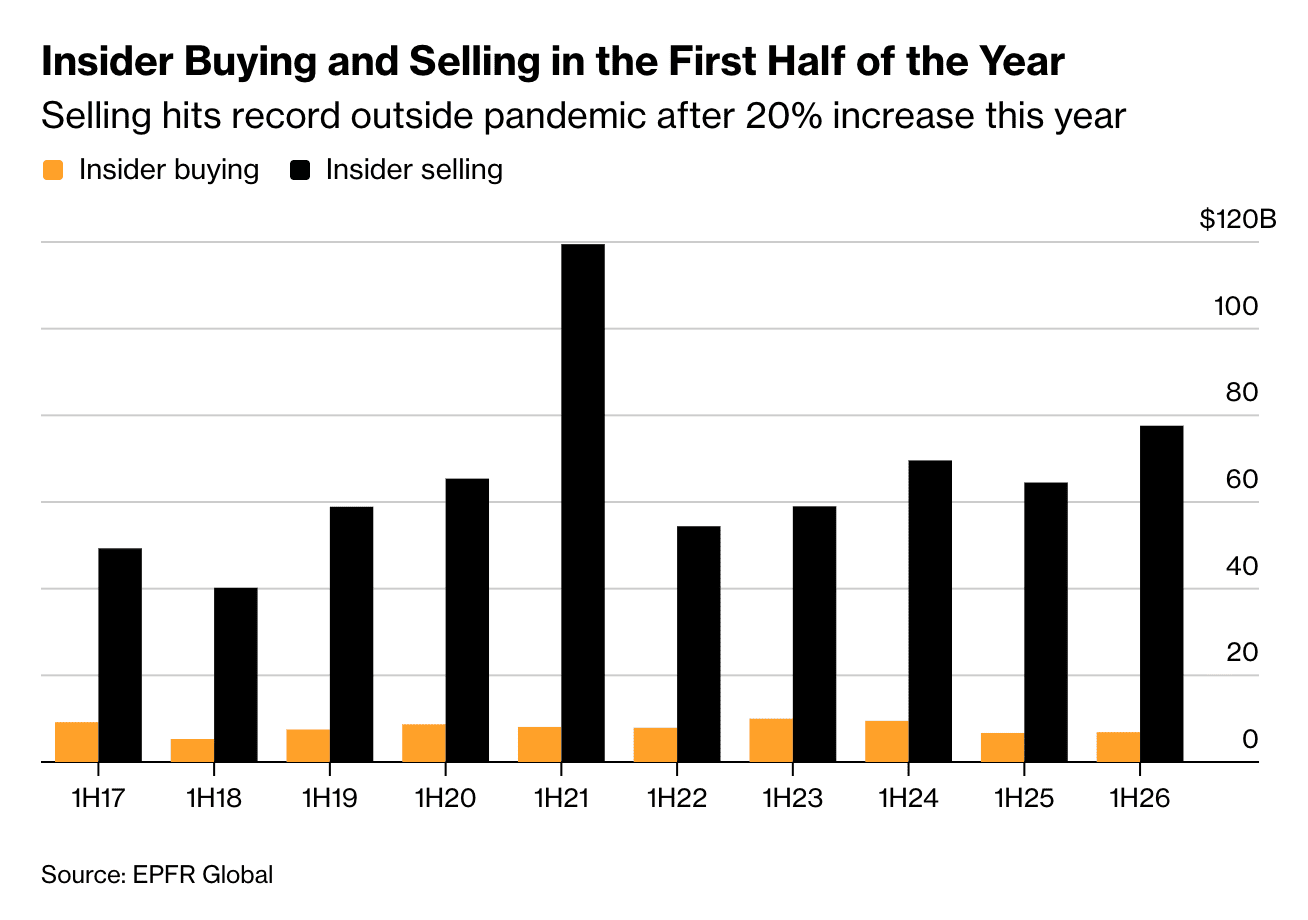
👉 sold $77.6 billion during the 1st half of 2026 = a 20% increase from a year ago!
👉 the only time the selling spree was more intense was guess when? back in the 2021 stock market mania …
👉 big time selling from the insiders can also just mean them diversifying their human capital with financial capital — I can’t blame them at all for that, I and most of us (I guess) would do similarly these days given the massive rally we had in the last years, especially as some high beta momentum names went parabolic for no real fundamental reason (there is a lot of casino behaviour in the markets these days)
Takeaway:
I see this as a bearish sign on the back of current high valuations — and not as a sign of panic selling which would be a different way more concerning story.
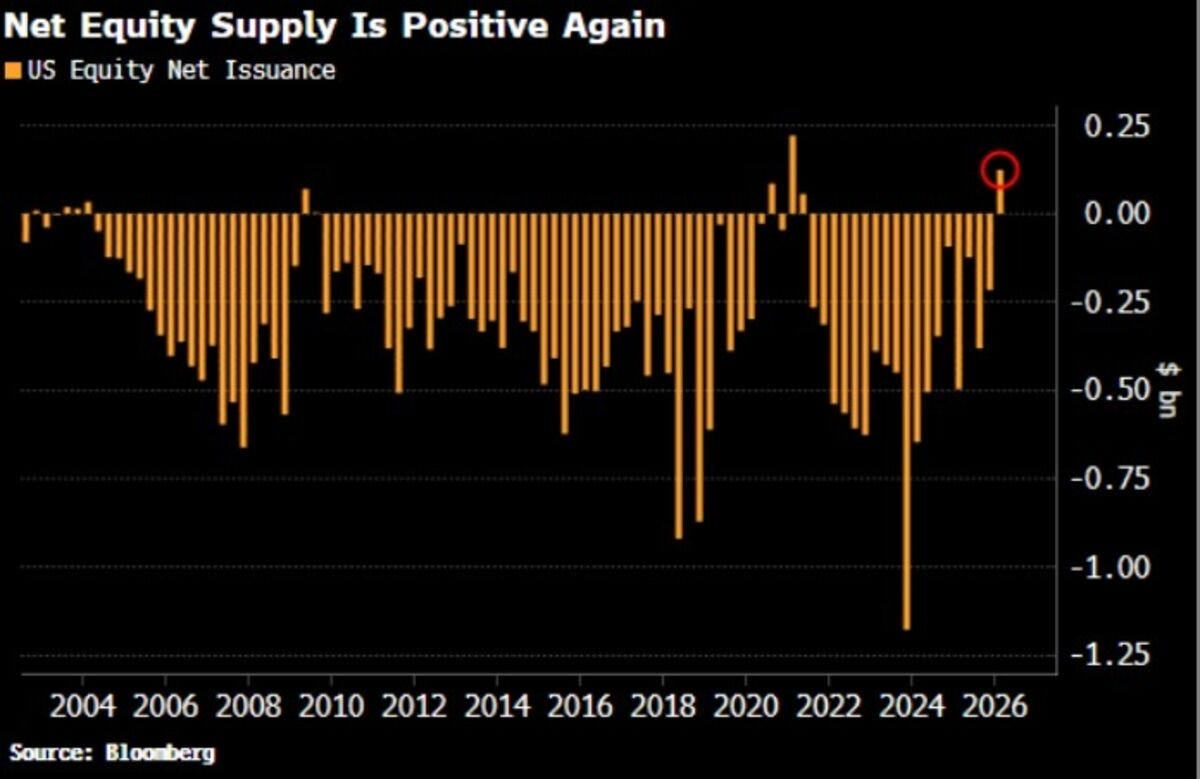
Net Equity Supply Is Positive Again = meaning companies issuing stock, paired to less stock buybacks:
last time it happened was in the 2021 stock market mania & 2009 GFC
nowadays Wall Street is creating a lot of supply for all the AI demand
Takeaway:
More stock issued & less stock buybacks signal a market with stretched valuations.
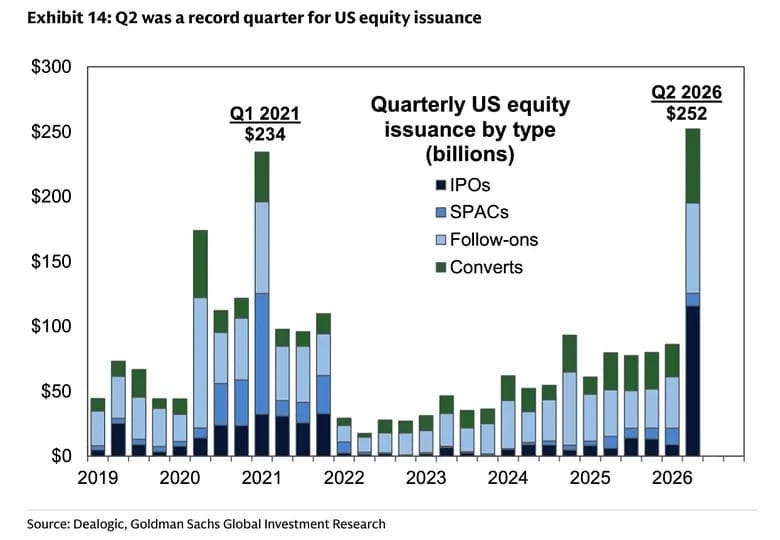
Equity Issuance standalone:
Q2 was a record quarter
higher even than during the 2021 stock market mania
Takeaway:
Record stock issuance, especially as SPACs are back big time, also indicate a market with stretched valuations.
All that and way more, will be covered by the future Maverick Special reports:
✍️ S&P 500 Report: Valuation, Fundamentals, Special Metrics & Leading Indicators
✍️ S&P 500 Report: Performance, Sentiment, Seasonality, Technical Analysis
✍️ Is the U.S. Stock Market in a Bubble?
✍️ Market Pockets of Overvaluation, Animal Spirits Behaviour and Bubbly Territory
📊 Bonus: Investment Themes by Decades 📊
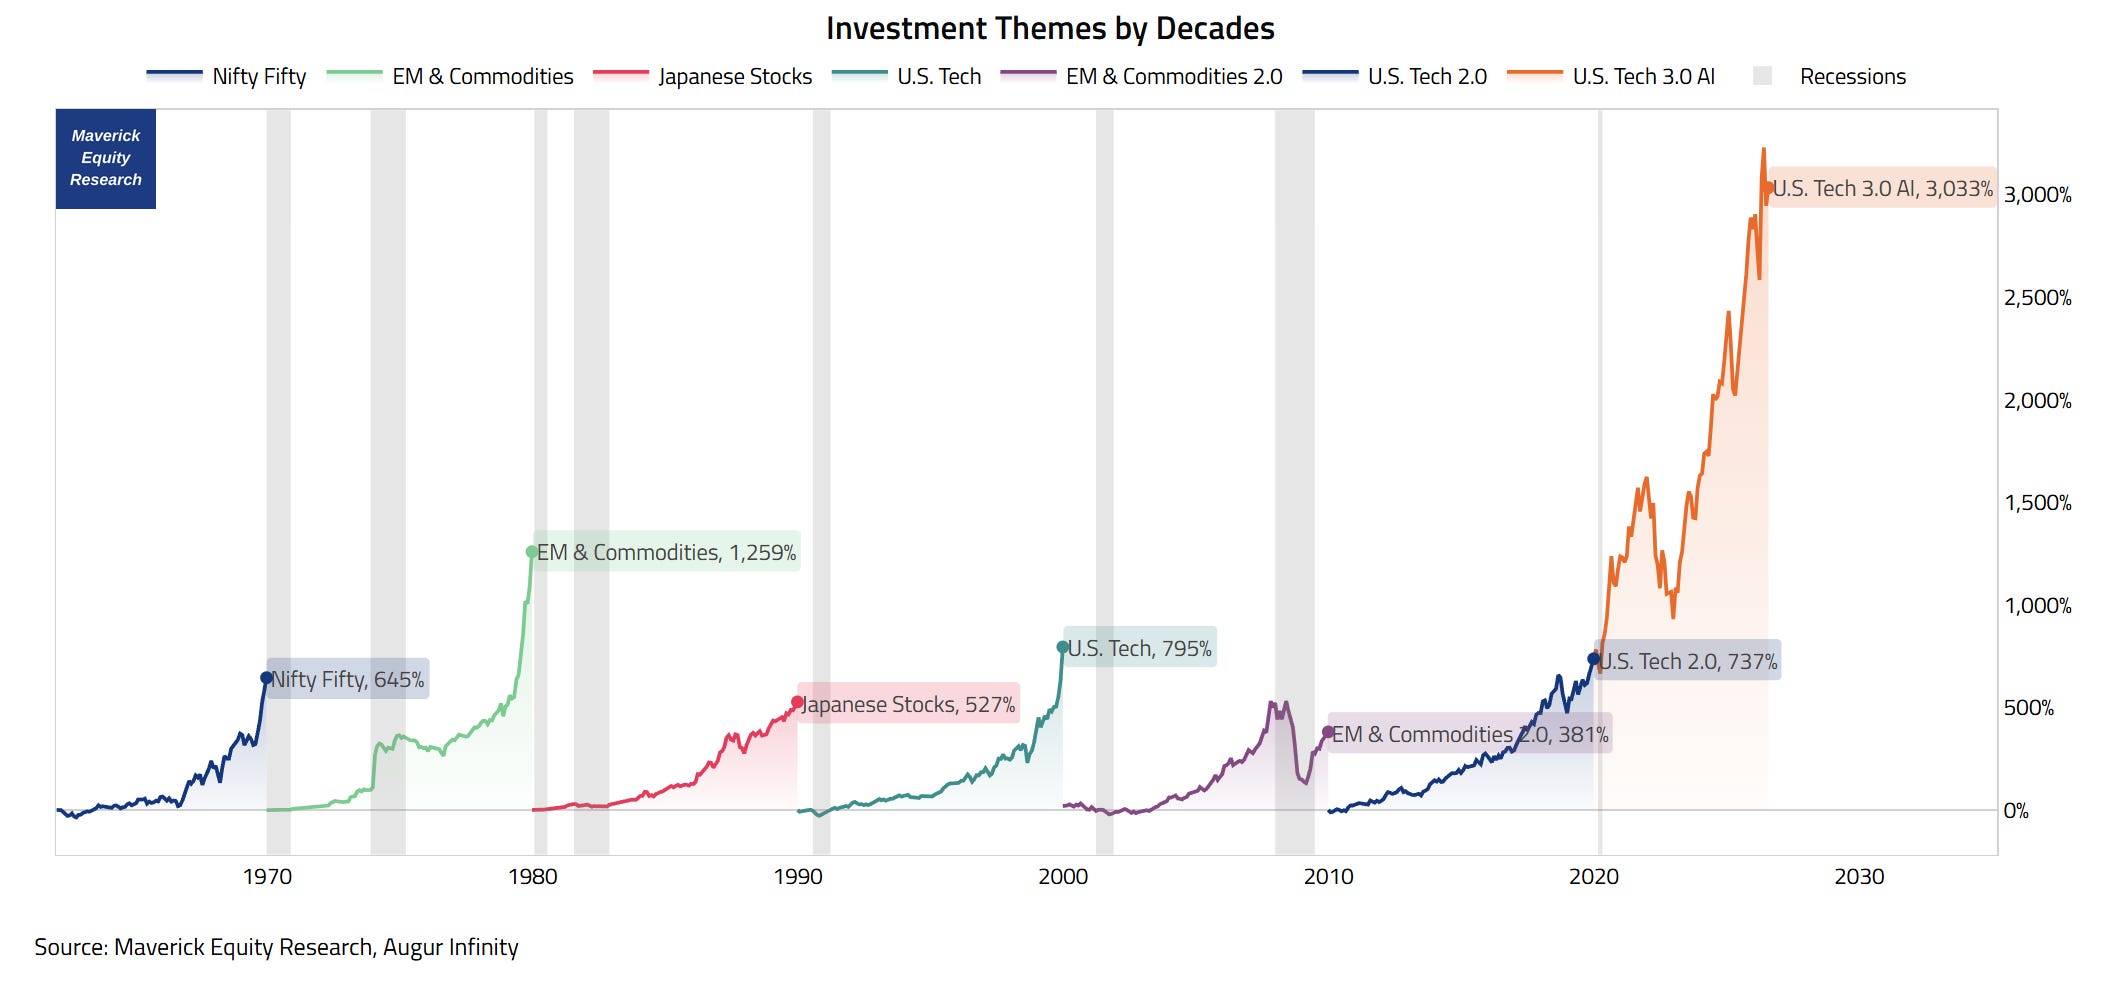
Investment Themes by Decades & their Returns!
👉 Nifty 50 until 1970 = 645%
👉 EM & Commodities until 1980 = 1,259%
👉 Japanese Stocks until 1990 = 527%
👉 U.S. Tech until 2000 = 795%
👉 EM & Commodities 2.0 until 2010 = 381%
👉 U.S. Tech 2.0 until 2020 = 737%
👉 current U.S. American Tech 3.0 with AI = a whooping … drum rolls … 3,033%
Food for thought … thoughts?
P.S. next Maverick Special research reports will cover the two mighty AI questions:
✍️ Is AI in Bubbly Territory?
✍️ AI & Jobs – The Ultimate Question & Conundrum
As well, on the AI CAPEX big cycle we are having currently I am working on 2 Maverick proprietary indicators/indices that would capture the 2 key aspects:
✍️ AI ROI on CAPEX (a quantitative objective gauge)
✍️ AI Sentiment (a qualitative, mood gauge)
Sentiment is very high and investments have gone parabolic in the AI space, hence:
a rigorous oversight of capital conversion efficiency is necessary to gauge the AI ecosystem’s capacity for sustained growth and ability to translate all that into corporate financial returns
similarly, for the overall economy, it’s growth and potential going forward
Both the qualitative and quantitative gauges are essential to map the current trend and cycle position, allowing us to forecast the eventual stabilization, subsequent market correction (shakeout), and the identification of long-term sustainable winners.
Maverick Charts 57th edition done, 4 key charts with many insights + 1 Bonus!
You can check all the previous 56 editions in the Maverick Charts section!
Mission accomplished for me if the following resonates with you:
‘Hmm I never thought it that way’, ‘now that chart said a whole lot’, ‘now that chart was really interesting’, ‘now that is something new’, ‘now I got it!’, ‘you managed to turn something complex into something actually simple’
hence, if you got to see something differently, my approach gave you a different angle, it did help you connect your key dots, then we all do well here!
Research is NOT behind a paywall and NO pesky ads here unlike most other places!
Did you enjoy this by finding it interesting, saving you time and getting valuable insights? What would be appreciated?
Just sharing this around with like-minded people, and hitting the 🔄 & ❤️ buttons!
That’ll definitely support bringing in more & more independent investment research: from a single individual … not a corporate, bank, fund, click-baity media or so … !
Like this, the big positive externalities become the name of the game! Thank you!
Sharing = 3x win: you + your close ones + me!
Have a great next day! And never forget, keep compounding: family, friends, community, capital, knowledge, research and mindset!
With respect,
Mav 👋 🤝
“Compound interest is both the ultimate and biggest natural hedge!”
Maverick Equity Research
P.S. as some of you were on holidays, you might have missed my latest 2 reports:
the latest on the U.S. Economy decoded through the lens of real-time, high frequency and alternative data, enjoy this unique report:
the latest on Warren Buffet’s Berkshire Hathaway:
Berkshire’s 2nd quarter 2026 earnings report is expected soon on the 1st of August.
Once I am done with the financials, charts and key insights, I will send you the 2nd edition of “The Berkshire Hathaway Report” which is planned to be delivered each quarter, and ad-hoc when very important and timely!
✍️ Buffet’s Berkshire: The Legacy Continues! Stash Away Baby! Fundamentals, Buybacks, Optionality, Valuation, and … Patience! ✍️