

Dear all,
first things first! I got +300 emails since Sunday that the latest research ended up in your ‘Promotions’ or ‘Spam’ folder. I did some digging to understand why, and it seems that is because many are already sending out ‘Black Friday’ offers to people, hence email clients flag them as ‘Promotional’ or ‘Spam’ … based on idk what.
Well, there is nothing ‘Promotional’ or any what I call ‘Pre-Pre-Pre Black Friday’ offers here given that it is free, both from a paywall and ads. Yet I was was caught in this shady marketing/IT ‘trend’, and got flagged wrongly by email clients.
If +300 noticed this and emailed me, it is very likely many of you missed the post:
✍️ Model Portfolios by Maverick: Introduction & Preview
For the future, the easy technical tweaks that you can do so you don’t miss out:
Gmail users: move this email to your “Primary” inbox (from the Promotions tab) — check also your Spam folder, and mark this address as ‘Not Spam’ - if not there either, you should look in the ‘Social’ tab
Desktop users in general: back out of this email, and then drag and drop this email into the “Primary” tab near the top left of your screen
Phone users: hit the 3 dots at top right corner, click “Move to” then “Primary.”
Apple e-mail users: tap on our email address at the top of this email (next to “From:” on mobile) and click “Add to VIPs“
Mark at least one of my previous emails as ‘Important’ — Inbox delivery then!
And now back to the ✍️ Maverick Macro Charts of the Week, the 64th edition!
5 + 1 cherry picked Maverick Charts of the week say 10,000 words or more = the ‘How’!
Table of contents = the ‘What’! Executed in a succinct manner with the aim of a high density of ideas, because great research respects the reader’s time:
📊 Maverick Charts: ‘Live’, Actual and Underlying GDP, Weekly Economic Index
📊 Bonus: ‘POTUS’ Job Approval Rating
Objective: both data-driven insights + valuable food for thought = the ‘Why’!
📊 Maverick Charts: ‘Live’, Actual and Underlying GDP, Weekly Economic Index 📊
U.S. Q3 GDP latest estimates from the Atlanta FED & New York FED:
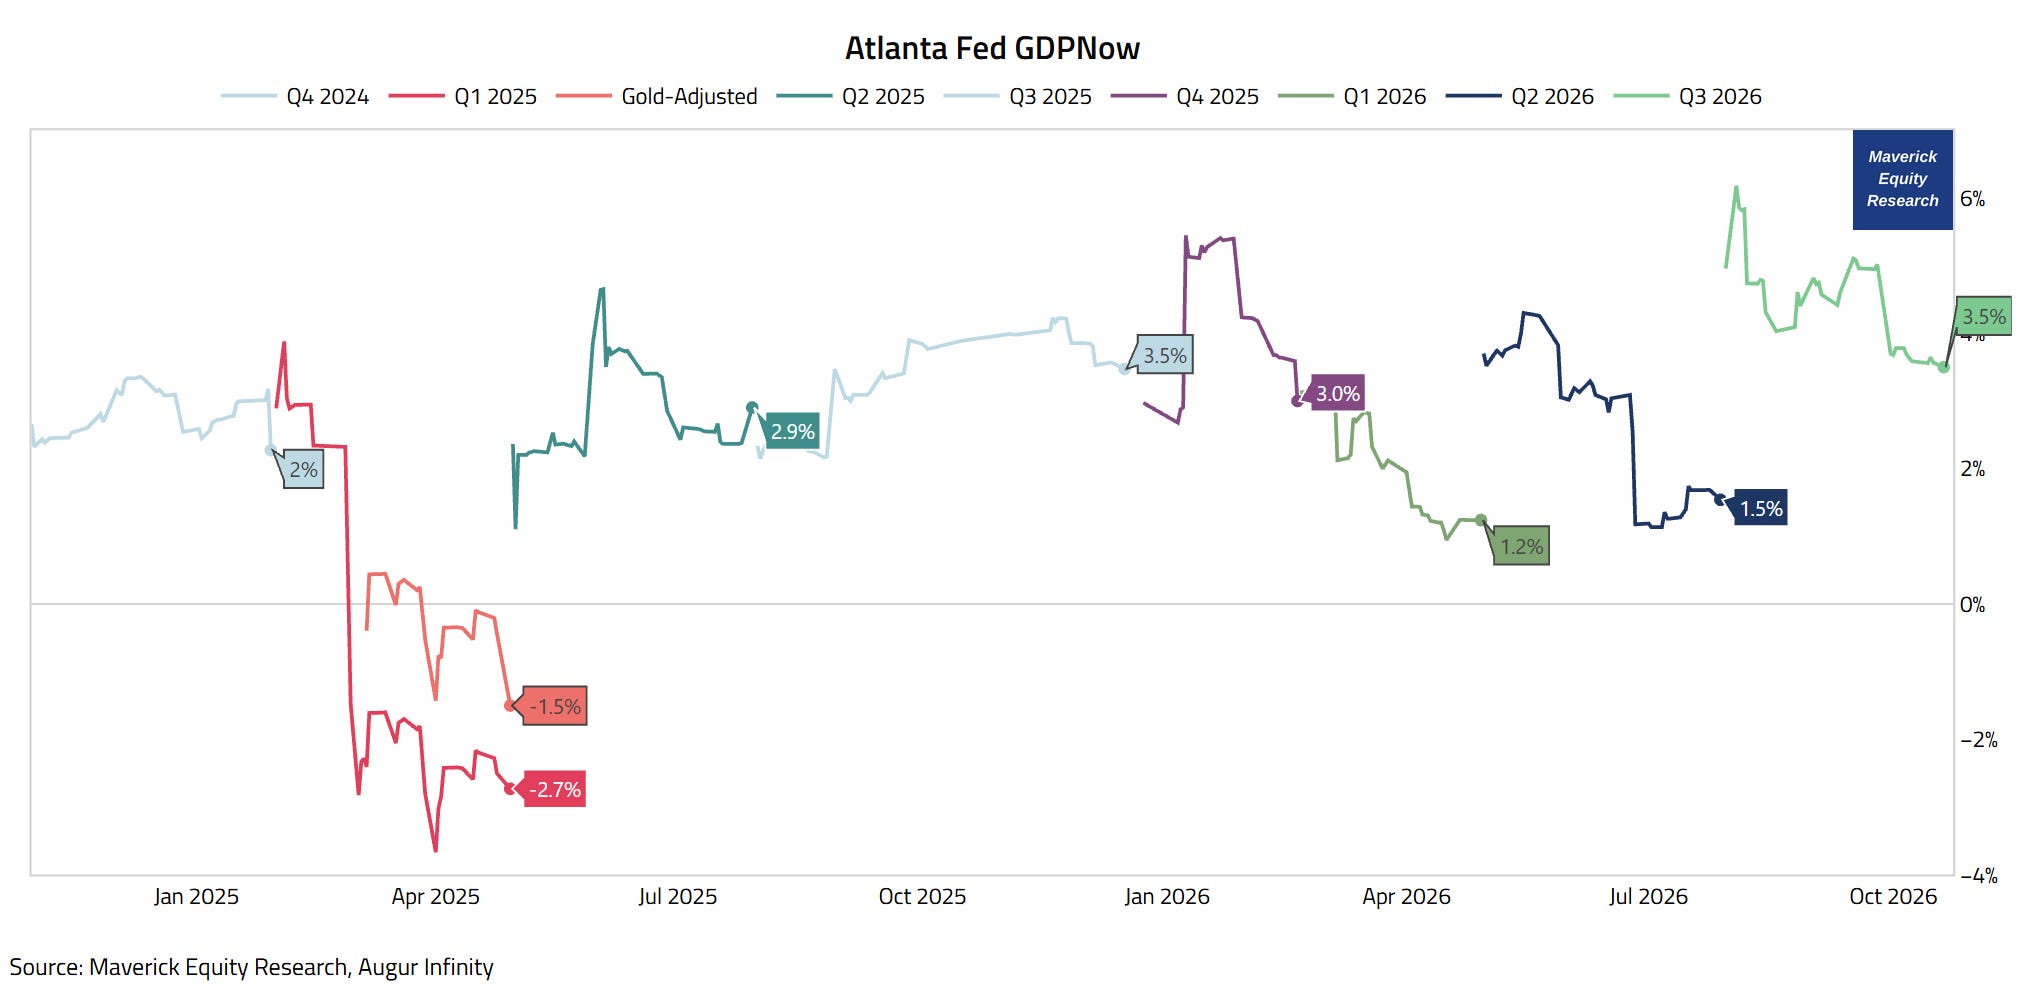
Atlanta Fed GDPNow real GDP, fresh latest estimate from today, October 20th!:
👉 +3.5% and note that it was even +6% (max 6.2%) when the quarter begun
A solid reading!
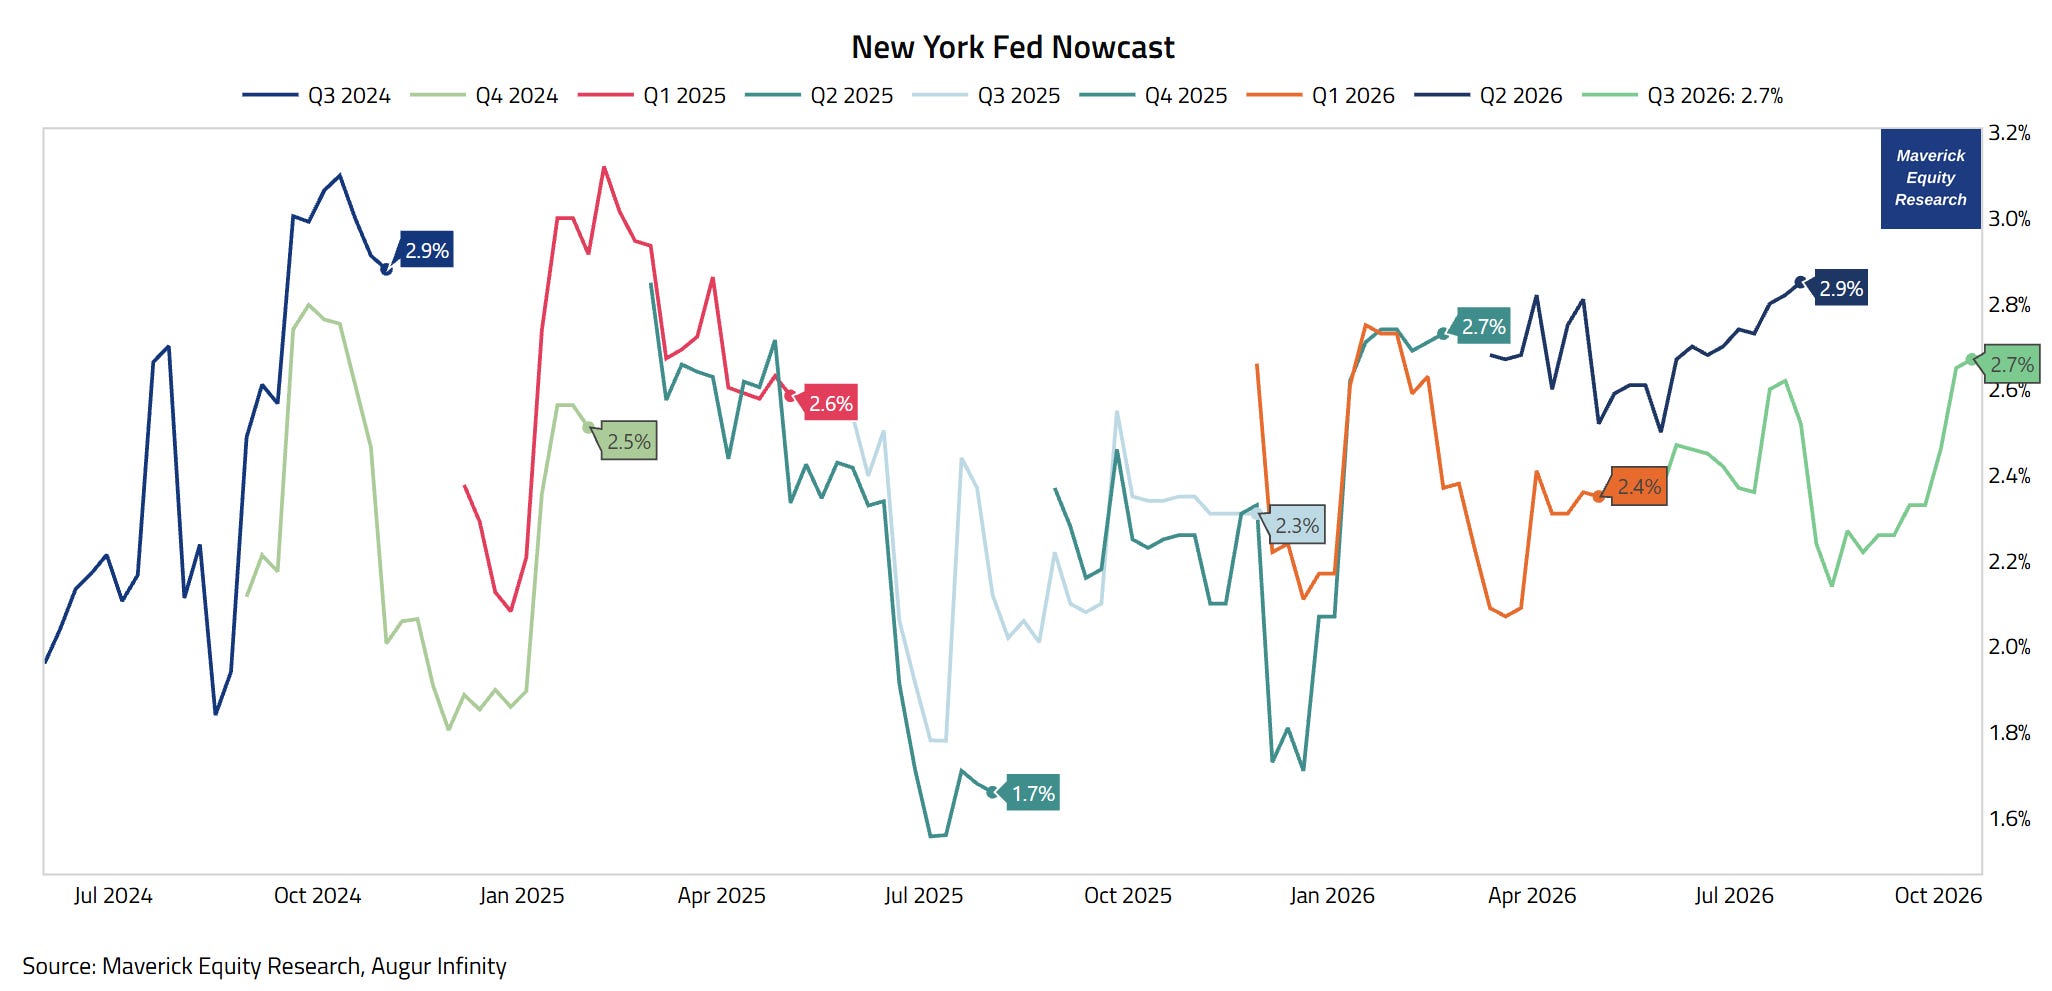
New York FED Nowcast, fresh latest estimate from 4 days ago, October 16th:
👉 +2.7% and note that it is a smoother / more compact estimate
A solid reading also!
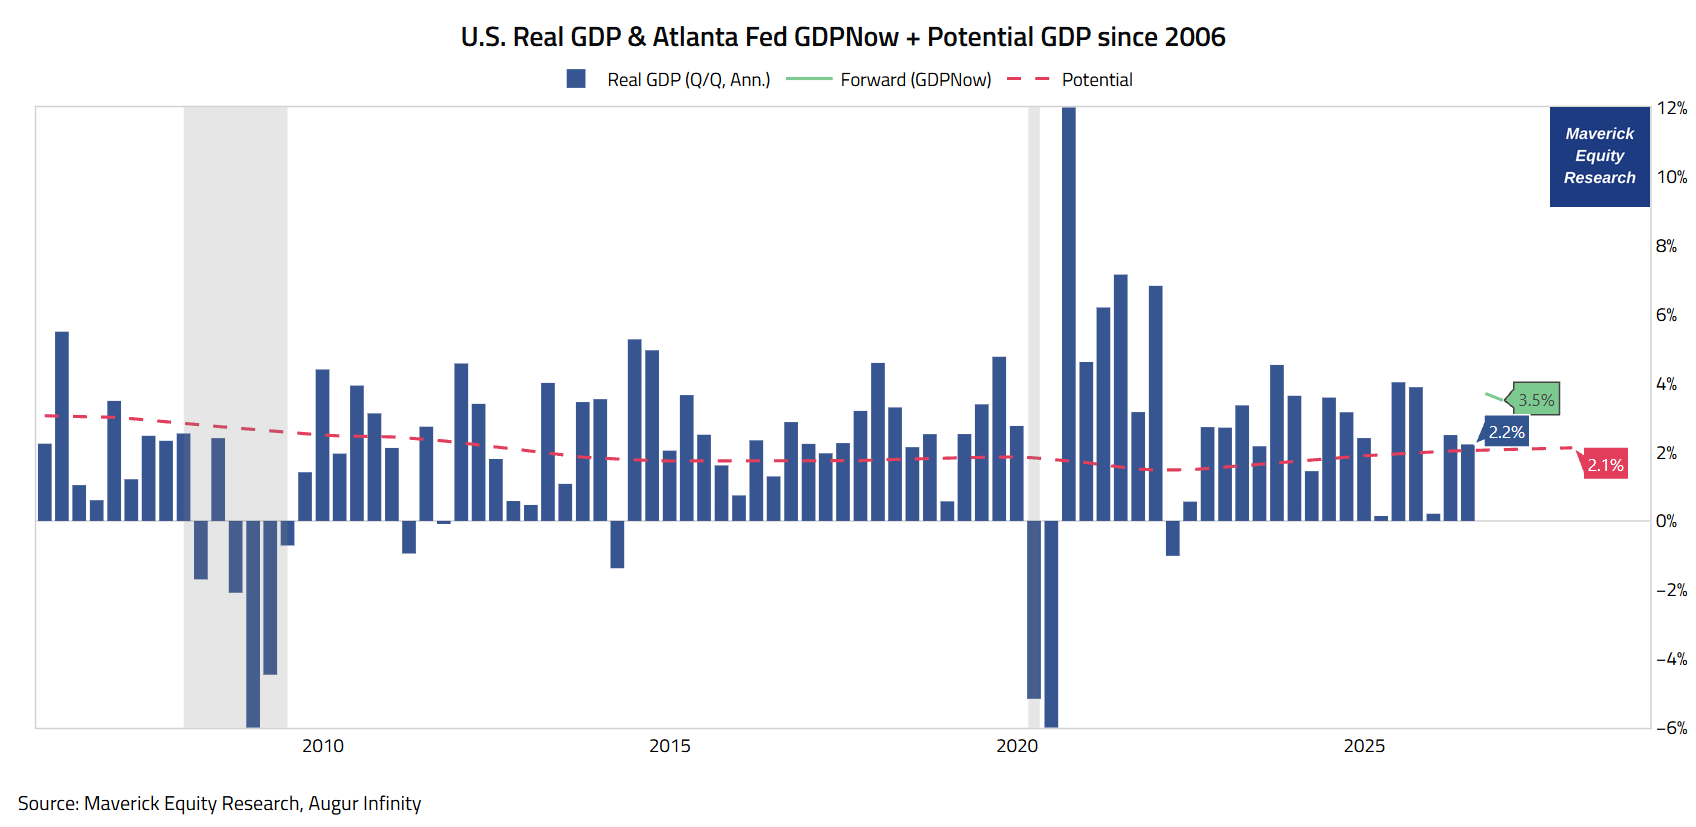
U.S. Real GDP growth & Atlanta Fed GDPNow + Potential GDP since 2006:
👉 Q1 2026: was also revised UP from 2.1% to 2.5%
👉 Q2 2026: was just revised UP from 1.5% to 2.2% annualized growth rate (blue)
👉 Q3 2026: live tracking above both Q1 & Q2, and above 2.1% Potential GDP (red):
3.5% and 2.7% as per Atlanta Fed GDPNow & New York Fed Nowcast respectively!
A good reading also!
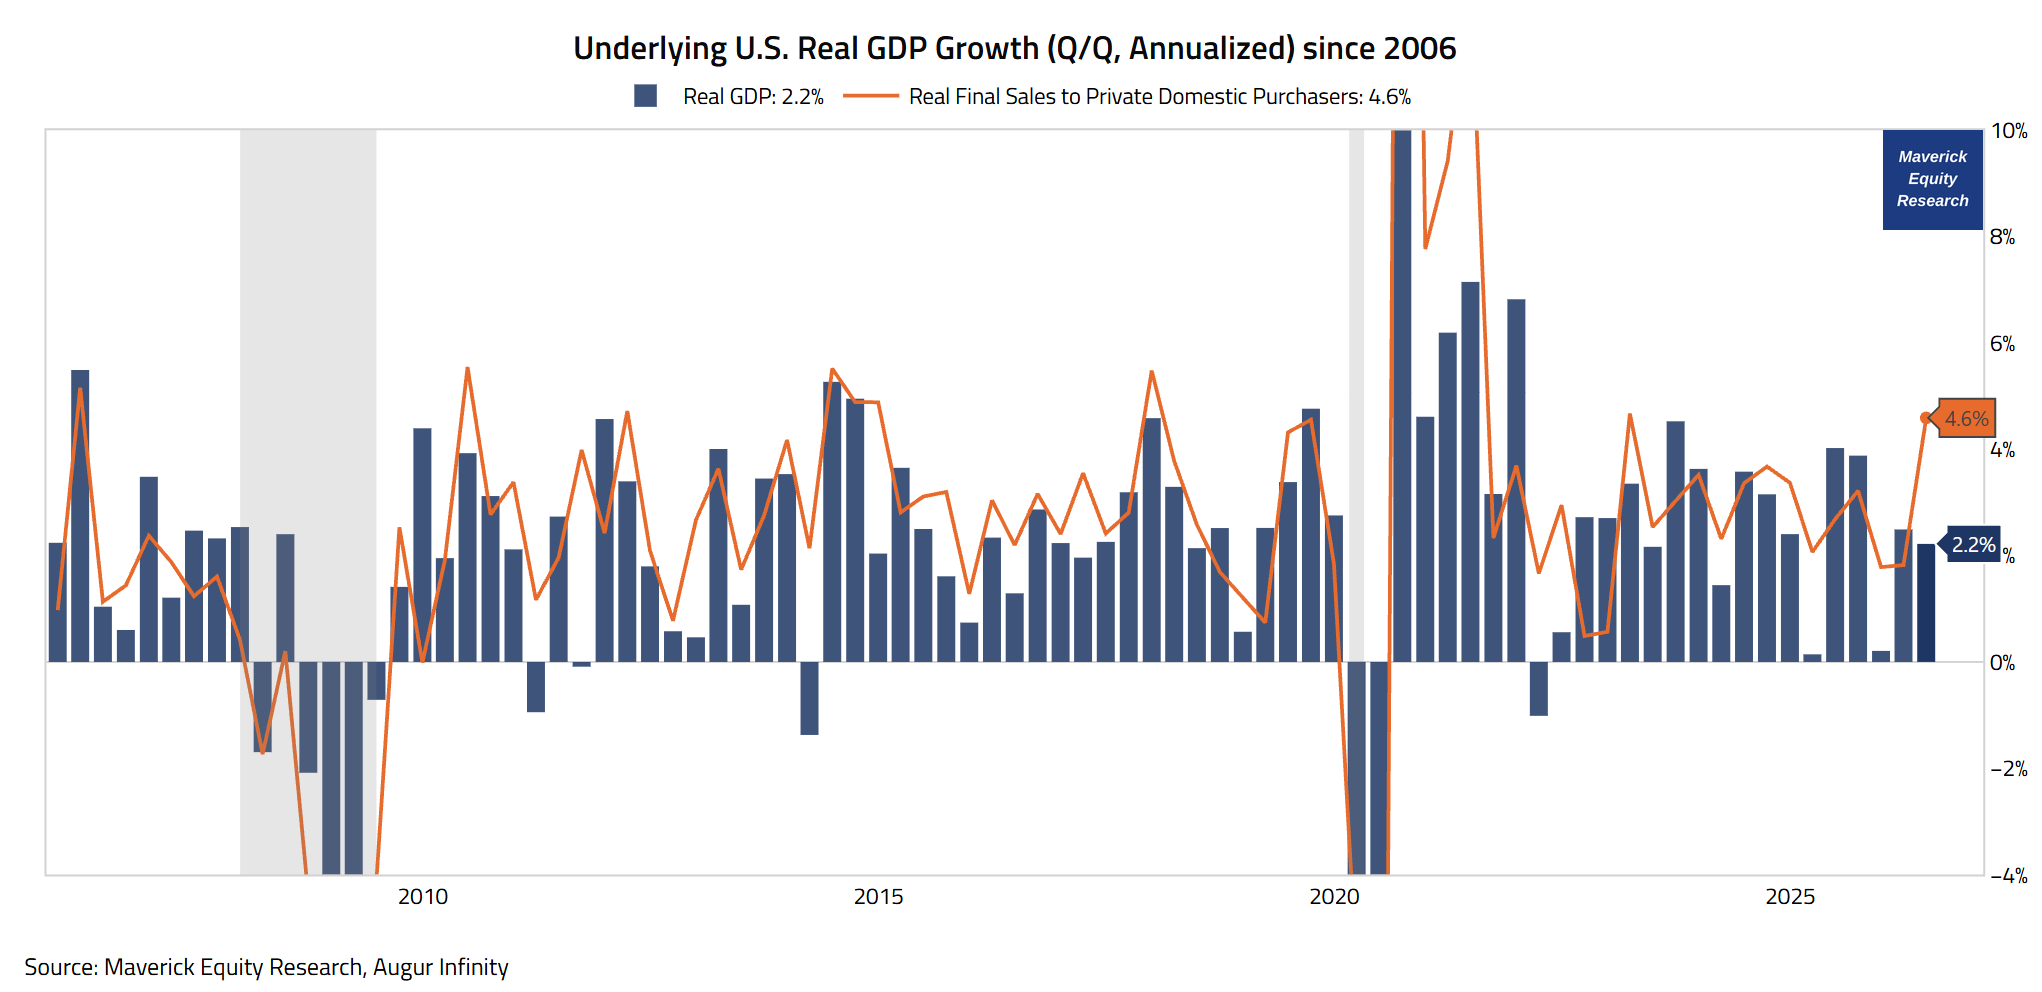
Underlying U.S. Real GDP Growth (Q/Q, Annualized) since 2006:
👉 Q2 2026: as mentioned, realised 2.2% annualized growth rate (blue)
What was the ‘underlying’ growth? That is tripping out government spending, net trade, and inventories — Real Final Sales to Private Domestic Purchasers (orange):
👉 a big jump to 4.6% from 1.8% in Q1 2026
Hence, a very good reading!
The U.S. Economy in Real-Time via another sleek high frequency data point which is highly complementary — it confirms or not the 4 from above.
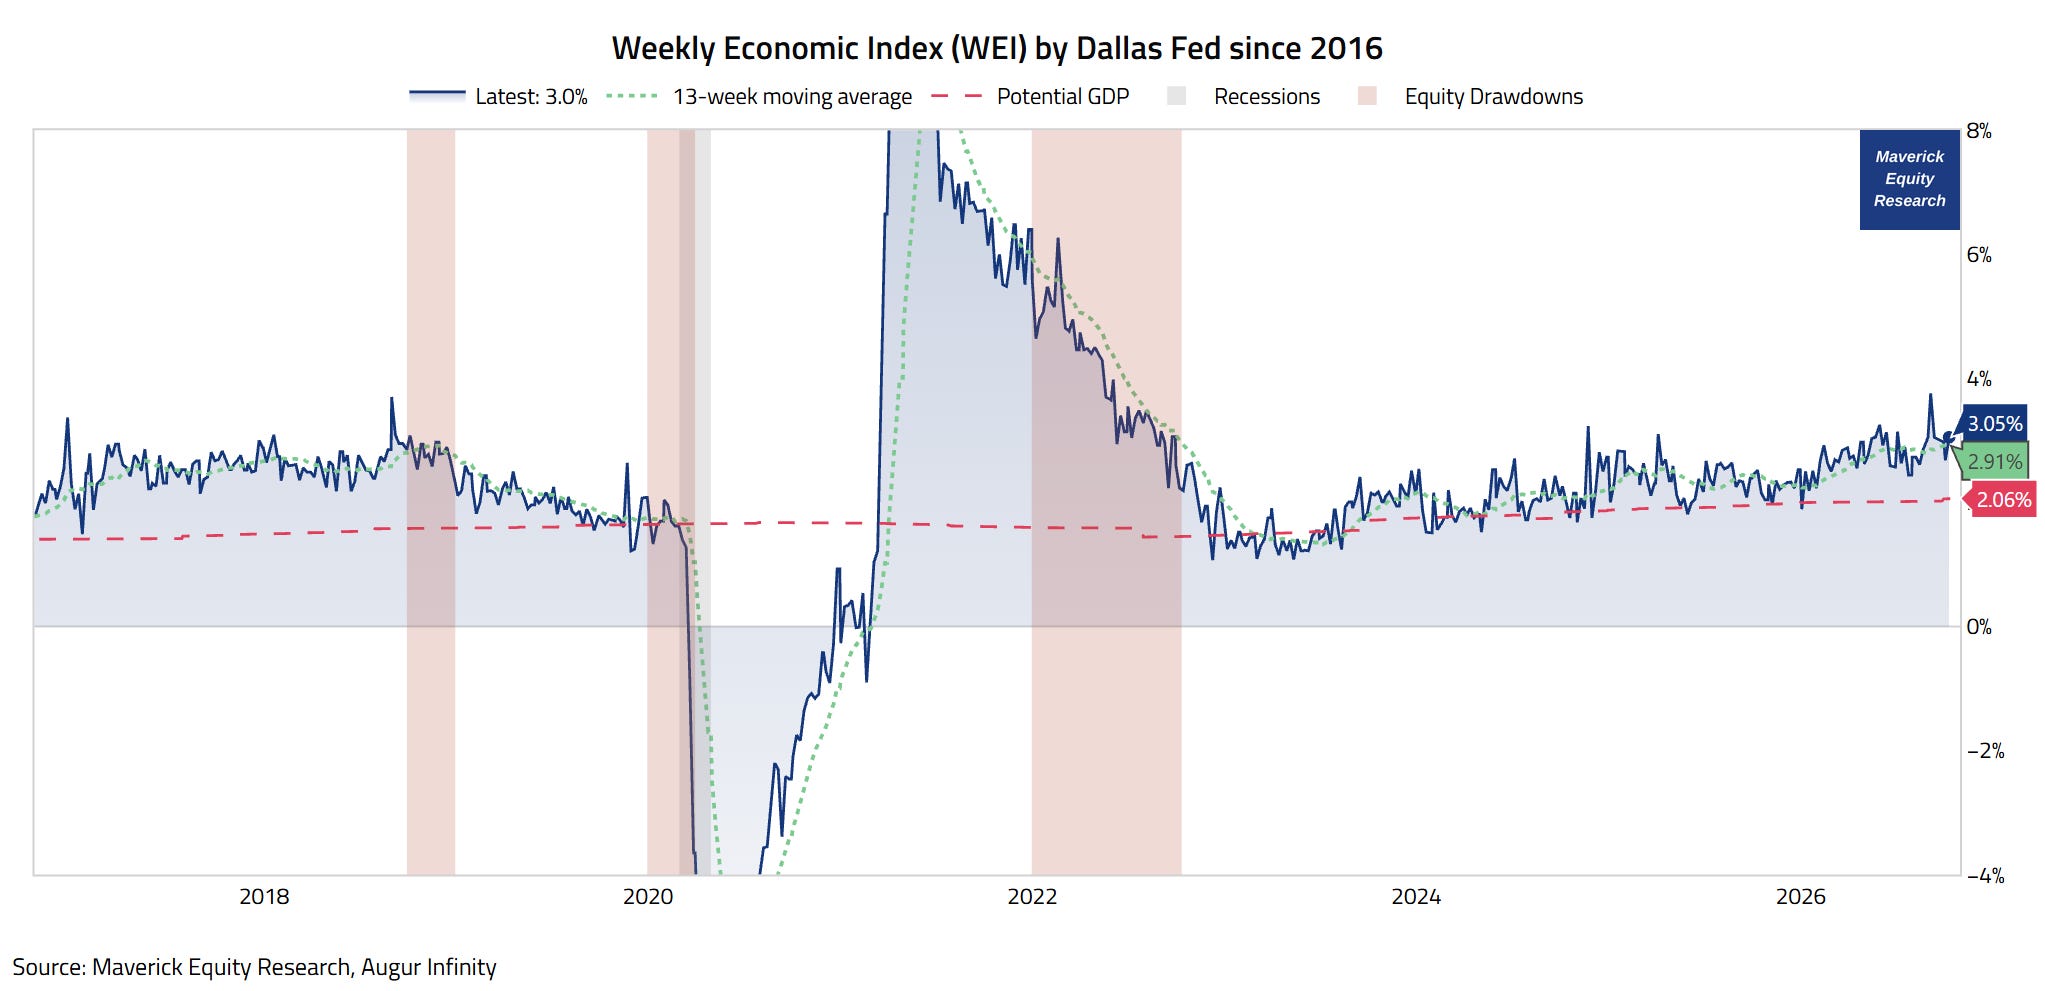
Weekly Economic Index (WEI) by Dallas Fed, a good GDP proxy as the index is scaled to align with year-over-year GDP growth, which gives it a concrete interpretive anchor beyond just being a directional signal:
👉 3.05% (blue) for the week ended October 10th, and 2.68% for October 3rd, according to the latest release from just 5 days ago, the 15th of October
basically, it is equivalent to a +3% year‑over‑year rise in GDP
signals that growth accelerated from the Q2 2.19% annual trend officially reported
and it is above the 2.06% Potential GDP (red)
👉 2.91% via my preferred view as the 13-week moving average = a smoother estimate
Not only defying the recent headwinds, but actually accelerating lately — hence also a strong signal for a great Q3 in 2026!
Simply put, another very good reading from a very good indicator!
“The economy is doing better than most think (or wish), isn’t it, Mav?“
Well, way more on the U.S. Economy via my 2 key deep dives for both Top-Down & Bottom-Up approaches, in essence connecting the mighty Macro-Finance bridge:
✍️ The State of the U.S. Economy in 75 Charts = A Deep Dive! ✍️
The report breaks down the U.S. economy and ultimately aims to answer three of the biggest questions in Finance and Economics:
“Which Sectors are Strong, Where is the Weakness?“
“How are the Fundamentals of the U.S. Economy?“
“What is the Ongoing Probability of a Recession?”
✍️ Decoding the U.S. Economy in Real-Time
Through Sleek High Frequency & Alternative Data ✍️
decoding the U.S. Economy by looking way beyond the traditional economic metrics, namely, through the lens of real-time, high frequency & alternative data!
in essence, a ‘live’ view on the state of the U.S. Economy, and quite a unique report which you do not see elsewhere!
a sharper and timely way to understand the macro forces shaping investing and overall financial markets!
📊 Bonus: ‘POTUS’ Job Approval Net Rating 📊
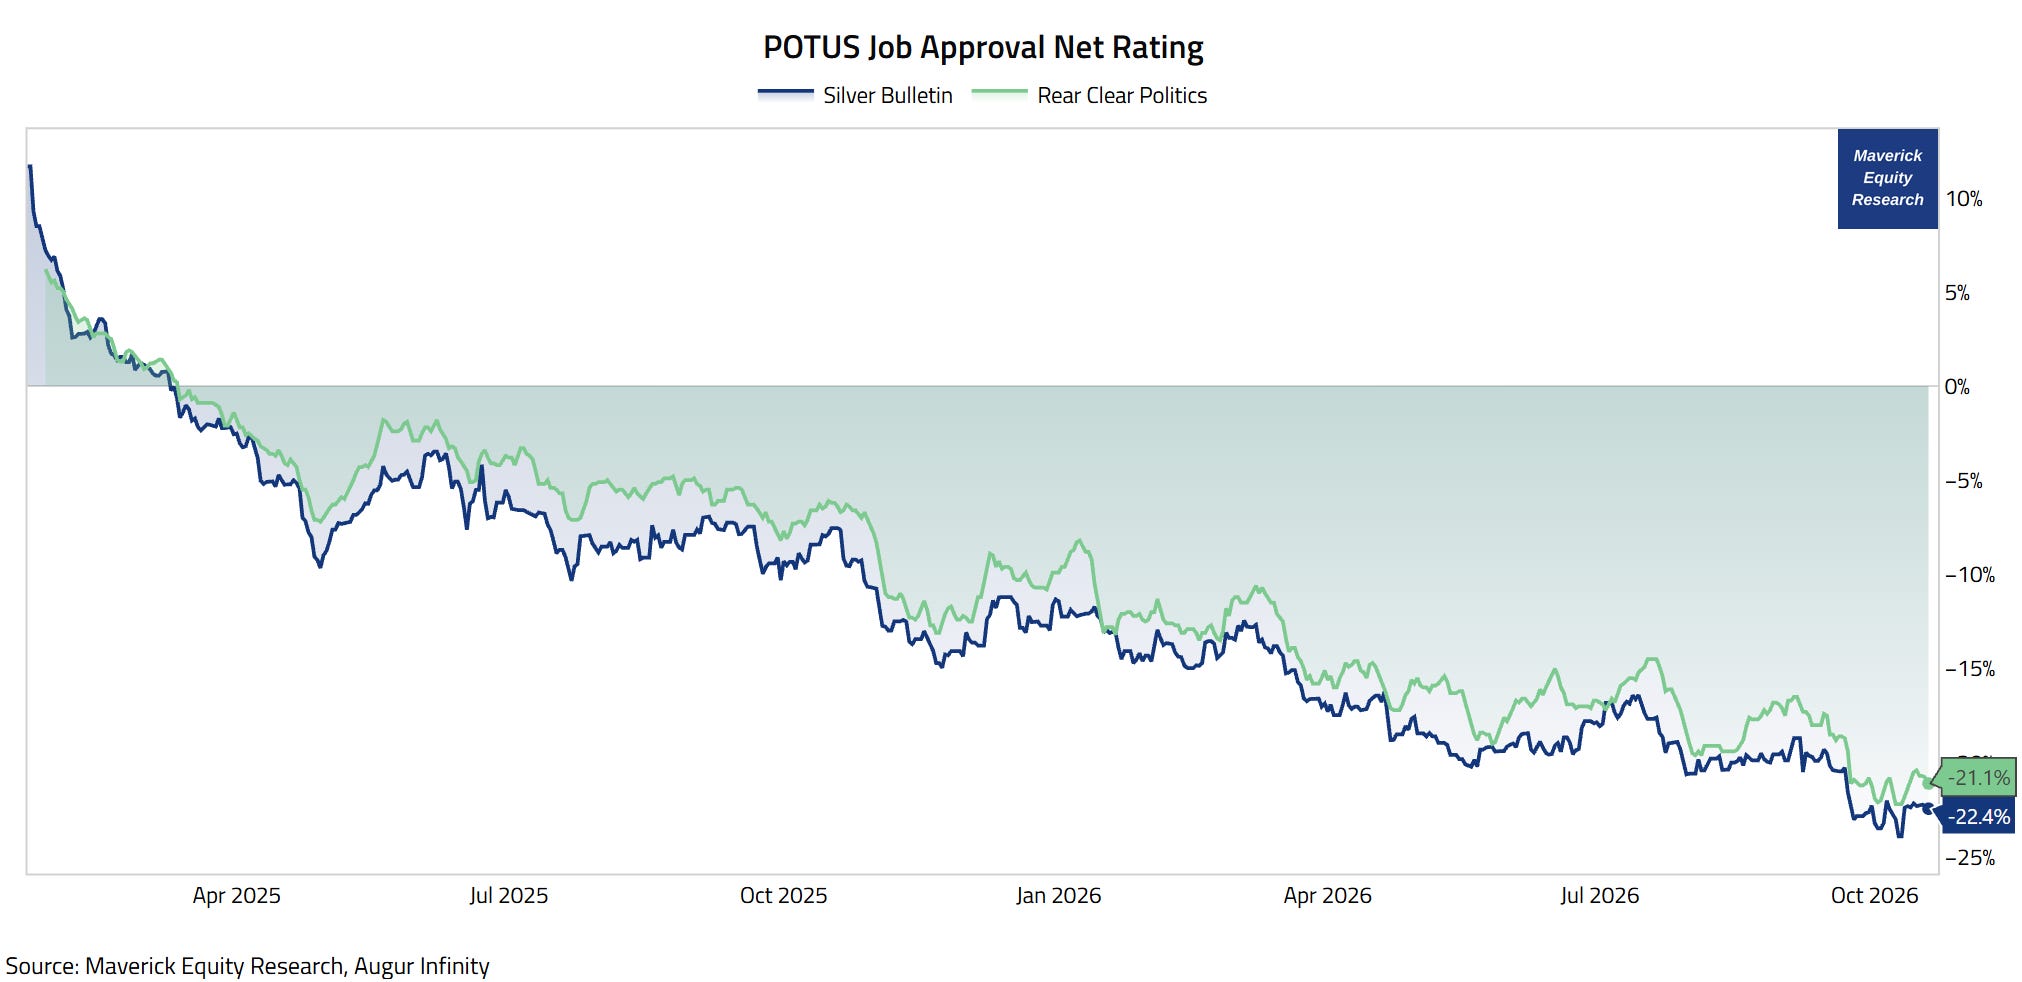
“What is the latest Job Approval Net Rating for the current POTUS, Mav?“
It keeps going down, and it has been negative since mid March 2025 (Trade War 2.0):
👉 -22.4% drop via Silver Bulletin
👉 -21.1% drop via Real Clear Politics
Takeaway:
The economy is doing well (overall), hence imagine if the economy was doing bad how much even bigger of a drop this would have been.
N.B. this is not a pro or against the current POTUS:
agnostic politics given independent research, hence apolitical is my A Game
I am not a U.S. citizen, can’t vote, no emotion, hence truly independent
the key is to know the facts, separate our investing & wallets from (desired) politics, being pragmatic to shape a solid forward outlook, and act accordingly
In case you missed my take on the importance of independent thinking and research:
✍️ Why Independent Investment and Economic Research = Paramount Nowadays!
“If something is nonsense, you say it and say it loud. You will be harmed a little but will be antifragile — in the long run people who need to trust, you will trust you!” Nassim Taleb
On independence in research, a buddy of mine from the industry asked me last week:
Q: "What is the value of independent research in general?
A: As almost always, the answer to any valuable service is: it depends! Assuming a good or very good skill set & experience, it is priceless! Why? Because anything else is either at least in question, it is very expensive, it does not adds value, and it can even be detrimental to the client/investor
Q: Yes yes Mav, but still, I don’t know, just put a $ price tag on it, can you?!
A: Ok, forcing my hand here, but at least $150,000 a year
Q: Hmmm can it be that, give me some rope here, a hint!
A: $150,000 a year’ is likely even cheap given that is the price of a mid advisor, banker — who’s main ‘mission’ is to dress up nicely daily, forcefully smile, go with the flow, sit half of the working day on Twitter & LinkedIn, not disturb much even if being right, focus on his own and the bosses’ salary + bonus, and only then lastly the end client/investor
Q: Ha, yeah, funny because it is true, and yes, $150k can even be rather deep value!"
Maverick Charts 64th edition done, 5 key charts with many insights + 1 Bonus!
You can check all the previous 63 editions in the Maverick Charts section!
Mission accomplished for me if the following resonates with you:
‘Hmm I never thought it that way’, ‘now that chart said a whole lot’, ‘now that chart was really interesting’, ‘now that is something new’, ‘now I got it!’, ‘you managed to turn something complex into something actually simple’
hence, if you got to see something differently, my approach gave you a different angle, it did help you connect your key dots, then we all do well here!
Research is NOT behind a paywall and NO pesky ads here unlike most other places!
Did you enjoy this by finding it interesting, saving you time and getting valuable insights? What would be appreciated?
Just sharing this around with like-minded people, and hitting the 🔄 & ❤️ buttons!
That’ll definitely support bringing in more & more independent investment research!
Like this, the big positive externalities become the name of the game! Thank you!
Sharing = 3x win: you + your close ones + me!
Have a great day! And never forget, keep compounding: family, friends, community, capital, knowledge, research and mindset!
With respect,
Mav 👋 🤝
“Compound interest is both the ultimate and biggest natural hedge!”
Maverick Equity Research

GDPNow started the quarter near 6% and is at 3.5% now, the New York Fed at 2.7%. Which of the two has been closer to the actual number in the last few quarters?
Love how much ground these five charts cover in such a short read. The jump in underlying growth to 4.6% really stood out to me. Having the Atlanta Fed and New York Fed estimates side by side makes the picture feel clear and easy to follow. Thanks for putting this together.